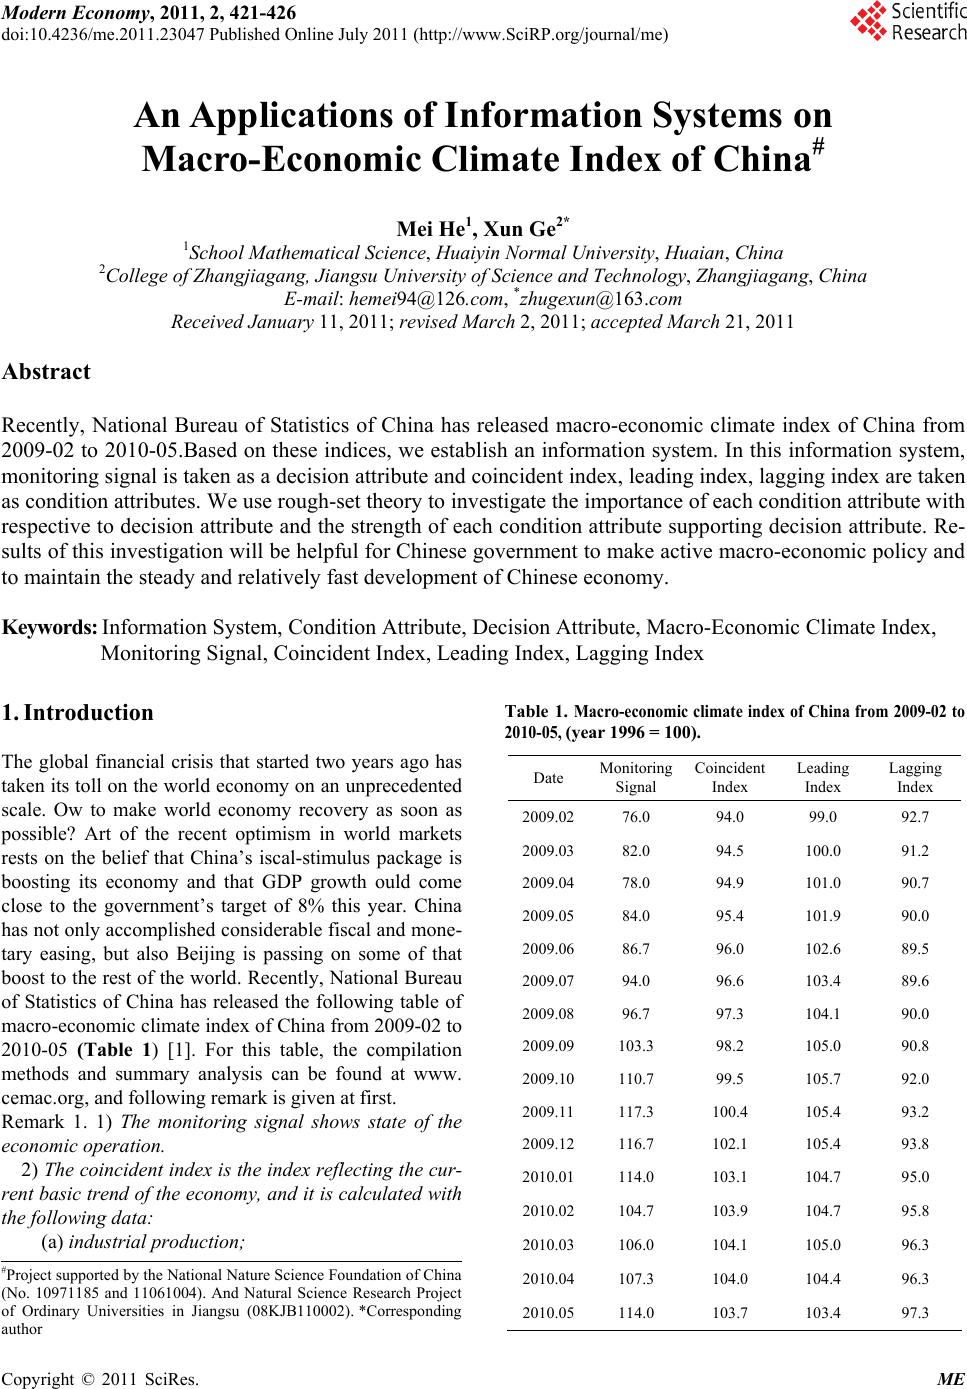
 Modern Economy, 2011, 2, 421-426 doi:10.4236/me.2011.23047 Published Online July 2011 (http://www.SciRP.org/journal/me) Copyright © 2011 SciRes. ME An Applications of Information Systems on Macro-Economic Climate Index of China# Mei He1, Xun Ge2* 1School Mathematical Science, Huaiyin Normal University, Huaian, China 2College of Zhangjiagang, Jiangsu University of Science and Technology, Zhangjiagang, China E-mail: hemei94@126.com, *zhugexun@163.com Received January 11, 2011; revised March 2, 2011; accepted March 21, 2011 Abstract Recently, National Bureau of Statistics of China has released macro-economic climate index of China from 2009-02 to 2010-05.Based on these indices, we establish an information system. In this information system, monitoring signal is taken as a decision attribute and coincident index, leading index, lagging index are taken as condition attributes. We use rough-set theory to investigate the importance of each condition attribute with respective to decision attribute and the strength of each condition attribute supporting decision attribute. Re- sults of this investigation will be helpful for Chinese government to make active macro-economic policy and to maintain the steady and relatively fast development of Chinese economy. Keywords: Information System, Condition Attribute, Decision Attribute, Macro-Economic Climate Index, Monitoring Signal, Coincident Index, Leading Index, Lagging Index 1. Introduction The global financial crisis that started two years ago has taken its toll on the world economy on an unprecedented scale. Ow to make world economy recovery as soon as possible? Art of the recent optimism in world markets rests on the belief that China’s iscal-stimulus package is boosting its economy and that GDP growth ould come close to the government’s target of 8% this year. China has not only accomplished considerable fiscal and mone- tary easing, but also Beijing is passing on some of that boost to the rest of the world. Recently, National Bureau of Statistics of China has released the following table of macro-economic climate index of China from 2009-02 to 2010-05 (Table 1) [1]. For this table, the compilation methods and summary analysis can be found at www. cemac.org, and following remark is given at first. Remark 1. 1) The monitoring signal shows state of the economic operation. 2) The coincident index is the index reflecting the cur- rent basic trend of the economy, and it is calculated with the following data: (a) industrial production; Table 1. Macro-economic climate index of China from 2009-02 to 2010-05, (year 1996 = 100). Date Monitoring Signal Coincident Index Leading Index Lagging Index 2009.0276.0 94.0 99.0 92.7 2009.0382.0 94.5 100.0 91.2 2009.0478.0 94.9 101.0 90.7 2009.0584.0 95.4 101.9 90.0 2009.0686.7 96.0 102.6 89.5 2009.0794.0 96.6 103.4 89.6 2009.0896.7 97.3 104.1 90.0 2009.09103.3 98.2 105.0 90.8 2009.10110.7 99.5 105.7 92.0 2009.11117.3 100.4 105.4 93.2 2009.12116.7 102.1 105.4 93.8 2010.01114.0 103.1 104.7 95.0 2010.02104.7 103.9 104.7 95.8 2010.03106.0 104.1 105.0 96.3 2010.04107.3 104.0 104.4 96.3 2010.05114.0 103.7 103.4 97.3 #Project supported by the National Nature Science Foundation of China (No. 10971185 and 11061004). And Natural Science Research Project of Ordinary Universities in Jiangsu (08KJB110002). *Corresponding author  M. HE ET AL. 422 b) employment; c) social demands (including investment, consump- tion and foreign trade); d) social incomes (including the government taxes, profits of enterprises and income of residents). 3) The leading index is calculated with a group of leading indicators, which take a lead before the coinci- dent index, and is used for forecasting the future eco- nomic trend. 4) The lagging index is calculated with the lagging in- dicators, which lag behind the coincident index, and is mainly used for confirming the peak and valley of the economic cycle. Naturally, we are interested in some relations between monitoring signal and its impacting factors (coincident index, leading index, lagging index) in the above table. In macro-economic climate index of China, monitoring signal of each month, as well as the associated its im- pacting factors are uncertain decisions, so it is unlikely to be appropriate to use traditional analytic methods (e.g. synthesis, appraisal, stratification and estimate of prob- ability). However rough-set theory, which is a logic- mathematical method proposed by Z. Pawlak, has shown to be an effective tool in analyzing this type of issues [2-5]. In recent years, this theory has been widely imple- mented in the many fields of natural science and societal science [6-9,10,11-13]. In this paper, we establish an in- formation system based on the above table. In this infor- mation system, monitoring signal is taken as a decision attribute and coincident index, leading index, lagging index are taken as condition attributes. We use rough-set theory to investigate the importance of each condition attribute with respective to decision attribute and the strength of each condition attribute supporting decision attribute. Results of this investigation will be helpful for Chinese government to make active macro-economic policy and to maintain the steady and relatively fast de- velopment of Chinese economy. 2. Propaedeutics Propaedeutics in this section belongs to Z. Pawlak [2-5, 13]. Remark 2. 1) For a set B, B denotes the cardinal of B. 2) For a family of sets 12 ,,,,: 1,2,, F:1, 2,,: F,1,2,, ki iii FFFF ik ikFi k . 3) Let R be an equivalence relation on a set U. U/R denotes the family consisting of all equivalence classes with respect to R and [u] denotes the equivalence class with respect to R containing uU . 4) Let R be a family of equivalence relations on U. Then R:RUR is a partition of U and is de- noted by RU. The equivalence relation induced by RU is also denoted by R. Definition 1. ,,,SUAVfis called an information system. 1) U, a nonempty finite set, is called the universe of discourse. 2) CD is a finite set of attributes, where C and D are disjoint nonempty sets of condition attributes and decision attributes respectively. 3) : UA V is an information function. 4) :VV A , where . ,:VfuuU Remark 3. An information system can be expressed a date table, which is called decision table, whose columns are labeled by elements of A, rows are labeled by elements of U, and f(u,a) lies in the cross of the row labeled by u and the column labeled by a. ,,,SUAVf Definition 2. Let ,,,SUCDVf be an infor- mation system. 1) For aCD , we define an equivalence relation “~” on U as follows: ~, ij ij uufuafua, . U/a denotes the family consisting of all equivalence classes with respect to “~”. 2) For , BCD :UbbB is a partition of U, which is denoted U/B. The equivalence relation in- duced by U/B is also denoted by B. Definition 3 Let R be an equivalence relation on an universe U of discourse, and U. Put RX ,uu URuX. RX is called lower ap- proximation of X. 3. Decision Table In this section, we establish an information system ,,,SUCDVf for our investigation, which is obtained by transforming the table of macro-economic climate index of China from 2009-02 to 2010-05 and includes all information we need in this investigation. Remark 4. Put 123456789 10 1112 13 14 15 16 ,,,,,,,,, ,,,,,, U uuuuuuuuu uuuuuuu where 12345678910111213141516 ,,,,,,,,, ,, , , ,,uuuuuuuuuu uu u u uu denote sixteen months from 2009-02 to 2010-05 in turn. U is the universe of discourse in ,,,SUCDVf. Remark 5. Put D = {d}, where d denotes monitoring signal. D is the set of a decision attribute in Copyright © 2011 SciRes. ME  M. HE ET AL.423 ,,,SUCDVf. Remark 6. Put , where 123 de- note coincident index, leading index, lagging index re- spectively. C is the set of three condition attributes in . 123 ,,Cccc ,f ,,ccc ,,SU CDV Remark 7. f and V in ,f,,CDVSU are given as Definition 1 and Remark 3. This information system is expressed by the following decision table. (Table 2) ,,,SUCDVf Remark 8. Monitoring signals are divided three levels: cooling, stable and heating. 1) indicates monitoring signal less than 95.0. 1 d d 2) indicates monitoring signal between 95.0 and 110.0. 2 3) indicates monitoring signal more than 110.0. 3 Remark 9. Coincident Indices are divided three levels: cooling, stable and heating. d 1) indicates coincident index less than 97.0. 11 c c 2) indicates coincident index between 97.0 and 101.0. 21 3) indicates coincident index more than 101.0. 31 Remark 10. Leading Indices are divided three levels: cooling, stable and heating. c 1) indicates leading index less than 103.0. 12 c c 2) indicates leading index between 103.0 and 104.9. 22 3) indicates leading index more than 104.9. 32 c Table 2. Decision table. U d 1 c 2 c 1 u 1 d 11 c 12 c 23 c 2 u 1 d 11 c 12 c 23 c 3 u 1 d 11 c 12 c 13 c 4 u 1 d 11 c 12 c 13 c 5 u 1 d 11 c 12 c 13 c 6 u 1 d 11 c 22 c 13 c 7 u 2 d 21 c 22 c 13 c 8 u 2 d 21 c 32 c 13 c 9 u 3 d 21 c 32 c 23 c 10 u 3 d 21 c 32 c 23 c 11 u 3 d 31 c 32 c 23 c 12 u 3 d 31 c 22 c 33 c 13 u 2 d 31 c 22 c 33 c 14 u 2 d 31 c 32 c 33 c 15 u 2 d 31 c 22 c 33 c 16 u 3 d 31 c 22 c 33 c Remark 11. Lagging Indices are divided three levels: cooling, stable and heating. 1) indicates lagging index less than 91.0. 13 c c 2) indicates lagging index between 91.0 and 94.0. 23 3) indicates lagging index more than 94.0. 33 By some simple operations, we obtain the following related partitions of . c U Proposition 1. The following are some related parti- tions of . U 1) 123456 78131415 ,,,,,,,, , ,,Uduuu uu uuu uuu 910111216 ,,,,uu uu u. 2) 1123456 78910 ,,,,,, ,,,,Ucuuuuuuu u u u 1112 1314 15 16 ,,,,,uuuuuu . 3) 2123456712131516 /{{,,,,},{,,,,,}Ucuuuuuuuu u u u, 89 10 1114 ,,, ,uuuu u. 4) 3345678 1291011 ,,,,,,,,, ,,Ucuu uu u uuu u uu 12 13 14 15 16 ,,,,uuuuu . 5) 12 3456 78 ,,,,,, , UCuuuuuu u u 910 111213151614 ,,, ,,,,uuuu u uuu. 6) 2312345 67 8 ,,,,,,,,Uccuuuuu uuu, 910111213151614 ,,, ,,,,uu uu u uuu. 7) 1312 3456 78 ,,,,,,,,, Uccuuuuuu uu 910 111213141516 ,,,,,,uuuu uu uu . 8) 1212345 6 7 ,,,,,,,Uccuuuuu u u, 89 10111412 13 15 16 ,,,,,,, ,uuuuuuuuu. 4. Importance Definition 4. Let be a family of equivalence rela- tions on URR and R Let Q be an equivalence relan . tioon U. 1) Put :posQRXXU Q R. R posQ is called positive region of Q with respect to R. 2) Put R R pos Q QU . RQ is called dependable degree of Q with respect to R. 3) Put RQRR R RQ Q . RQ R is called importance of R’ with respect to Q . Remark 12. For information system ,,,SUCDVf, let cC .Put Copyright © 2011 SciRes. ME 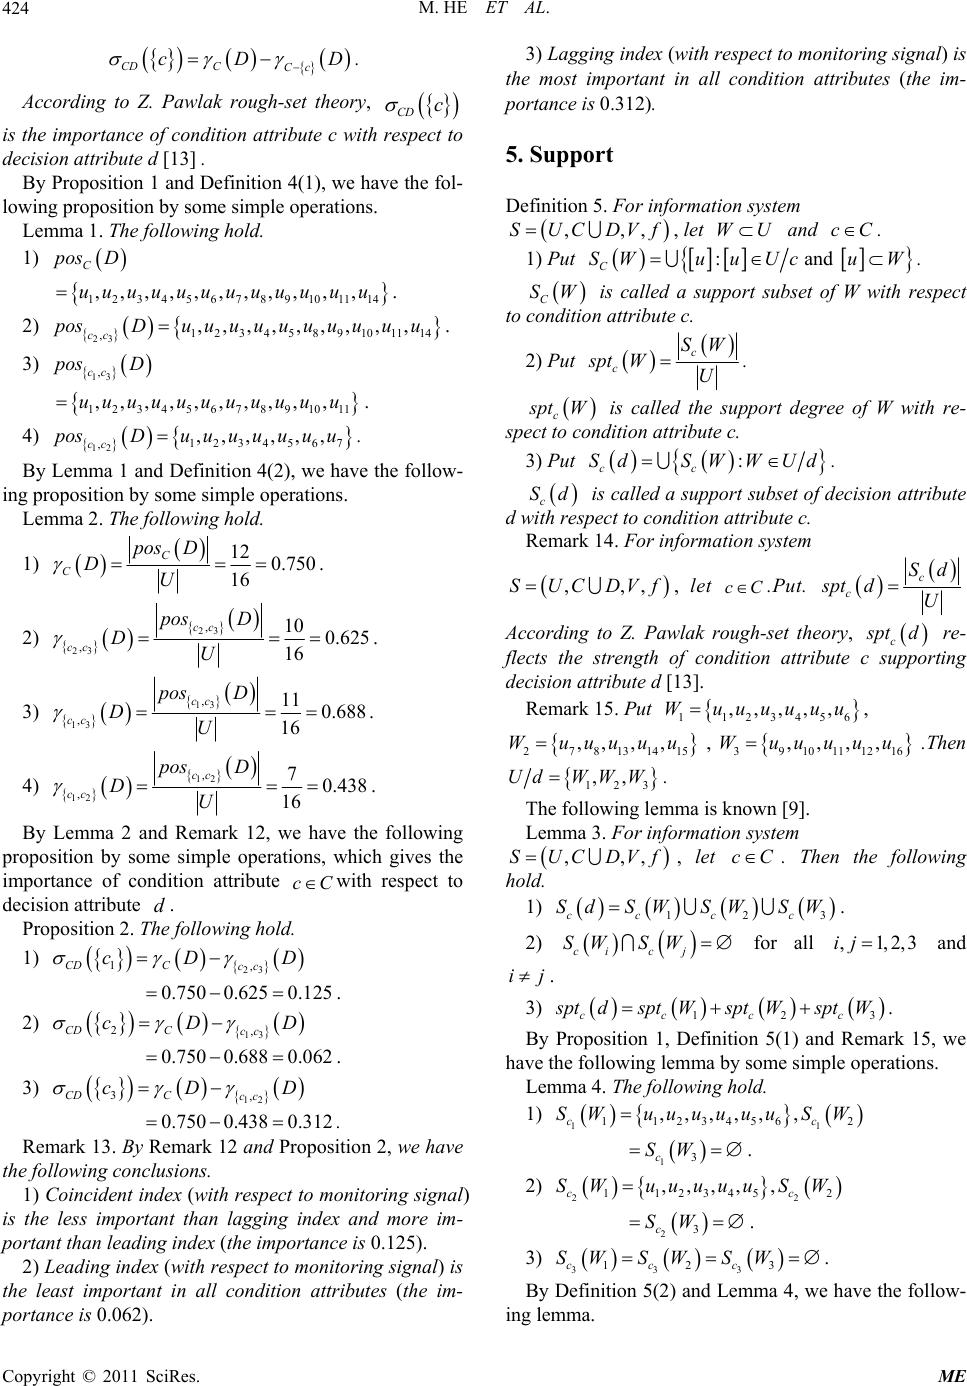 M. HE ET AL. 424 D According to Z. Pawlak rough-set theo CD C cD . Cc ry, CD c is 2) 4) Lemma 1 and Definition 4(2), we have the follow- in the importance of condition attribute c with respect to decision attribute d [13] . By Proposition 1 and Definition 4(1), we have the fol- lowing proposition by some simple operations. Lemma 1. The following hold. 1) C posD 456789101114 ,,,,,, , ,uuuuuuu u. 12 ,,uu3 ,uu 11 23 12 3 4 5891014 ,,,,,,,, , , cc posDuuuuuuuu u u. 3) 13 ,cc pos D 1234 ,,uuuu 567891011 ,,,,,,,,uuuu u. uu 12 1234567 ,,,,,,, cc posD uuuuuuu. By g proposition by some simple operations. Lemma 2. The following hold. 1) 12 0.750 C pos D D 16 CU. 2) 23 23 , , 10 0.625 16 cc cc pos D DU . 3) 13 13 , , 11 0.688 16 cc cc pos D DU . 4) 12 12 , , 70.438 16 cc cc pos D DU . Bye follo Lemma 2 and Remark 12, we have thwing pr 2) D 3) oposition by some simple operations, which gives the importance of condition attribute cCwith respect to decision attribute d. Proposition 2. The following hold. 1) 23 1, CDC cc cD D 0.750 0.6250.125 . 13 2, CDC cc cD 0.750 0.6880.062 . 12 3, CDCcc cD 0.750 0.4380.3 D Remark 13. By Remark 12 and Proposition 2, we have th port in all condition attributes (the im- po or information system 12 . e following conclusions. 1) Coincident index (with respect to monitoring signal) is the less important than lagging index and more im- portant than leading index (the importance is 0.125). 2) Leading index (with respect to monitoring signal) is the least important in all condition attributes (the im- ance is 0.062). 3) Lagging index (with respect to monitoring signal) is the most important rtance is 0.312). 5. Support Definition 5. F ,,,SUCDVf, let and WUcC. 1) Put W. : an C SWuuUcd u C SW conditio is called pport su W wh respect ton attribute c. a subset ofit 2) Put c c SW spt WU . c pt Wppo ect to cond is called the surt degree of W with re- spition attribute c. 3) Put : cc d SWWUd. S Sd is called a support s c with res ubset of decision attribute d pect to condition attribute c. Remark 14. For information system ,,,UCDVf, let cC.Put. S c c Sd spt dU According to Z. Pawugh-ry, lak roset theo c pt d c support re- flects the strength of condition attribute ing decision attribute d [13]. Remark 15. Put 1 123456 ,,,,,W uuuuuu, ,, , ,Wuuuuu, 2 781314215 39 10 111 ,,W uuu 16 ,,uu .Then 123 . ,,Ud WWW The following lemma known [9]. Lemma 3. For inrmation system is fo ,,,UCDVf, let cC. ThS ho en the following 1) ld. 12cc Sd SWWSW 3c c S. 2) cic j SWSW for all 3 and ,1,2,ij ij . 3) 12cc cc 3 ptdsptWspt WsptW. By Prork 15, ve t position 1, Definition 5(1) and Remawe hahe following lemma by some simple operations. Lemma 4. The following hold. 1) 1 6 2 ,,,,, , c S WuuuuuuS W 1 1 12345c 13c SW . 22 1 123452 ,,,,, cc SWuuuuuSW 23c SW . 2) 33 3 123cc c SW SWSW . 3) ition 5(2) and Lemma 4, we have the follow- inma. By Defin g lem Copyright © 2011 SciRes. ME  M. HE ET AL.425 Lemma 5. The following hold. 1) 1 1 1 1 6; 16 c c SW spt WU 1 1 ci ci SW spt WU 00; 16 for 2) 2,3i. 2 22 2 1; 16 c ci cci SW SW spt Wspt W UU 15 00; 16 for . 3) 2,3i 3 3 0i 01 ,2,3. 16 ci ci SW spt Wfor U ma 3(3), Lemma 5 and Remark 14, weave the following proposition, which gives the strength of co follow ) 3 By Lem h ndition attribute cCsupporting decision attribute d. Proposition 3. The ing hold. 1 1 c 11 1 12cc c ptdsptWspt Wspt W 60.375 16 . 2) 3 22 22 12cc cc ptdspt WWspt W spt 50.313 16 . 3) ark 16. By Remark 14 and Proposition 3, we have thllowing conclusions. is maximal in strength co hich is less than the strength of co al) is 0, which is minimum in strengths of c tio per, we give some explanations 1) The investigation in this paper is conducted with a ndex of nite universe $U$ of discourse, but by using th u of Statistics of China, “Macro-Economic of China from 2009-02 to 2010-05,” May lysis,” European 33 33 123 0 cc cc sptdspt WsptWsptW Rem e fo 1) The strength of coincident index (supporting moni- toring signal) is 0.375, whichs of ndition attributes. 2) The strength of leading index (supporting monitor- ing signal) is 0.313, w incident index and more than the strength of lagging index. 3) The strength of lagging index (supporting monitor- ing signondi- n attributes. 6. Postscript In the end of this pa sample of 13 months for macro-economic climate i China. The validity of the research conclusion and associated discussions is limited by the relatively small sample size. However, as stated earlier, results of this investigation will be helpful for Chinese government to make active macro-economic policy and to maintain the steady and relatively fast development of Chinese eco- nomic. 2) The investigation in this paper is based on partitions of the fi ese partitions we are not able to solve neighboring question in numerical representations for some condition attributes. For example, leading index 98.86 is cooling and leading index 99.09 is stable in this paper. In recent years, the rough-set theory has been developed from par- titions of the universe of discourse to covers of the uni- verse of discourse [14,15], which may provide a satis- factory solution for this neighboring question. Further exploratory might be performed towards this direction. 7. References [1] National Burea Climate Index 2010. http://www.stats.gov.cn/english/ [2] G. Alvatore, M. Bentto and S. Roman, “Rough Set The- ory for Multi Criteria Decision Ana Journal of Operational Research, Vol. 129, No. 1, 2001, pp. 1-47. doi:10.1016/S0377-2217(00)00167-3 [3] C. Donna, “Artificial Interagency Research in Japan,” Artificial Intelligence, Vol. 91, No. 1, 1997, pp. 122-129. [4] A. Erbert, “Scientific Discovery and Simplicity of Method,” Artificial Intelligence, Vol. 91, No. 2, 1997, pp. 177-181. doi:10.1016/S0004-3702(97)00019-2 [5] X. Ge and J. Qian, “Some Investigations on Higher Mathematics Scores for Chinese University Students,” al of Com- n Sciences, Vol. 11, No. 5, 1982, pp. International Journal of Computer and Information En- gineering, Vol. 3, No. 4, 2009, pp. 209-212. [6] X. Ge, J. Li and Y. Ge, “Some Separations in Covering Approximation Spaces,” International Journ putational and Mathematical Sciences, Vol. 4, No. 3, 2010, pp. 156-160. [7] Z. Pawlak, “Rough Sets,” International Journal of Com- puter and Informatio 341-356. doi:10.1007/BF01001956 [8] Z. Pawlak, “Rough Sets: Theoretical Aspects of Reason- ing about Data,” Kluwer Academic Publishers, Norwell, . 11, 1995, pp. 89-95. doi:10.1145/219717.219791 1991. [9] Z. Pawlak, “Rough Sets,” Communications of ACM, Vol. 38, No [10] Z. Pawlak, “Vagueness and Uncertainty: A Rough Set Perspective,” Computational Intelligence, Vol. 11, No. 2, 1995, pp. 227-232. doi:10.1111/j.1467-8640.1995.tb00029.x [11] S. Padmini and H. D formation Retrieval:Rough Sets and Fuzz onald, “Vocabulary Mining for In- y Sets,” Infor- icial Intelligence, Vol. 4481, 2007, views and a Response,” Artificial Intelligence, mation Processing and Management, Vol. 37, No. 1, 2002, pp. 15-38. [12] K. Qin, Y. Gao and Z. Pei, “On Covering Rough Sets,” Lecture Notes in Artif pp. 34-41. [13] M. Stiefki and S. Smoliar, “What Computers Still Can’T Do: Five Re Copyright © 2011 SciRes. ME  M. HE ET AL. Copyright © 2011 SciRes. ME 426 Vol. 80, No. 1, 1996, pp. 95-97. doi:10.1016/0004-3702(95)00082-8 [14] M. Yahia, R. Mahmodr and N. Sulaimann, “Rough Neu- ral Expert Systems,” Expert System with Applications, Vol. 18, No. 2, 2002, pp. 87-99. doi:10.1016/S0957-4174(99)00055-X [15] W. Zhang, W. Wu, J. Liang and D. Li, “Rough-Set The- u and F. Wang, “On Three Types of Covering ory and Its Method,” Chinese Science Press, Beijing, 2002. [16] W. Zh Rough Sets,” IEEE Transactions on Knowledge and Data Engineering, Vol. 19, No. 8, 2007, pp. 1131-1144. doi:10.1109/TKDE.2007.1044
|