Technology and Investment
Vol.3 No.2(2012), Article ID:19393,8 pages DOI:10.4236/ti.2012.32013
Foreign Direct Investment and Trade: Complements or Substitutes? Empirical Evidence for the European Union
1Department of Economics, University of Cantabria, Santander, Spain
2Department of Economics and Business, Colin Powell Center for policy Studies, City College of New York, New York, USA
Email: mbengoa@ccny.cuny.edu, {martinezv, sanchezb}@unican.es
Received March 19, 2012; revised April 19, 2012; accepted April 26, 2012
Keywords: International Trade; FDI; Gravity Model; Hausman-Taylor Estimation; European Union
ABSTRACT
International Trade and Foreign Direct Investment (FDI) have grown at fast paces during the last decades. At this point, however, it is not clear whether trade and investment are regarded by firms as complementary ways of accessing other markets, or, instead, if they are employed as alternative strategies. This paper examines this issue empirically, for the particular case of Europe, an area in which commercial and economic integration has gained remarkable momentum since 1992. More specifically, it tests whether the reduction of trade barriers over time among the members of the European Union (EU) has increased not only trade flows but also FDI within those countries. A gravity model is estimated using the Hausman-Taylor estimation technique—to circumvent time invariability and endogeneity—for intra Europe FDI and, separately, for FDI to the EU members with origin in third countries. In addition to trade integration measures, this paper also analyzes the potential role of other traditional determinants of FDI, as the market size of the host country and the cost differential among home-host economies. The results suggest that EU commercial integration and FDI reinforce each other, thus being complements rather than substitutes in Europe. This effect is apparent for the intra-EU FDI and also for investment coming from countries outside the EU. Cost differentials are not as relevant as the possibility of gaining market share which leads us to conclude that in the EU the FDI pattern follows a horizontal strategy rather than a FDI vertical model.
1. Introduction and Background
During the second half of the XXth century and the first decade of the XXIst the world economy has been immersed in an accelerated process of internationalization and globalization. The increasing competition and rivalry in markets have changed the pattern of goods production and distribution, intensifying international linkages and deepening economic inter-dependence among areas. In this scenario, commercial transactions and foreign investments have gained significant momentum. Global trade, which amounted to 27% of world GDP in 1970, was more than 55% in 2010. The evolution of FDI is even more impressive: the ratio FDI/GDP was 6 times higher in 2010 (30.5%) than in 1980 (5.5%).
On a priori grounds, it is not straightforward to state whether FDI and trade have been considered by firms as complementary or alternative ways of serving foreign markets. Empirical evidence in this regard is ambiguous: while a number of studies suggest a relationship of complementarity between trade and FDI at the aggregate level, other studies, usually working at a more disaggregated level, are inconclusive. [1] and [2] report a positive relationship between international trade and FDI; they justify this effect by the fact that FDI and trade share common determinants. [3,4] find a causal relationship from FDI to exports for Mexico and Latin America, respectively. [5,6] suggest a complementarity relationship between trade and FDI in the European Union and Central-Eastern European Countries (CEECs). Neary [7] finds evidence in favour of the export-platform FDI hypothesis, whereby firms locate plants in one nation as a way of covering a larger area. [8] analyses American outward FDI to Latin American countries and find different results for alternative host countries and industries. [9] and [10] report a substitution relationship between exports and FDI for the United States and Japan in the automotive, automotive spare parts and electronic sectors. [11] analyses the service sector; they find a relationship of complementarity at the aggregate level but a substitution effect for transport and construction services.
There are still questions that are relevant for policymakers and remain unsolved by the empirical literature. Commercial integration—as characterized by the reduction of tariff (TBs) and nontariff barriers (NTBs)—has often been captured in the empirical literature by using dummy variables which represent the existence of Bilateral Trade Agreements (BTAs) or Regional Integration Agreements (RIAs) [2,5,6,12, among others]. The intraEuropean trade openness rate is proposed to measure commercial integration in order to address the connexion between trade and FDI in the context of a highly integrated area, such as the EU.
The remainder of the paper is organized as follows. Section 2 describes the methodological framework. Section 3 presents the data. Section 4 discusses the estimation results. Finally, Section 5 concludes the paper.
2. Methodology
The gravity equation has been widely and successfully used to explain bilateral trade flows. In its simplest form, the gravity equation states that the volume of trade between any two countries is positively correlated with the economic size of these countries and negatively correlated with the geographic distance between them [13]. Although initially the gravity equation lacked theoretical foundation, [14,15] developed a theory to justify the gravity model by using a differentiated product framework and increasing returns to scale. [16] found evidence in favour of the gravity equation from a Dixit-Stiglitz monopolistic competition model. Even the HeckscherOhlin international trade model admits easily interpretations that can be applied to the gravity equation [17].
In the last fifteen years, gravity equation has been applied to the empirical analysis of FDI as well [1,5,6,18- 20, among others]. In fact, the gravity model has proved to be empirically successful in explaining sales of foreign affiliates of multinational firms and recently it has been provided with a theoretical foundation [21].
Let consider three different econometric specifications for the determinants of FDI, based, respectively, on [19, MM hereafter], [20, BNU hereafter] and [21, KT hereafter]. MM and BNU models represent the new approach to FDI models, that allow for the existence of horizontal and vertical motivations, although, what is more important, these models integrate both horizontal and vertical FDI to come up with a new hybrid model named knowledge-capital. KT paper provides the theoretical underpinnings of the gravity equation applied to the analysis of multinational production determinants. Precisely, they derive the gravity equation form three different models of multinational firms. The first one based on the monopolistic competition model proposed by [1]. The second one close to the monopolistic competition framework of [22], and finally, they also derive the gravity equation from a version of a two-country factor-proportions model of fragmentation based on [23]. A variable to capture commercial integration has been introduced in these equations in order to test the European trade integration-FDI nexus. The empirical equations to be estimated are as follows:
Based on [19, MM]:
 (1)
(1)
Based on [20, BNU]:
 (2)
(2)
Based on [21, KT]:
 (3)
(3)
where FDIijt are the bilateral investment flows from country i to country j in year t. Opent is a measure of the European commercial integration (the home and host country’s European trade openness rate and, separately, its weighted average have been considered for this purpose). Yi and Yj are the Gross Domestic Products (GDPs) of the home and host countries, respectively. Dij stands for bilateral distance. Sizeijt captures the economic size of the home country relative to the host country.  captures the possible non-linearity of Sizeijt.
The factor endowment is measured using different definitions in each of the models. In MM DifSkijt is defined as the difference in the relative skilled labour endowments between country i and j. BNU define Skijt as the share of skilled labour endowment of the home country in total skilled labour endowments of home and host countries, and the unskilled labour endowment of the home country relative, again, to the sum of home and host country unskilled labour endowment. BNU and KT models define the labour shares—Skijt and RFEij—respectively, as the share of home country skilled labour in total skilled labour of both, home and host, countries and the share of home’s unskilled labour.
TCit, TCjt and CPIjt are control variables intended to capture the market protection of the home and host countries and the investment costs in the host country. Finally, μijt is the standard classical error term.
3. Sample and Data
Two different samples have been used in order to test the hypothesis that intra-European commercial integration may affect FDI in different ways depending on whether it comes from other European country—i.e. foreign investments which have their origin and destination in an EU country—or from a country outside the EU and therefore, not immersed in the European integration process.
The EU sample is conformed using data on bilateral FDI between each of the EU-191 countries (Belgium and Luxembourg are considered jointly) over 12 years (1995- 2006) leading to 3888 potential observations. The outerEuropean sample includes Korea, Japan, Norway, Switzerland and the United States as home countries2 (investors) and the EU-19 as host countries (recipients) over the period 1995-2006 (1080 potential observations)3.
The dependent variable for the three models presented in the previous section is the bilateral outward FDI stock among countries i and j until date t. It is expressed in real terms and 2005 US dollars published by the OECD Statistical Office and UNCTAD. GDPs (in real terms and 2005 US dollars) and bilateral distances come from the OECD’s National Account Databases and the Centre d’Etudes Prospectives et d’Informations Internationals (CEPII), respectively.
Factor endowment variables are constructed using data on skilled and unskilled labour, obtained from the International Labour Office (ILO) and grouped according to the International Standard Classification of Occupations (ISCO-88). Following [19], the skilled-labour endowment is measured as the sum of workers in categories 1 (legislators, senior officials and managers), 2 (professionals) and 3 (technicians and associate professionals) from ISCO-88.
TCit and TCjt are control variables intended to capture the market protection of the home and host countries. They are computed as the inverse of the trade freedom index from The Heritage Foundation. CPIjt stands for the inverse of the Corruption Perception Index reported by Transparency International. It is used as a proxy of the investment costs in the host country.
Two alternative measures have been used to capture the European commercial integration. The first one is the degree of trade openness of the host countries with the rest of Europe. This variable is calculated, for each country j, as the sum of exports from country j to the EU-19 countries plus the sum of imports from the EU-19 countries to country j, divided by GDP of country j. In other words, we are considering the level of integration of the host country with the rest of Europe (this variable is also constructed for the home country i). The second alternative measure is the average degree of intra-European trade openness4, computed as the weighted average5 of the European trade openness of the host countries mentioned before6. Data on bilateral trade are available from the STAN databases published by the OECD.
4. Empirical Results
The trade-FDI nexus is estimated by using the HausmanTaylor technique (HT). This procedure has, in our opinion, several advantages. First, the HT model provides parameter estimates of time-invariant variables such as distance. The fixed effects model, although consistent, does not supply such estimates. Furthermore, and in contrast to the traditional random effects model, the HT model eliminates the bias in parameter estimates stemming from endogenous unobserved effects. Finally, it is more efficient than the fixed effects estimator. Therefore, HT estimation technique for panel data gives an adequate framework to study the relationship between commercial integration and FDI and circumvent the possible endogeneity of variables and the fact of adding time-invariable determinants.
This section distinguishes two different scenarios. In the first one, an analysis of the relationship between European commercial integration and intra-European FDI is carried on. In the second, the approach is different; and it only includes FDI from economies that do not belong to the EU assuming that the FDI and the commercial integration relationship could be different and also driven by other factors when focusing on third countries out of the integration zone. Table 1 presents the outcomes for the intra-European FDI sample while Table 2" target="_self"> Table 2 reports the results for the second sample.
In general, regarding the impact of commercial integration on FDI, estimates reveal a positive and highly significant effect, both for the intra-EU and the FDI from third countries, and for total and non-services FDI alike. In other words, results suggest a relationship of complementarity between trade and foreign investment, in line with previous studies [1,2,6,12,18]. The point estimates of the integration effects, as conveyed by Table 2, reinforce the export-platform FDI hypothesis [7,25-27]. Put
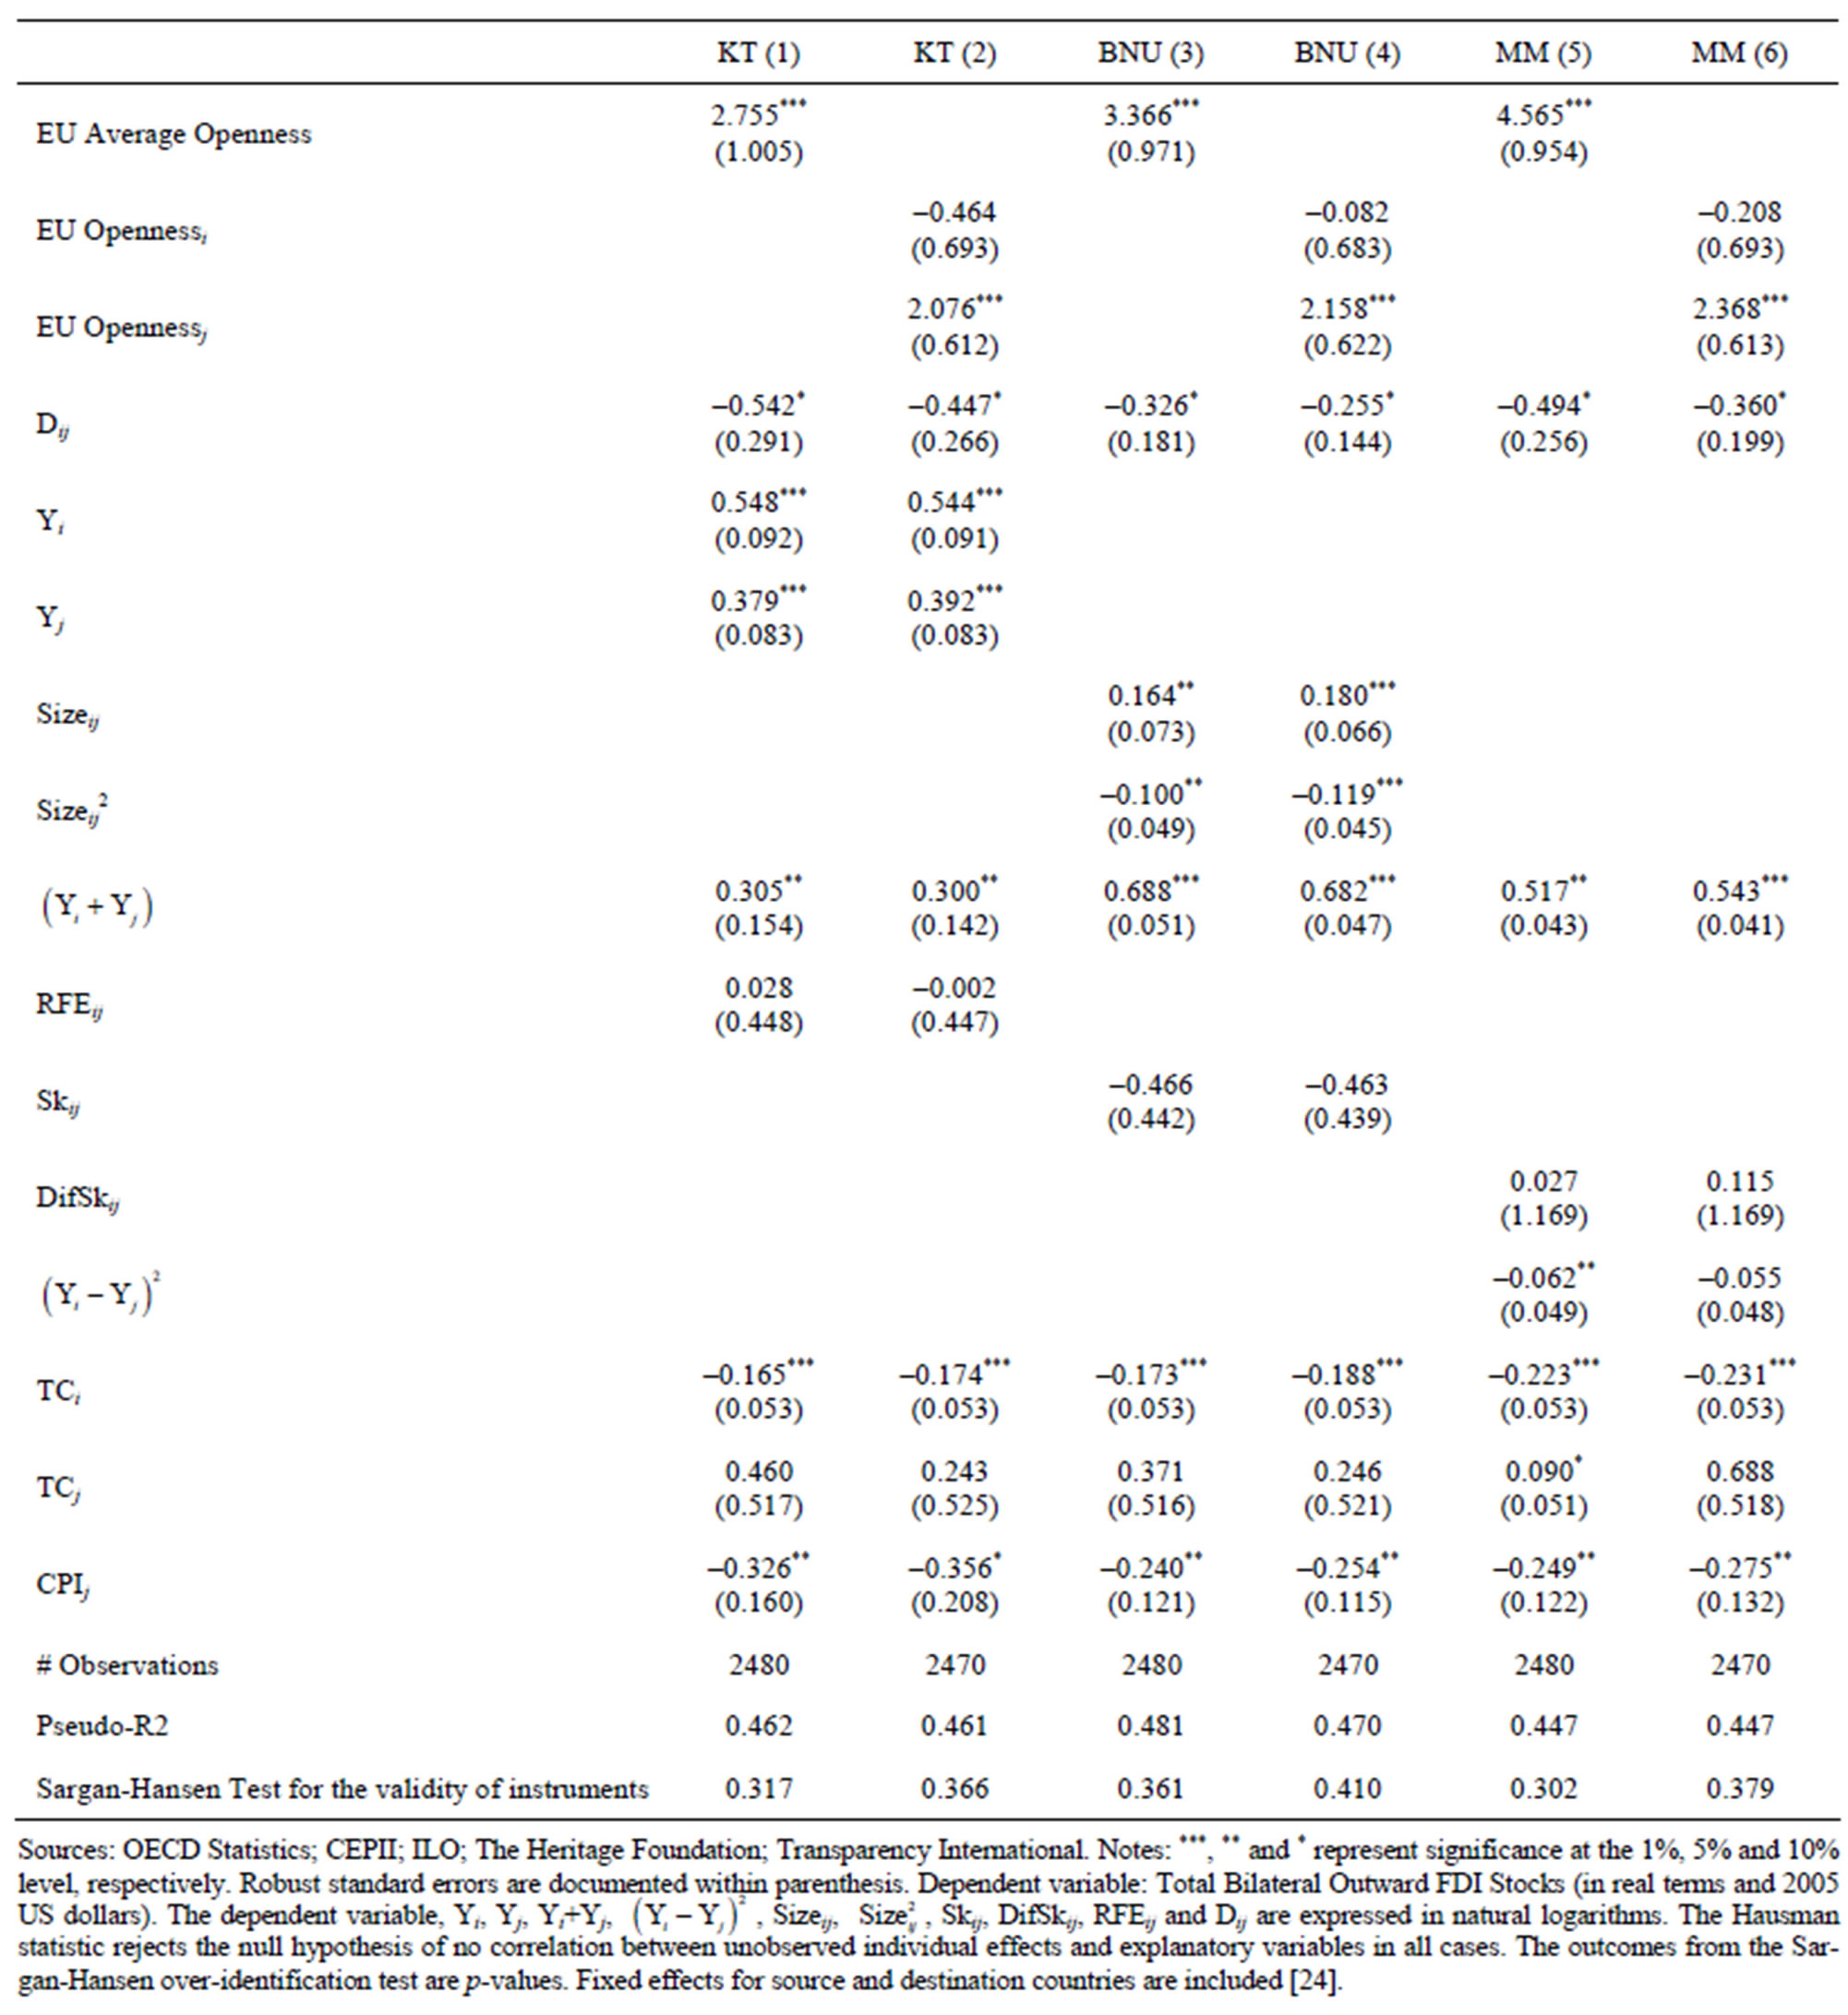
Table 1. Commercial integration and intra-European FDI.
differently, commercial integration of an area increasesits appeal for foreign firms intending to serve the area.
Focused on the intra-European sample, Table 1 shows a positive correlation between commercial integration and FDI. The more commercially integrated is the European Union, measured by the average openness rate, the more appealing is to invest in Europe for other members of the Union. However, when the openness rate of home and host countries are taken into account results differ. The European openness rate of the home country, although not significant, exhibits a negative sign. On the other hand, European openness rate of the host country is consistently positive and highly significant. This is; the more commercially integrated are the recipient countries, the more FDI flows to them.
Distance represents an obstacle not only to trade but

Table 2. European commercial integration and FDI from abroad.
also to foreign direct investment. Although point estimates are negative in both tables and for all the models considered, they are only marginally significant (at the 10 percent significance level, except in columns 9 and 12 in Table 1).
Economic sizes of the home and host countries, as captured by GDP, have a positive effect on bilateral FDI. This result is well documented by the economic literature [28-32, among others]. As reported by these contributions, one of the main drivers of horizontal FDI is the search of large markets, in which scale economies may be present. In this regard, a bigger host market, a larger global market (as proxied by the sum of the home and host GDPs) and similar characteristics of host and home markets (as captures by the negative sign of  and
and  variables) are supposed to be positively correlated with FDI.
Variables measuring factor endowments capture potential vertical motivations of FDI. According to the economic literature, vertical firms separate the different stages of the production process over countries depending on factor intensities, placing phases intensive on skilled-labour in places where this input is relatively abundant. Results in this respect, however, suggest two different situations. For the intra-European FDI variables capturing relative factor endowments (RFEij, Skij and DifSkij, respectively) are not statistically significant, and they are even negative in some instances (Table 1; columns 2, 3 and 4).
Finally, the cost of investing in a particular country, proxied by the Corruption Perception Index of the host country, has a negative and statistically significant influence on bilateral FDI, in all the models presented in Table 1. Meanwhile, control variables relative to market protection show different signs and significance. Market protection in the home country has a negative influence in intra-European bilateral FDI, consistent with the fact that some of this FDI may return back to the home country via imports. Host country market protection shows a positive sign although not significant [19].
When it comes to analyse the FDI coming from outside the EU, the picture is very similar to that representing intra-European investments. As well as in Table 1, Table 2 exhibits a positive relationship between commercial integration and FDI. This is, a more commercially integrated EU is associated with larger investments from external countries; and again, once the openness rate of home and host countries are considered separately, different trails appear. European openness rate of the host country is constantly positive and significant at the 1% level in all estimations. According to the point estimates relative to the European trade openness rate of the investor country, they exhibit negative signs but they are not significant, as well as for the internal FDI sample.
Distance is an impediment for FDI. Countries far away from Europe tend to invest less in the EU-19. In this case, figures are larger and more statistically significant than those in the intra-European FDI instance.
Horizontal motivations, captured by the economic size of the investment partners, are clearly presented in the data. GDPs of home and host countries exhibit positive figures and are significant at the 1% level at the same time as the global market size (in columns 1 and 2 of Table 2 it is only marginally significant—10%). In the BNU models, however, this relation is not as obvious, Sizeij is only significant in column 3, while its quadratic term appears not significantly different from zero.
As regard to the potential vertical motivations behind the FDI process, measured by the relative factor endowment variables, empirical evidence does not support their presence for the sample considered. Figures do not show consistency or statistically significance.
Point estimates relative to the trade freedom control variables present the opposite signs to the ones shown in Table 1. In the case of the FDI from outside the EU, more protection in the home country is related to more outward investments while less protection in the recipient country attracts more FDI. This result is well documented in the economic literature [29,33-35]. Finally, the cost of investing in a particular country has a negative and statistically significant influence on bilateral FDI.
5. Conclusions
The empirical analysis discussed here states that commercial integration and FDI to the European Union during 1995-2006 exhibit a positive correlation, thus displaying a relationship of complementarity.
The results also point out that cost differentials, for the country sample considered, are not as relevant as the possibility of gaining market share, which in turn implies that incoming FDI to the EU follows a horizontal strategy rather than a vertical model. Further research from here should cover two main issues. First, alternative variables to relative factor endowments could be used to capture cost differentials. Second, the role of cost differentials on foreign investments in manufacturing should be analyzed in more detail, since the important share of FDI in services on total FDI may be driving the main results relative to the FDI horizontal pattern suggested from the analysis.
Our findings support the idea that policies targeted to promote further consolidations of the European Single Market—removing informal trade barriers, promoting liberalization and reducing bureaucracy, may have positive effects, not only regarding the commercial performance of the EU but also helping to attract FDI to the area, and indirectly, stimulating economic growth.
REFERENCES
- S. L. Brainard, “An Empirical Assessment of the Proximity Concentration Trade-off between Multinationals Sales and Trade,” American Economic Review, Vol. 87, No. 4, 1997, pp. 520-544.
- F. Di Mauro, “The Impact of Economic Integration on FDI and Exports: A Gravity Approach,” Centre for European Policy Studies, Brussels, 2000.
- M. Alguacil, A. Cuadros and V. Orts, “Foreign Direct Investment, Exports and Domestic Performance in Mexico: A Causality Analysis,” Economic Letters, Vol. 77, No. 3, 2002, pp. 371-376. doi:10.1016/S0165-1765(02)00150-7
- A. Cuadros, V. Orts and M. Alaguacil, “Openness and Growth: Re-Examining Foreign Direct Investment, Trade and Output Linkages in Latin America,” The Journal of Development Studies, Vol. 40, No. 4, 2004, pp. 1-34.
- P. Brenton, F. Di Mauro and M. Lucke, “Economic Integration and FDI: An Empirical Analysis of Foreign Direct Investment in the EU and in Central and Eastern Europe,” Empirica, Vol. 26, No. 2, 1999, pp. 95-121. doi:10.1023/A:1007006429600
- P. Egger and M. Pfaffermayr, “Foreign Direct Investment and European Integration in the 1990s,” The World Economy, Vol. 27, No. 1, 2004, pp. 99-110. doi:10.1111/j.1467-9701.2004.00590.x
- J. P. Neary, “Trade Costs and Foreign Direct Investment,” International Review of Economics and Finance, Vol. 18, No. 2, 2009, pp. 207-218. doi:10.1016/j.iref.2008.06.004
- L. S. Goldberg and M. Klein, “International Trade and Factor Mobility: An Empirical Investigation,” NBER Working Paper, 1999.
- B. A. Blonigen, “In Search of Substitution between Foreign Production and Exports,” Journal of International Economics, Vol. 53, No. 1, 2001, pp. 81-104. doi:10.1016/S0022-1996(00)00066-0
- K. Head and J. Ries, “Increasing Returns versus National Product Differentiation as an Explanation for the Pattern of U.S.-Canada Trade,” American Economic Review, Vol. 91, No. 4, 2001, pp. 858-876. doi:10.1257/aer.91.4.858
- C. Fillat-Castejón, J. F. Francois and J. M. Wörz, “Cross- Border Trade and FDI in Services,” CEPR Discussion Paper, 2008.
- P. Egger and M. Pfaffermayr, “Distance, Trade and FDI: A Hausman-Taylor SUR Approach,” Journal of Applied Econometrics, Vol. 19, No. 2, 2004, pp. 227-246. doi:10.1002/jae.721
- J. Tinbergen, “Shaping the World Economy: Suggestions for an International Economic Policy,” Twentieth Century Fund, New York, 1962.
- J. E. Anderson, “A Theoretical Foundation for the Gravity Equation,” American Economic Review, Vol. 69, No. 1, 1979, pp. 106-116.
- E. Helpman and P. R. Krugman, “Market Structure and Foreign Trade,” MIT Press, Cambridge, 1985.
- J. H. Bergstrand, “The Gravity Equation in International Trade: Some Microeconomic Foundations and Empirical Evidence,” Review of Economics and Statistics, Vol. 67, No. 3, 1985, pp. 474-481. doi:10.2307/1925976
- A. V. Deardorff, “Determinants of Bilateral Trade: Does Gravity Work in a Neoclassical World?” NBER Working Paper, 1995.
- P. Brenton, “The Impact of the Single Market on Foreign Direct Investment in the EU,” Report for DGII, 1996.
- J. R. Markusen and K. E. Maskus, “Discriminating among Alternative Theories of the Multinational Enterprise,” Review of International Economics, Vol. 10, No. 4, 2002, pp. 694-707. doi:10.1111/1467-9396.00359
- H. Braconier, P. J. Norbäck and D. Urban, “Reconciling the Evidence on the Knowledge-Capital Model,” Review of International Economics, Vol. 13, No. 4, 2005, pp. 770-786. doi:10.1111/j.1467-9396.2005.00536.x
- J. Kleinert and F. Toubal, “Gravity for FDI,” Review of International Economics, Vol. 18, No. 1, 2010, pp. 1-13. doi:10.1111/j.1467-9396.2009.00869.x
- E. Helpman, M. J. Melitz and S. R. Yeaple, “Export versus FDI with Heterogeneous Firms,” American Economic Review, Vol. 94, No. 1, 2004, pp. 300-316. doi:10.1257/000282804322970814
- A. J. Venables, “Fragmentation and Multinational Production,” European Economic Review, Vol. 43, No. 4-6, 1999, pp. 935-945. doi:10.1016/S0014-2921(98)00106-8
- R. C. Feenstra, “Border Effects and the Gravity Equation: Consistent Methods for Estimation,” Scottish Journal of Political Economy, Vol. 49, No. 5, 2002, pp. 491-506. doi:10.1111/1467-9485.00244
- J. P. Neary, “Foreign Direct Investment and the Single Market,” The Manchester School, Vol. 70, No. 3, 2002, pp. 291-314. doi:10.1111/1467-9957.00304
- K. Ekholm, R. Forslid and J. R. Makusen, “Export-Platform Foreign Direct Investment,” NBER Working Paper, 2003.
- J. H. Bergstrand and P. Egger, “Trade Costs and Intra Industry Trade,” Review of World Economics, Vol. 142, No. 3, 2006, pp. 433-458. doi:10.1007/s10290-006-0075-7
- R. Nelson and E. Phelps, “Investment in Humans, Technological Diffusion, and Economic Growth,” American Economic Review: Papers and Proceedings, Vol. 56, No. 2, 1966, pp. 69-75.
- V. N. Balasubramanyam, M. Salisu and D. Sapsford, “Foreign Direct Investment and Growth in EP and IS Countries,” The Economic Journal, Vol. 106, No. 434, 1996, pp. 92-105. doi:10.2307/2234933
- E. Borensztein, J. De Gregorio and J. W. Lee, “How Does Foreign Direct Investment Affect Economic Growth?” Journal of International Economics, Vol. 45, No. 1, 1998, pp. 115-135. doi:10.1016/S0022-1996(97)00033-0
- L. R. De Mello, “Foreign Direct Investment-Led Growth: Evidence form Time Series and Panel Data,” Oxford Economic Papers, Vol. 51, No. 1, 1999, pp. 133-151. doi:10.1093/oep/51.1.133
- M. Bengoa and B. Sánchez-Robles, “Foreign Direct Investment, Economic Freedom and Growth: New Evidence for Latin America,” European Journal of Political Economy, Vol. 19, No. 3, 2003, pp. 529-545. doi:10.1016/S0176-2680(03)00011-9
- V. N. Balasubramanyam, D. Sapsford and D. Griffiths, “Regional Integration Agreements and Foreign Direct Investments: Theory and Preliminary Evidence,” The Manchester School, Vol. 70, No. 3, 2002, pp. 460-482. doi:10.1111/1467-9957.00311
- R. E. Caves, “Multinational Firms and Economic Analysis,” Cambridge University Press, Cambridge, 1996.
- H. Singh and K. Jun, “Some New Evidence on Determinants of Foreign Direct Investment in Developing Countries,” World Bank Policy Research Working Paper, 1995.
Appendix

Figure A1. Outward FDI stocks to the European Union.

Figure A2. Intra-European trade openness rate (weighted average for the EU-19).
NOTES
1EU-19 is formed by the EU-15 countries (Austria, Belgium, Denmark, Finland, France, Germany, Greece, Ireland, Italy, Netherlands, Luxembourg, Portugal, Spain, Sweden and the United Kingdom) plus the 4 frontrunners from Central Europe (Czech Republic, Hungary, Poland and Slovakia).
2It would have been interesting to include China (and/or Hong-Kong) but the lack of available data did not make it possible. These five countries account for about 42% of world FDI positions. Countries considered represent the main investors from abroad in the EU; between 15% (Korea) and 55% (Norway) of their investments are established in the EU-19 group.
3See Figure A1 in the Appendix for an evolution of FDI stocks in the EU-19.
4An evolution of the average intra-European trade openness rate is presented in Figure A2 in the Appendix. Until 2002 intra-EU trade openness exhibits a decline due to the slower growth of exports and imports relative to GDP growth. From then, intra-European trade expands at a faster pace and, as a result, trade openness rate increases notably. In 2009 intra-European trade experienced a sharp decline due to the economic crisis.
5Relative economic size is used as weight .
.
6See note 1.