Journal of Water Resource and Protection
Vol.5 No.2(2013), Article ID:27686,7 pages DOI:10.4236/jwarp.2013.52018
Gas Blowout Impacts on Ground Water Environs around the Tengratila Gas Field, Chattak, Bangladesh
1Department of Petroleum and Mining Engineering, Shahjalal University of Science and Technology, Sylhet, Bangladesh
2Department of Civil and Environmental Engineering, Shahjalal University of Science and Technology, Sylhet, Bangladesh
3Department of Geology and Mining, University of Rajshahi, Rajshahi, Bangladesh
4Department of Geology, University of Dhaka, Dhaka, Bangladesh
Email: *farhadpme@gmail.com
Received September 10, 2012; revised November 7, 2012; accepted December 13, 2012
Keywords: Tengratila Gas Field; Gas Blowout; Water Quality; Blow out Impact
ABSTRACT
Gas blowout is one of the major hazard in petroleum field which normally damages the gas bearing geologic formation, structure, local tectonic setting, environment and so on. In Bangladesh, there have been three well known gas blowouts. Among them, the most dangerous gas well blowout took place on 8 January 2005 in Sunamganj district when chattak-2 (also known as Tengratila) gas field was drilled. As a result, the surrounding area is facing various problems among them water is the top of the list. From this point of view, the present study has been considered to find the impact of blowout on water around the gas blowout area. In this regard, the water samples (some are very near and some are away from the well) are collected and analyzed in the laboratory following the standard method. Some physical and chemical parameters of water such as pH, turbidity, EC, total solids, dissolved solids, suspended solids, manganese ion, calcium ion, magnesium, iron, chloride and total hardness have measured where without turbidity, manganese and iron, all are still in tolerable state for all purposes and ranging within standard limit based on WHO, EU and EQS for Bangladesh. The quality of the near well tube wells water is much decreased than far away tube wells water which might be the direct or indirect influence of the blowout incident around the area.
1. Introduction
A “blow out” is simply the blowing up and destructing the drilling rig and associated installations due to sudden, violent and uncontrolled flow of fluids i.e. water, gas or oil from underneath to the surface. In most of the cases, such accident is accompanied by fire and lead to damage of properties and often loss of lives. Oil or gas zone or over pressured water bearing rock layer in the subsurface, if penetrated by drilling pipe, may causes forceful flow of fluid through the drilling pipe. In the case of Bangladesh, there are three distinct gas well blow out incident happened such as the Sylhet-1 gas blow out, the Moulvibazar-1(Magurchara) gas blow out and Chattak-2 (Tengratila) gas well blowout (Figure 1) [1]. These blow out incidients have a great impacts on both environment and economics. Two blowouts occurred in Tengratila where the rising flames were visible from 30 kilometers away from this gas field which thoroughly damaged the geologic structures and nearby surface areas and also still venting out the gas from fissures in the well side and nearby agricultural land.
Thus, this study is aimed at determining the effect of blow out on groundwater in Tengratila area and its vicinity through the laboratory analysis of different water parameters. Twelve functional tube wells samples located in Tengratila area were collected for quality checks by physicochemical analysis of the samples in the laboratory. The concentration of the physical and chemical parameters of water such as pH, turbidity, EC, total solids (TS), dissolved solids (DS), suspended solids (SS), manganese ion, calcium ion, magnesium, iron, chloride, total hardness (TH) were used to determine the water quality. The values of the physicochemical parameters were correlated with the World Health Organization (WHO), European Union (EU) and EQS for Bangladesh drinking water values.
2. Geology of the Study Area
The Chattak gas field located in Sumamganj district under Sylhet Trough (Figure 1). This is housed in structural traps i.e., folded anticline. The folded trap is in north-south direction.The pattern of the fold structure as well as its vertical and areal closures varies considerably.
The fold is affected by severial faults. Sesimic data indicate that the Sylhet Trough contain huage amount of elastic sediment.The stratigraphic succession of Sylhet Trough was initially established by lithostratigraphic correlation to type section in the Assam, north-easterm India. Sesmic data indicate that the Sylhet Trough of northeastern part of Bangladesh cotains about 17,950 m of Eocene to Holocene elastic sediments [2]. The sequence of the rocks encountered in the Sylhet Trough area is Eocene to Recent age where the Dupi Tila formation is the water bearing formation (Table 1). The Alluvium formation also contains some water.
3. Methodology
To determine the blowout impact on water, twelve samples from the study area are collected where six samples are from very near of the blowout area and rest samples are collected one or two kilometers away from the place of accident (Figure 1). During the time of sampling, the depth of tube wells, locations and time were recorded. The PHep@ pocket sized pH meter by HANNA Instru-

Figure 1. Location map of Tangratila (Chattak-2) gas field [1] and water sampling. Legend: S1-S12 means Sample 1 to Sample 12, respectively (Here, S1 - S6 are nearer and remainings are far away from the well).
Table 1. Stratigraphic succession of the Sylhet trough in the north-eastern part of Bangladesh [2].

ments was used to test pH. For Turbidity testing, Microprocessor Turbidity Meter HI 93703 by HANNA Instruments was used. Total solids (TS), dissolved solids (DS), suspended solids (SS), manganese ion (Mn2+), calcium ion (Ca2+), magnesium (Mg2+), iron (Fe2+), chloride (Cl−), total hardness were tested by Standard Methods developed by APHA, AWWA, WPCF (1998) [3,4]. All these tests were performed in Water Supply and Sewerage Engineering Laboratory, Department of Civil & Environmental Engineering, SUST, Sylhet. The results are presented in a tabular form (Table 2).
4. Results and Discussions
4.1. Evidences of Gas Blowout and State of Water Environment in the Area
The evidence of gas blowout and the current interruption of the state of water environment have been shown in Figure 2. From 2005 to 2007 about 426 positive and negative reports were published in two different newspapers about the present environmental condition around the area and also in some international newspapers. The articles specifically addressed the issues associated with the blow out impact as well as the Niko’s rehabilitations activities against it [5]. However many allegations have been made about contamination and interruption of groundwater caused by this blow out and particular impacts on water wells observed in the field while some of the shallow and dug wells are not producing water well. On the other hand gas still seeping through some wells and also in the pond water in the area. In a word, the total water environment greatly affected by this incident.
4.2. Blowout Impact on Physical Parameters of the Samples
Physical parameters define those characteristics of water that respond to the senses of sight, touch, taste or smell. The total solids, suspended solids, turbidity, pH, odor, color, taste and temperature in a water sample fall into this category [2].
4.2.1. PH, Conductivity and Turbidity
The pH of the near gas field water of the study area

Figure 2. The flow of poisonous water from tube wells and nearby hoarse after many days of the second blowout on June 24 [6].
Table 2. Physicochemical results from the study area compared with WHO, EU, EQS (BD) limits [7-9].

*Not mention; **Sample Near well tube wells (1 - 6) and far well tube wells (7 - 12).
ranges from 7.1 to 8.1 where the standard pH value for drinking water in Bangladesh is 6.5 - 8.5. The pH values of the far tube well water samples ranges from 7.5 to 7.8 (Figure 3). The acidity of the water depends on its value of PH where 7.0, Considered as base line [7-9].
The conductivity values in the area ranges from 70 μs/cm to 250 μs/cm at locations 5 and 12 respectively (Table 2). Conductivity values for all the samples are within acceptable limit based on WHO, EU and EQS for Bangladesh (Figure 4). Conductivity of the water can be related to the total dissolved solids concentration but the relationship may not be a constant [10].
Turbidity is a measure of extent to which light is either absorbed or scattered by suspended material in water. Turbidity of near well tube wells water in the study area ranges from 4.60 NTU to 6.71 NTU where the far well tube wells represent 4.61 NTU to 5.56 NTU. Turbidity of water of the study area has represented given away in Figure 5. The turbidity values recorded for most of the samples were above the WHO acceptable limit of 5.00 NTU [9].
4.2.2. Total Solids (TS), Dissolved Solids (DS), Suspended Solids (SS)
The values of total solids of water samples are within the range of 37.5 to 61 ppm where dissolved solids (DS) and suspended solids (SS) were 28.3 to 50.2 ppm and 2 to 15.5 ppm respectively. The water of near well tube wells show higher amount of solids than far tube wells. Data
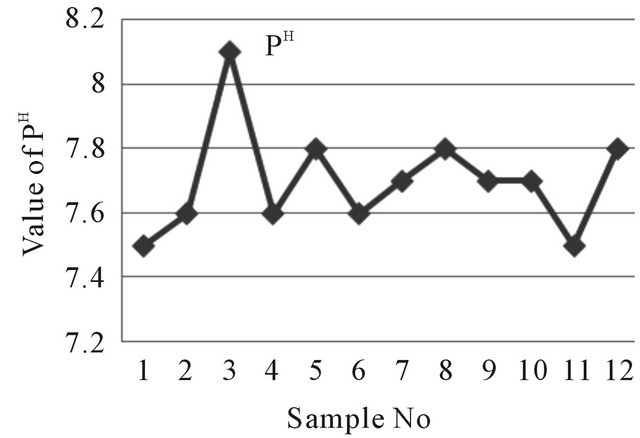
Figure 3. A two dimensional (2-D) line chart of pH variation.

Figure 4. A two dimensional (2-D) line chart of EC variation.

Figure 5. A two dimensional (2-D) line chart of turbidity variation.
obtained from examination all types of solids are within limit (WHO, EU and EQS for Bangladesh). Generally the electrical conductivity of water depends on the total solids of water. Dissolved solids comprise inorganic salts and some small amounts of organic materials that are dissolved in water. TDS originates from natural source, sewage, urban-runoff, industrial wastewater and the nature of the piping or hardware used to convey the water TDS test provides a qualitative measure of the amount of dissolved ions in water and could be used as an indicator test to determine the general quality of water [10]. The data obtained for dissolved solids of water are shown in Figure 6.
4.3. Blowout Impact on Chemical Parameters of the Samples
Chemical parameters define those characteristics of water that respond structure and components [8]. Iron (Fe2+), Manganese (Mn2+), Calcium (Ca2+), Magnesium (Mg2+), Total Hardness and Chloride (Cl−) in water samples fall into this category [2].
4.3.1. Iron (Fe2+)
The iron concentration in the near field tube wells of the study area ranges from 0.10 ppm to 1.95 ppm where the WHO given value is 0.3 ppm [9] and 0.3 to 1.0 ppm for EQS for drinking water in Bangladesh [7]. The meditation of iron in far tube wells water of the study area ranges from 0.15 ppm to 0.45 ppm. The iron concentration of water samples have been shown graphically in Figure 7.
4.3.2. Manganese (Mn2+)
The values of Manganese of water samples range from 0.010 to 0.135 ppm (near well tube wells 0.010 to 0.135 ppm and far well tube wells 0.018 to 0.037 ppm) and that of near well tube wells shows higher amount Manganese than the far tube wells (Figure 8). The standard value of Manganese (Mn2+) ion in water samples are 0.5 and 0.05 ppm based on WHO and EU, respectively [8,9].

Figure 6. A two dimensional (2-D) line chart of various solids deviation.
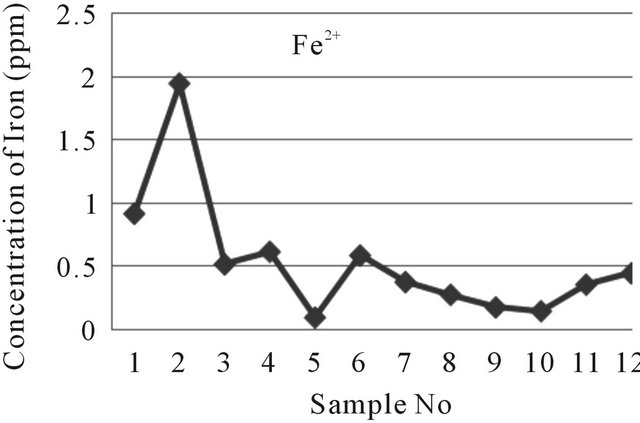
Figure 7. A two dimensional (2-D) line chart of Fe2+ concentration disparity.

Figure 8. A two dimensional (2-D) line chart of (Mn2+) deviation.
4.3.3. Calcium (Ca2+) & Magnesium (Mg2+)
The highest concentration of Calcium ion in water of the study area is 31.6 ppm and the lowest one is 18 ppm (near well tube wells) and for far well tube wells it is 29 ppm and 9.6 ppm. The magnesium concentration in water of the study area ranges from 2.6 ppm to 7.2 ppm. The water samples in near well tube wells contain more Ca2+ but less Mg2+ than far well tube wells water (Figure 9).
4.3.4. Total Hardness
The hardness of the samples has been calculated as CaCO3 in ppm (by convention). Hardness results from the presence of divalent metallic cations of which calcium and magnesium are most abundant. Total Hardness of near well tube wells water in the study area ranges from 55 ppm to 165 ppm where the far well tube wells represent from 75 ppm to 130 ppm where the WHO and EQS for Bangladesh drinking water given value are 50 - 500 ppm and 40 - 180 ppm correspondingly [7,9]. Total Hardness of water of the study area has been shown in Figure 10.
4.3.5. Chloride (Cl−)
The chloride concentration of near well tube wells water in the study area ranges from 8 ppm to 25 ppm (sample 5) but the chloride content of the far well tube wells water are below 20 ppm and average value around 12 ppm (Figure 11).
4.4. Future Problems and Recommendation
From the total analysis, it is clear that all of the water parameters are almost within the standard limit but some cases iron shows that higher concentration in near well

Figure 9. A two dimensional (2-D) line chart of Ca2+ & Mg2+ concentration inequality.
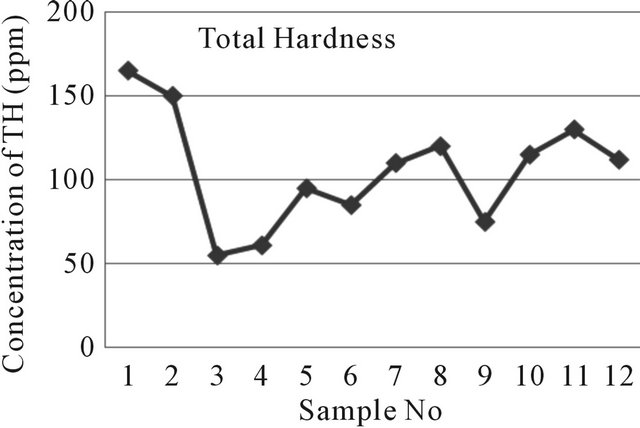
Figure 10. A two dimensional (2-D) line chart of total Hardness deviation.

Figure 11. A two dimensional (2-D) line chart of chloride variation.
tube wells. But we know that the small concentrations of iron are essential for human health because iron helps to transport oxygen in the blood. High concentrations of dissolved iron (> 0.3 ppm) can result in poor tasting, unattractive water that stains both plumbing fixtures and clothing [9,11]. When iron-rich waters mixed with tea, coffee, or alcoholic beverages, they assume a black, inky appearance with an unpleasant taste. The parameters also clog water systems, plug filters or envelop pump screens resulting in expensive repairs. This may causes a great effect on human being as well as fertility of agricultural land [12,13]. Unrestrained behavior of iron is also responsible for some skin diseases that may turned into cancer. Thus, this research recommends a detail research with mitigation action plan for water environment in the area.
5. Conclusion
From the study, it is observed that the values of water of the near well tube wells are slightly higher from standard limit consequently this contaminated water polluting the nearby surface land and creating problems on human and animals. The water quality of near well tube wells are deteriorating and will be deteriorated with time being while the gas still seeping from the reservoir to the surface and ground. In the present study, the pH value ranges between 6.5 to 8.5. Maximum amount of iron and manganese are in near well tube wells which amount are 1.95 ppm and 0.135 ppm, respectively. Maximum total solids, dissolved solids and suspended solids are found 61, 50.2 and 15.5 ppm respectively; where mmaximum turbidity is detected as 6.71 NTU at near well tube wells water. Other parameters are also higher in near well tube wells water. Thus from this result, it can be concluded that the impact of gas blow out is slightly noticeable in the case of near well water than the far well water and as a whole the impact of such incident on ground water environment is not so noticeable in the area at present. Moreover this research recommends a more detail research on the total water environment around the area.
6. Acknowledgements
The authors are grateful to Professor Dr. Mohammad Aktarul Islam Chowdhury, Head of the Department of Civil and Environmental Engineering, Shahjalal University of Science and Technology for giving us opportunity to work in the laboratory of Civil and Environmental Engineering department. The authors also thankful to anonymous reviewers for their critical comments which greatly help to improve the research.
REFERENCES
- B. Imam, “Energy Resources of Bangladesh,” University Grants Commission of Bangladesh, Dhaka, 2005, pp. 25- 33 & 142-146.
- K. Hiller and M. Elahi, “Structural Growth and Hydrocarbon Entrapment in the Surma Basin,” Cireum-Pacific Council for Energy and Mineral Resources Earth Science Series, Vol. 10, 1988, pp. 657-669.
- APHA, AWWA and WPCF, “Standard Methods for the Examination of Water and Wastewater,” 20th Edition, American Public Health Association, Washington DC, 1998.
- M. A. Aziz, “A Textbook of Water Supply Engineering,” Hafiz Book Centre, Dhaka.
- D. M. A. Islam and M. M. A. Islam, “Environmental Incident in a Developing Country and Corporate Environmental Disclosures: A Study of a Multinational Gas Company,” Deakin University, Burwood.
- The Daily Star, “Report on the Second Blowout Incident,” 2 June 2005
- Bangladesh Water Development Board, “Ground Water Qualities of Bangladesh,” 1978.
- EU, “Drinking Water Standards,” European Union, 2008.
- World Health Organization, “International Drinking Water Standards,” 3rd Edition, WHO, Geneva, 2007.
- M. U. Igboekwe, A. O. Akankpo and I. E. Udoinyang, “Hydrochemical Evaluation of Groundwater Quality in Michael Okpara University of Agriculture, Umudike and Its Environs, Southeastern Nigeria,” Journal of Water Resource and Protection, Vol. 3, No. 12, 2011, pp. 925- 929. doi:10.4236/jwarp.2011.312103
- H. S. Peavy, D. R. Rowe and G. Tchobanoglous, “Environmental Engineering,” McGraw Hill Inc., New York, 1985.
- A. Colter and R. L. Mahler, “Iron in Drinking Water,” PNW 589, University of Idaho Extension, the Oregon State University Extension Service and the US Department of Agriculture Cooperating, 1914.
- S. S. Dara, “A Textbook of Environmental Chemistry and Pollution,” S. Chand & Co. Ltd, New Delhi, 1995.
Full Meanings of Different Abbreviations in the Research
EC—Electric Conductivity;
TS—Total Solids;
DS—Dissolved Solids;
SS—Suspended Solids;
Mg2+—Manganese ion;
Mn2+—Manganese ion;
Ca2+—Calcium ion;
Fe2+—Iron ion;
Cl−—Chloride ion;
Mg—Magnesium;
WHO—World Health Organizations;
EU—European Union;
EQS—Environmental Quality Standard;
APHA—American Public Health Association;
AWWA—American Water Works Association;
WPCF—Water Pollution Control Federation;
SUST—Shahjalal University of Science and Technology;
TH—Total Hardness;
ppm—Parts per Million;
NTU—Nephelometric Turbidity Unit;
BD—Bangladesh;
TDS—Total Dissolved Solids;
i.e.—That is;
m—Meter;
S1—Sample 1;
CaCO3—Calcium Carbonate.
NOTES
*Corresponding author.