Journal of Water Resource and Protection
Vol.1 No.2(2009), Article ID:614,12 pages DOI:10.4236/jwarp.2009.12015
Water Quality Analysis of the Songhua River Basin Using Multivariate Techniques
1State Key Laboratory of Water Environment Simulation, School of environment, Beijing Normal University, Beijing, China
2College of resources science & technology, Beijing Normal University, Beijing, China
E-mail: xly@bnu.edu.cn
Received November 29, 2008; revised January 13, 2009; accepted February 14, 2009
Keywords: Water Quality, Multivariate Statistical Analysis, the Songhua River Basin, the North-Eastern Region Of China
ABSTRACT
Multivariate statistical techniques, including cluster analysis (CA), principal component analysis (PCA), factor analysis (FA) and discriminant analysis (DA), were used to evaluate temporal and spatial variations and to interpret a large and complex water quality data sets collected from the Songhua River Basin. The data sets, which contained 14 parameters, were generated during the 7-year (1998-2004) monitoring program at 14 different sites along the rivers. Three significant sampling locations (less polluted sites, moderately polluted sites and highly polluted sites) were detected by CA method, and five latent factors (organic, inorganic, petrochemical, physiochemical, and heavy metals) were identified by PCA and FA methods. The results of DA showed only five parameters (temperature, pH, dissolved oxygen, ammonia nitrogen, and nitrate nitrogen) and eight parameters (temperature, pH, dissolved oxygen, biochemical oxygen demand, ammonia nitrogen, nitrate nitrogen, volatile phenols and total arsenic) were necessarily in temporal and spatial variations analysis, respectively. Furthermore, this study revealed the major causes of water quality deterioration were related to inflow of effluent from domestic and industrial wastewater disposal.
1. Introduction
Rivers are among the most vulnerable water bodies to pollution because of their role in carrying municipal and industrial wastes and run-offs from agricultural lands in their vast drainage basins. Detailed hydrochemical research is needed to evaluate the different processes and mechanisms involved in polluting water [1]. Furthermore, due to temporal and spatial variations in water qualities, monitoring programs that involve a large number of physicochemical parameters and frequent water samplings at various sites are mandatory to produce reliable estimated topographies of surface water qualities [2]. The results are usually compiled into a large data matrix, which requires sophisticated data interpretations [3].
A variety of mathematical assessment models, including water quality index models [4], structurally dynamic models [5], fuzzy synthetic evaluation approach [6], generalized logistic models [7], Bayesian models [8], etc, have been used to study the physicochemical interrelationships and processes. However, these methods aren’t useful for large-scale and long-term monitoring database. Because of the limitations of these methods, the multivariate statistical analysis methods have the advantage of explaining complex water quality monitoring data to get a better understanding of the ecological status of the studied systems [9]. The multivariate statistical analysis has been successfully applied in a number of hydrogeochemical studies [10-13]. All the studies show that multivariate statistical analysis can help to interpret the complex data sets and assess the water quality, and it is useful in verifying temporal and spatial variations caused by natural and anthropogenic factors linked to seasonality.
In the study, the large database analyzed, was obtained during a 7-year (1998-2004) monitoring program (5,320 observations) of the Songhua River Basin. It was subjected to different multivariate statistical techniques (cluster analysis (CA), principal components analysis (PCA), factor analysis (FA) and discriminant analysis (DA)) with a view to extract information about the similarities or dissimilarities among the sampling sites. Latent factors in river water quality were identified and the water quality variables responsible for temporal and spatial variations explained the structure of the data sets. Further, the hidden factors revealed the influence of possible sources on the water quality parameters and pollution levels of sampling stations in the Songhua River Basin.
2. Materials and Methods
2.1. Study Area
The Songhua River Basin is one of the biggest river basins in China, which consists of Nen River, Second Songhua River, and Songhua River. The basin area is 556,800 km2 and the main stream spans 2,308 km long, in the north-eastern region of the China (Figure 1). The rivers are the major freshwater source for industries, farms, and millions of residents along their expansions [14,15]. The area of the Songhua River Basin is China’s largest aggregate of oil shale, borax and steatite, accounting for more than half of the nation’s total reserve. The region’s total population amounts are 62 million, 50% of which live in urban areas. At the end of 2004, the rate of urban sewage treatment was less than 40% in cities, such as Harbin, Changchun, Daqing and Mudanjiang. At 2006, the average sewage treatment of the whole basin is only about 15% [15].
2.2. Monitoring Sites
To accurately represent the water quality of the river systems, a sampling strategy was designed to cover a wide range of determinants at the key sites. In the present study, total 14 sampling stations (Figure 1). The location information of the 14 monitoring sites is showed in Table 1.
2.3. Data Preparation
The data sets of the 14 water quality monitoring stations, which comprised 14 water quality parameters monitored quarterly over 7 years (1998-2004), were obtained from the Ministry of Environmental Protection (MEP) of China. Although there were more than 20 water quality parameters available, only 14 parameters were selected because of their continuity in measurement at all selected water quality monitoring stations. The selected water quality parameters included temperature, pH, suspended solids, dissolved oxygen, chemical oxygen demand (manganese), biochemical oxygen demand after 5 days, ammonia nitrogen, nitrate nitrogen, volatile phenol, petroleum oil, total cyanide, total arsenic, total mercury and chromium VI. The water quality parameters with units and basic statistics are summarized in Table 2.

Figure 1. Map of study area and surface water quality monitoring stations.

Table 1. Basic situation of the 14 monitoring stations.

Table 2. Water quality parameters and summary basic statistics of the Songhua River Basina,b.
The K-S statistics were used to test the goodness-of-fit of the data to log-normal distribution. According to the K-S test, all the variables are log-normally distributed with 95% or higher confidence. Similarly, to examine the suitability of the data for principal component analysis/factor analysis, KMO and Bartlett’s test were performed, which also indicates that there are significant relationships among variables.
2.4. Multivariate Statistical Methods
The multivariate analyses of the river water quality data sets were performed through CA, PCA, FA and DA. CA, PCA and FA were applied to experimental data, standardized through z-scale transformation to avoid misclassification due to wide differences in data dimensionality [16-18], whereas DA was applied to raw data [19, 20].
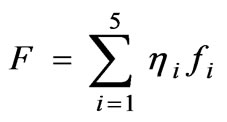
Then, with Equation (1) and Equation (2) the authors calculated the component scores (CS) and composite factor score (CFS) of each sampling station. The values of CFS reflected the pollution levels of sampling stations whereas the CS of each site revealed the sources of pollutants.
 (1)
(1)
 (2)
(2)
where f is the component score of sampling station, F the composite factor score,  the factor score (get from FA),
  the standardized measured value of a variable,
  the % variance of the principal component (get from PCA), i the component number, k the variable number.
In this study, CA was performed on the normalized data sets by means of the Ward’s method, using squared Euclidean distances as a measure of similarity. The spatial variability of water quality in the whole river basin was determined by CA, using the linkage distance (Dlink/Dmax), which represented the quotient between the linkage distances for a particular case divided by the maximal linkage distance. The quotient was then multiplied by 100 to standardize the linkage distance represented on the y-axis.
PCA is designed to transform the original variables into new, uncorrelated variables (axes), called the principal components, which are linear combinations of the original variables. The new axes lie along the directions of maximum variance. FA follows the PCA. The main purpose of the FA is to extract a lower dimensional linear structure from the data sets. It further reduces the contribution of less significant variables obtained from the PCA. And the new group of variables known as varifactors (VFs) is extracted through rotating the axis defined by the PCA.
The DA was applied to raw data by using the Bayesian model to construct the discriminant functions to evaluate both the temporal and spatial variations in river water quality.
All mathematical and statistical computations were carried out using Microsoft Office Excel 2003 and SPSS 11.5.
3. Results and Discussion
3.1. Site Similarity
The result of CA is shown in Figure 2. All the 14 sampling sites on the rivers were grouped into three statistically significant clusters at (Dlink/Dmax)×100<60: Cluster 1 (site 3, site 4, site 6, site 7, site 8, site 9, site 11, site 14), cluster 2 (site 2, site 5, site 10, site 12) and cluster 3 (site 1 and site 13). These clusters of sampling stations indicated that each cluster had a water quality of its own which was different from the other clusters. The CA results revealed that this approach was useful in offering reliable classifications of surface waters in the whole region and optimizing the design of a future spatial sampling strategy. Thus it can be said that for quick spatial assessments of water quality, one site sampled in each cluster is sufficient to determine the water quality of the entire network.
3.2. Data Structure Determination and Source Identification
The PCA and FA were performed on the normalized [16] data sets (14 variables). Five principal components (PC) were obtained with Eigenvalues >1 summing more than 85% of the total variance in the water data sets (Table 3).

Figure 2. Dendrogram showing clustering of sampling sites.
The first component (PC1), accounting for 33.3% of the total variance in the data sets of the river water, was correlated with CODMn, BOD5 and VP to represent “organic” pollution [8,10,11]. This ‘‘organic’’ factor can be interpreted as influences from point sources such as discharges from wastewater treatment plants, domestic wastewater and industrial effluents. The same interpretation was also suggested by the other studies [21,22]. The second component (PC2) that accounted for 21.01% of the total variance represented the “inorganic” parameters, which included SS, NO3-N, AS and CN in the solution and demonstrated similar behaviors as in the river water samples [19,20]. The third component of the total variance (PC3, 15.29%) had a strong positive loading on NH4-N and Oil and a moderate negative loading on DO. It was, therefore, a group of “petrochemical” source pollution indicator parameters [18]. The fourth component (PC4) associated to 9.89% of the total variance, was weighted on WT and pH and represented the “physiochemical” source of variability. The former study also supports the idea [23]. Finally, the fifth component (PC5) of PCA and FA that had strong positive loadings on Hg and Cr(VI) presented the last 7.18% of the total variation. The authors reckoned that PC5 could be associated with “heavy metals” pollution from metal activities and industrial effluents. The same conclusion was drawn by at least one other research [24,25].
Therefore, as the ‘‘organic’’ factor (PC1) has the largest proportion of the total variance, we have come to the conclusion that anthropogenic pollution mainly due to the domestic and industrial wastewater disposal, was the major source of river water contamination.

Table 3. Varimax rotated factor matrix for the whole data setsa.

Table 4. Sampling stations score matrix.
3.3. Pollution Level Analysis
With Equation (1) and Equation (2) the authors calculated the component score (CS) and composite factor score (CFS) of each sampling station. The values of CFS reflected the pollution levels of sampling stations whereas the CS of each site revealed the sources of pollutants. The results of the 14 sampling stations are presented in Table 4, which showed high pollution levels at site 1 and 13, especially site 13.
Water quality of site 13 was rated as "heavily polluted" due to pollutions from domestic wastewater, wastewater treatment plants, and from industrial effluents located in the city of Changchun. Compared to the upstream samples at station 14, severe pollution seen at site 1 indicated rapid deterioration of water quality while the Songhua River flowed through the city of Harbin. Both of the cities are big cities, and whose municipal sewage and industrial waste water not meeting the discharge standards [15,26,27] were found to be the immediate cause.
Site 4, site 6 and site 7 were situated at the lower peripheries of the city of Harbin. The pollution levels of these stations were moderate. Site 11 had a high value of PC5 which pointed heavy metals such as Hg and Cr(VI) in its samples. This station placed at the Nen River estuary, so the Nen River was a source of the heavy metal pollution of the Songhua River [28]. In the rivers network, site 3, site 8 and Site 9 were located in the medium-sized cities (Mudanjiang and Jiamusi). These sites also had medium values of CFS. According to the CFS values, site 2, site 5, site10 and site 12 of cluster 2 showed low pollution levels. Let’s recall the Figure 1, site 2, 5 and 10 were located at upstream whereas site 12 was at the most downstream location of the rivers. This observation that site 12 demonstrated a low degree of pollution may suggest a strong self purifying and assimilating capability of the rivers. Meanwhile, the above results also showed that the big cities had great impacts on the water quality of the Songhua River Basin.
Referring to the result of the CA technique (Figure 1), cluster 1 (sampling stations 3, 4, 6-9, 11, 14), Cluster 2 (sampling stations 2, 5, 10, 12) and cluster 3 (sampling stations 1, 13) corresponded to relatively moderate pollution (MP), low pollution (LP) and high pollution (HP) regions, respectively.

Table 5. Classification functions for discriminant analysis of temporal variations.

Table 6. Classification matrix for discriminant analysis of temporal variations.
3.4. Temporal and Spatial Variations in River Water Quality
A total of 5,320 observations were categorized into four known groups (1st Quarter: January 1-March 31, 2nd Quarter: April 1-June 30, 3rd Quarter: July 1-September 30, and 4th Quarter: October 1-December 31) and analyzed statistically using DA technique. The discriminant functions (DFs) and classification matrices (CMs) obtained from the Bayesian model of DA are listed in Tables 5 and 6, respectively. The DA gave the CMs with 79.9% correct assignations using only five discriminant parameters. Thus, the temporal DA results suggested that WT, pH, DO, NH4-N and NO3-N were the most significant parameters to discriminate between the four different quarters, which means that these five parameters account for most of the expected temporal variations in the river water quality.
Box and whisker plots of the selected parameters showing quarterly trends are given in Figure 3. The variation of water temperatures (Figure 3(a)) showed a clear-cut seasonal effect. The water pH values (Figure 3(b)) are higher in 2nd Quarter and Quarter 4th compared to 1st Quarter and 3rd Quarter. The average concentration of DO (Figure 3(c)) was observed to be lowest in 1st Quarter when parts of the river were frozen over. During 2nd Quarter to 4th Quarter, the inverse relationship between temperature and DO was a natural process because warmer water became more easily saturated with oxygen and it can hold less DO. A decrease in average NH4-N concentration (Figure 3(d)) from 1st Quarter to 3rd Quarter followed by an increase in 4th Quarter was observed. Similar temporal variations in concentration of NH4-N were also reported by [29]. The average concentration of NO3-N (Figure 3(f)) was highest in 3rd Quarter. It should be attributed to the influences from non-point sources such as agricultural runoff and atmospheric deposition. This fact was also supported by other studies [21,29].
Spatial DA was performed with the raw data after dividing the whole data sets into three spatial groups (LP region, MP region and HP region) obtained through the CA technique. The station (clustered) was the grouping (dependent) variable, while all the measured parameters constituted the independent variables. The DFs and CMs obtained from the Bayesian model of DA are listed in Tables 7 and 8, respectively. The DA gave the CMs with 78.6% correct assignations using only eight discriminant parameters. Thus, the result showed that only WT, pH,
 (a)
(a) (b)
(b) (c)
(c)
Figure 3. Temporal variations: (a) WT, (b) pH, (c) DO, (d) NH4-N, (e) NO3-N in water quality of the Songhua River Basin.
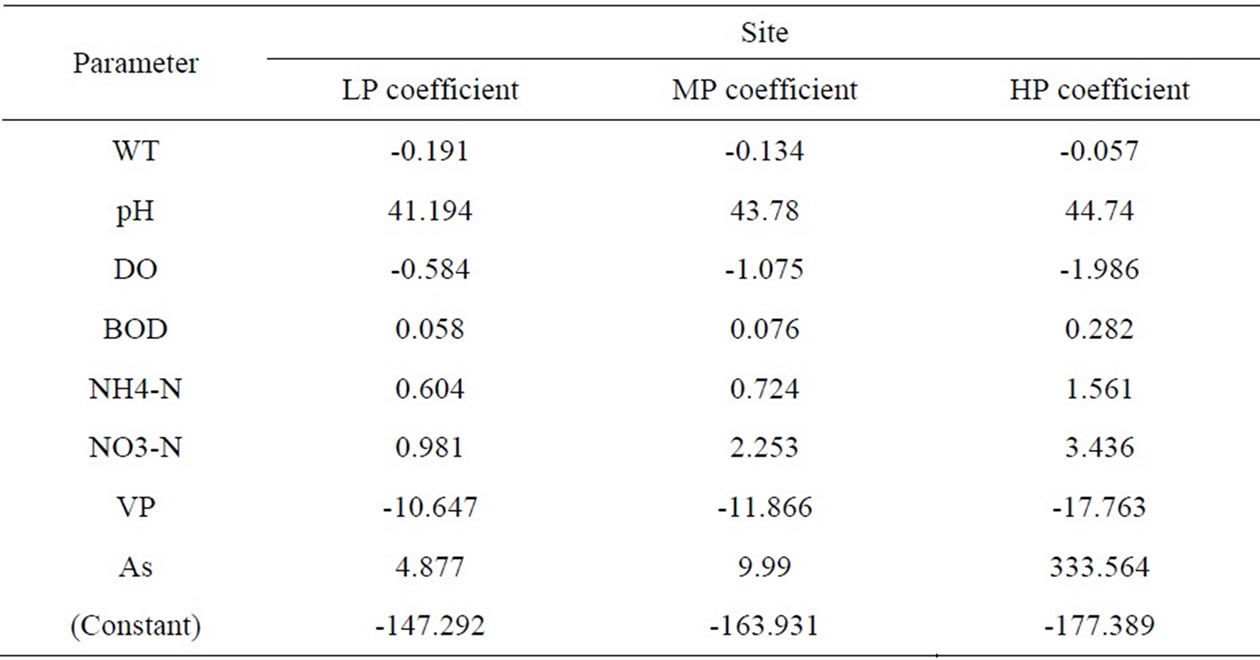
Table 7. Classification functions for discriminant analysis of spatial variations.

Table 8. Classification matrix for discriminant analysis of spatial variations.
DO, BOD5, NH4-N, NO3-N, VP and As were the discriminate parameters in space. And there were significant differences between these three categories (LP, MP and HP), which were expressed in terms of eight differentiating parameters. Hence, DA made a considerable data reduction.
Box and whisker plots of discriminating parameters identified by spatial DA were constructed to evaluate different patterns associated with spatial variations in river water quality (Figure 4). The river water temperatures (Figure 4(a)) were the highest at the MP sites as discharges of municipal wastewater merged. The water pH values (Figure 4(b)) were highest in the MP region and lowest in the LP region. The trends for DO (Figure 4(c)), BOD5 (Figure 4(d)) and NH4-N (Figure 4(e)) suggested a large load of dissolved organic matter at the HP sites where domestic wastewater from treatment plants and industrial effluents were injected. The MP sites had a high average concentration of NO3-N (Figure 4(f)), which should be attributed to the use of nitrogenous fertilizers in orchard and agricultural areas [15]. Similar trends of spatial variations observed for VP (Figure 4(g)) and As (Figure 4(h)) suggested vast difference in pollution load and sources in regions of the river.
4. Conclusions
In this study, different multivariate statistical techniques were used to evaluate variations in surface water quality of the Songhua River Basin. CA grouped the 14 sampling stations into three clusters of similar water quality characteristics. PCA and FA helped to identify that the parameters responsible for water quality variations were mainly related to trace organic, inorganic, petrochemical, physiochemical and heavy metals, and the principal components revealed the Songhua River Basin water quality was mainly controlled by domestic wastewater and industrial discharges. DA rendered an important data reduction, as it used only five parameters (WT, pH, DO, NH4-N and NO3-N) affording more than 79% correct assignations in temporal analysis, while eight parameters (WT, pH, DO, BOD5, NH4-N, NO3-N, VP and As) affording more than 78% right assignations in spatial analysis. Therefore, DA showed a reduction in the dimensionality of the large data sets, by delineating a few indicator parameters of the water quality. Consequently, this study illustrated the usefulness of multivariate statistical techniques for interpretation of complex data sets, identification of pollution sources, understanding tem-
 (a)
(a)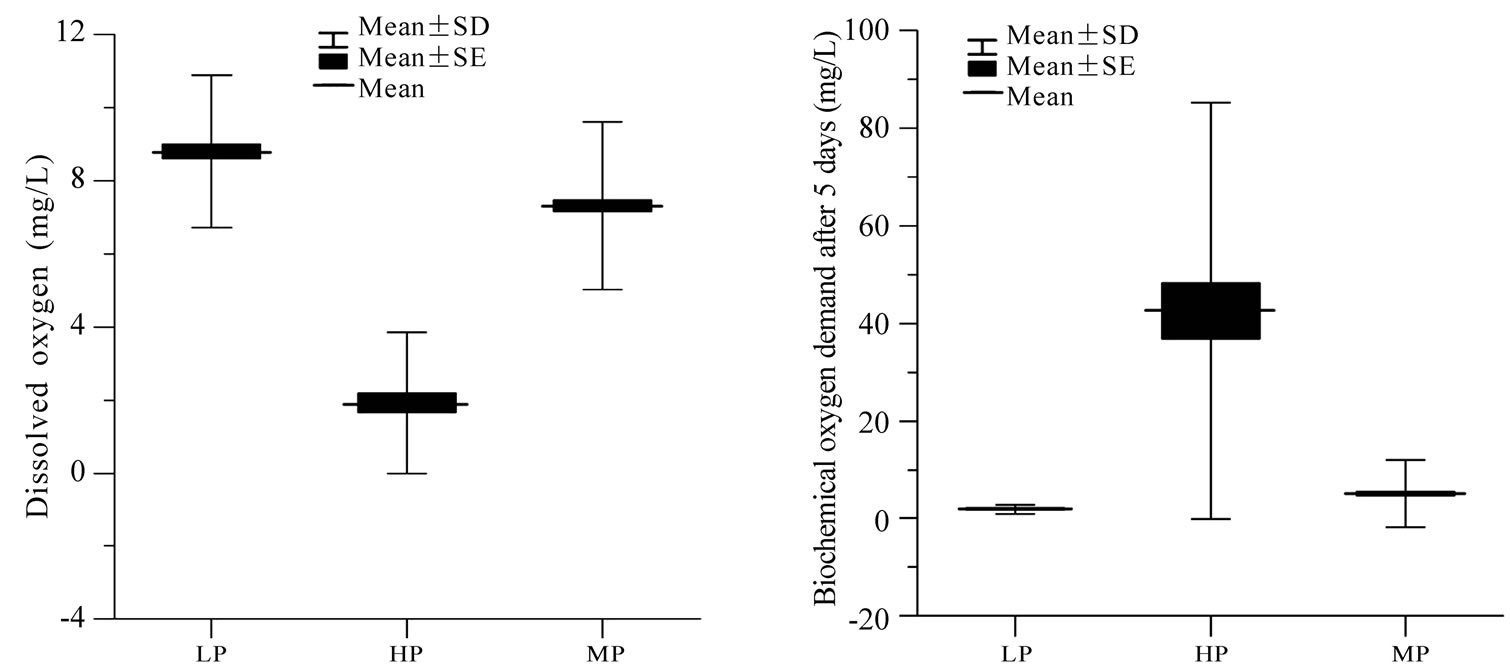 (b)
(b)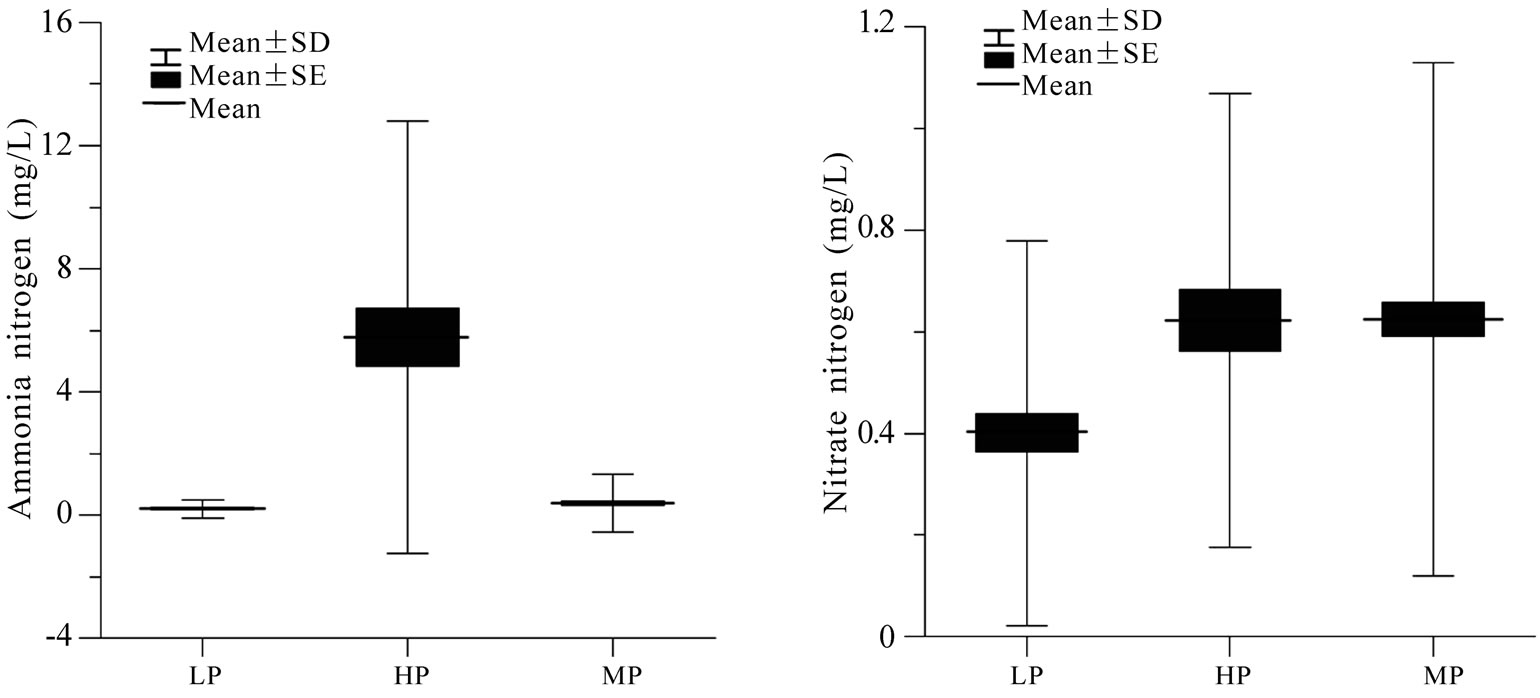 (c)
(c)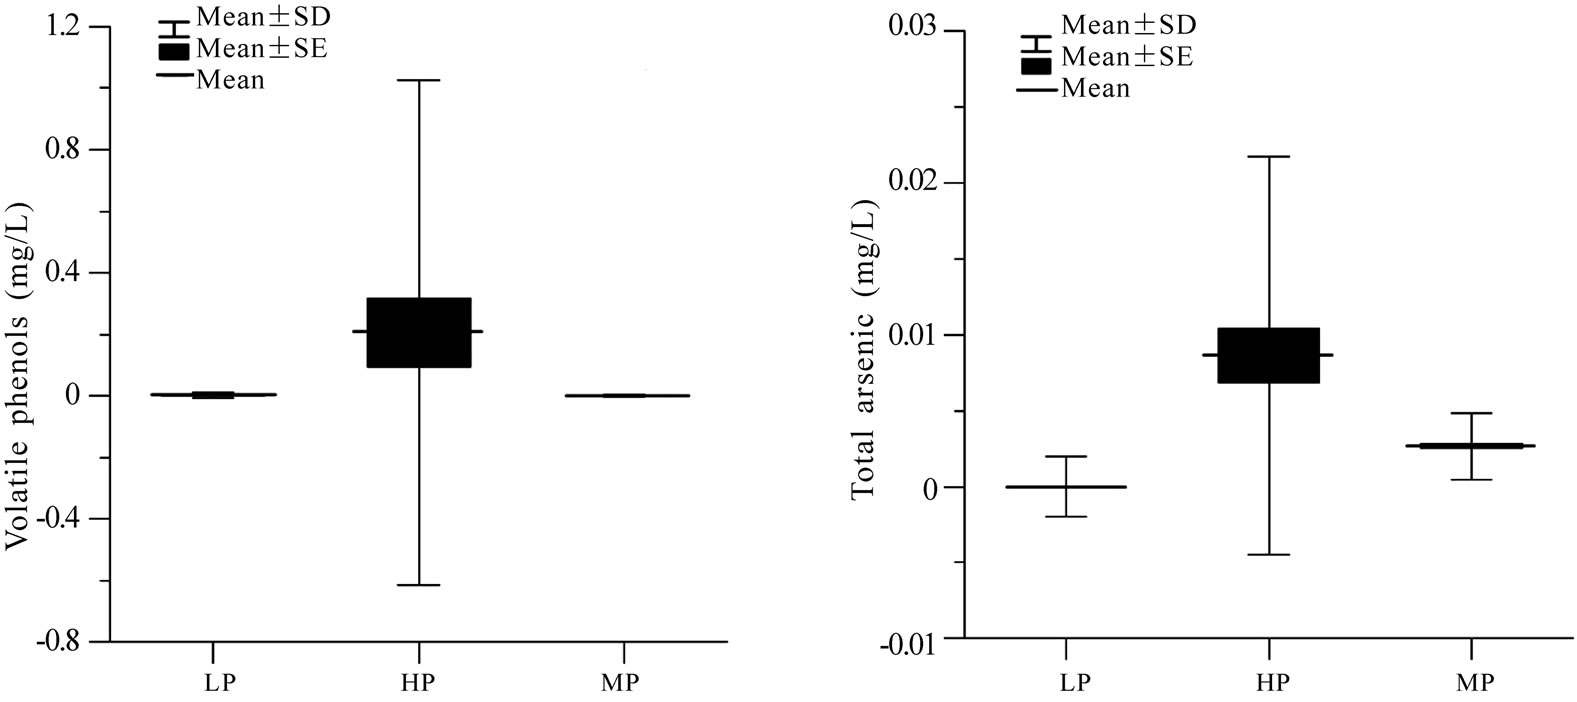 (d)
(d)
Figure 4. Spatial variations: (a) WT, (b) pH, (c) DO, (d) BOD, (e) NH4-N, (f) NO3-N, (g) VP, (h) As in water quality of the Songhua River Basin.
poral and spatial variations in water quality, analysis of pollution levels and design of monitoring strategy for effective river water quality management.
7. Acknowledgements
The research was supported by the National Natural Science Foundation of China (No. 40871262) and by National Science and Technology Project (No. 2007BAC08B03). The authors sincerely thank Bing Chen, Jian-su Mao et al. from Beijing Normal University and Bo Zhang, Qiang Sun et al. from Ministry of Environmental Protection of China for their suggestions and help.
REFERENCES
- B. A. Helena, M. Vega, E. Barrado, R. Pardo, and L. Fernandez, “A case of hydrochemical characterization of an alluvial aquifer influenced by human activities,” Water, Air, and Soil Pollution, Vol. 112, No. 3, pp. 365-387, 1999.
- W. Dixon and B. Chiswell, “Review of aquatic monitoring program design,” Water Research, Vol. 30, No. 9, pp. 1935-1948, 1996.
- D. Chapman, “Water quality assessment,” Chapman & Hall Press, London, 1992.
- S. B. Jonnalagadda and G. Mhere, “Water quality of the Odzi river in the eastern highlands of Zimbabwe,” Water Research, Vol. 35, No. 10, pp. 2371-2376, 2001.
- J. Zhang, S. E. Jorgensen, C. O. Tan, and M. Beklioglu, “A structurally dynamic modelling-Lake Mogan, Turkey as a case study,” Ecological Modelling, Vol. 164, No. 2, pp. 103-120, 2003.
- Y. T. Liou and S. L. Lo, “A fuzzy index model for trophic status evaluation of reservoir waters,” Water Research, Vol. 39, No. 7, pp. 1415-1423, 2003.
- C. O. Tan and M. Beklioglu, “Catastrophic-like shifts in shallow Turkish lakes: A modeling approach,” Ecological Modelling, Vol. 183, No. 4, pp. 425-434, 2005.
- M. E. Borsuk and C. A. Stow, “Bayesian parameter estimation in a mixed-order model of BOD decay,” Water Research, Vol. 34, No. 6, pp. 1830-1836, 2000.
- M. Vega, R. Pardo, E. Barrado, and L. Debán, “Assessment of seasonal and polluting effects on the quality of river water by exploratory data analysis,” Water Research, Vol. 32, No. 12, pp. 3581-3592, 1998.
- V. Simeonov, J. A. Stratis, C. Samara, G. Zachariadis, D. Voutsa, A. Anthemidis, M. Sofoniou, and T. Kouimtzis, “Assessment of the surface water quality in Northern Greece,” Water Research, Vol. 37, No. 17, pp. 4119- 4124, 2003.
- K. P. Singh, A. Malik, and S. Sinha, “Water quality assessment and apportionment of pollution sources of Gomti river (India) using multivariate statistical techniques: A case study,” Analytica Chimica Acta, Vol. 538, No. 1-2, pp. 355-374, 2005.
- T. Kowalkowskia, R. Zbytniewskia, J. Szpejnab, and B. Buszewski, “Application of chemometrics in river water classification,” Water Research, Vol. 40, No. 4, pp. 744-752, 2006.
- H. Boyacioglu, “Water pollution sources assessment by multivariate statistical methods in the Tahtali Basin, Turkey,” Environmental Geology, Vol. 54, No. 2, pp. 275-282, 2008.
- L. L. Ren, M. R. Wang, C. H. Li, and W. Zhang, “Impacts of human activity on river runoff in the northern area of China,” Journal of Hydrology, Vol. 261, No. 3, pp. 204-217, 2002.
- Ministry of Environmental Protection of China, “Planning of comprehensive water pollution control the Songhua River Basin,” 2006. http://wirmc.sepa.gov.cn/ info/hbdxj/200612/W020061207298075130105.pdf.
- D. A. Wunderlin, M. P. Diaz, M. V. Ame, S. F. Pesce, A. C. Hued, and M. A. Bistoni, “Pattern recognition techniques for the evaluation of spatial and temporal variations in water quality. A case study: Suquia river basin (Cordoba, Argentina),” Water Research, Vol. 35, No. 12, pp. 2881-2894, 2001.
- S. A. A. Wahab, C. S. Bakheit, and S. M. A. Alawi, “Principal component and multiple regression analysis in modelling of ground-level ozone and factors affecting its concentrations,” Environmental Modelling & Software, Vol. 20, No. 10, pp. 1263-1271, 2005.
- K. P. Singh, A. Malik, S. Sinha, D. Mohan, and S. Sinha, “Chemometric analysis of groundwater quality data of alluvial aquifer of Gangetic plain, North India,” Analytica Chimica Acta, Vol. 550, No. 1, pp. 82-91, 2005.
- C. W. Liu, K. H. Lin, and Y. M. Kuo, “Application of factor analysis in the assessment of groundwater quality in a Blackfoot disease area in Taiwan,” Science of the Total Environment, Vol. 313, No. 1, pp. 77-89, 2003.
- P. George, D. Gerasimoula, and L. Nicolaos, “A long-term study of temporal hydrochemical data in a shallow lake using multivariate statistical techniques,” Ecological Modelling, Vol. 193 No. 3, pp. 759-776, 2006.
- D. H. Wang, Y. Wang, and Z. Lin, “The control and damage of organic pollutant in Songhua River to the ecological environment,” Environmental Science and Management, Vol. 32, No. 6, pp. 67-69, 2007.
- Y. P. Liu, L. H. Wang, W. Liu, and Q. B. Liu, “Research of organic pollution’s character in Songhua River,” Environmental Science and Management, Vol. 31, No. 3, pp. 73-75, 2006.
- Q. L. Yang and T. Ma, “Water quality analysis and forecast of the Songhua River (Harbin),” Heilongjiang Science and Technology of Water Conservancy, Vol. 34, No. 1, pp. 71-74, 2006.
- L. M. Shen, C. K. Zhang, and H. K. Wang, “Water quality analysis of the Songhua River,” Heilongjiang Science and Technology of Water Conservancy, Vol. 35, No. 2, pp. 116-117, 2007.
- S. H. Guo, X. L. Wang, Y. Li, J. J. Chen, and J. C. Yang, “Investigation on Fe, Mn, Zn, Cu, Pb and Cd fractions in the natural surface coating samples and surficial sediments in the Songhua River, China”. Journal of Environmental Sciences, Vol. 18, No. 6, pp. 1193-1198, 2006.
- X. Q. Li, J. W. Zhang, Q. J. Wang, H. F. Zhang, and N. Qiu, “Analysis of mechanism of water purification by nature and strategy of protection of water environment in Songhua River through Harbin city,” Urban Environment & Urban Ecology, Vol. 16, No. 6, pp. 233-235, 2003.
- J. R. Liu, H. W. Dong, X. L. Tang, X. R. Sun, X. H. Han, B. Q. Chen, C. H. Sun, and B. F. Yang, “Genotoxicity of water from the Songhua River, China, in 1994–1995 and 2002–2003: Potential risks for human health,” Environmental Pollution, Vol. 157, No. 2, pp.357-364, 2009.
- S. K. Jiang and H. Liu, “Analysis for the present situation and development trend of the water quality in the downstream of Nenjiang River,” Jilin Water Resources, Vol. 265, No. 9, pp. 1-2, 2004.
- W. D. Yang and H. L. Jiang, “Cause analysis and control measure of water pollution in zhaoyuan section of Songhua River,” Environmental Science and Management, Vol. 32, No. 7, pp. 61-63, 2007.
NOTES
*Corresponding author.