Journal of Service Science and Management
Vol.6 No.1(2013), Article ID:28950,10 pages DOI:10.4236/jssm.2013.61006
The Customer Satisfaction Research of 7-ELEVEn Stores in Hong Kong*
![]()
1Department of Business Administration, School of Management, Jinan University, Guangzhou, China; 2Enterprise Management, School of Management, Jinan University, Guangzhou, China; 3School of Business Administration, South China University of Technology, Guangzhou, China; 4The Party School of the CPC Guangdong Provincial Committee, Guangzhou , China.
Email: txuym@126.com, shermon@163.com
Received December 4th, 2012; revised January 6th, 2013; accepted January 18th, 2013
Keywords: Hong Kong 7-ELEVEn; Convenience Store; Satisfaction; Service Quality; Factors Analysis
ABSTRACT
Using the 7-ELEVEn stores in Hong Kong as an example, this paper has studied customer satisfaction from the point of view of the enterprise. This paper has established a retail enterprise customer satisfaction model based on CCSI models. The secondary indexes of this customer satisfaction model include the following content: enterprise/brand image, quality expectations (shopping environment of convenience stores), quality perception (staff’s service quality), value perception, customer satisfaction, complaints and loyalty of customers and there are also 18 indexes in third class indicators. With the principal component analysis, it can be found that three important factors were value and overall satisfaction, employee service quality, shopping environment and brand image, besides three satisfaction factors were shopping environment, the staff’s service quality and perceived value. The aim of this paper is to provide reference for the key of enterprise’s future work and also for the optimal distribution of resources.
1. Introduction
In Hong Kong, most of the convenience stores are franchised, so the service quality will directly affect one even the entire chain system income, according to the statistics, a company loses 10% - 30% customers on average each year, however, usually they have no idea who the lost customers are, when and why they lost them; such customer loss will do their sales revenue and profit great damage. So it is required that the enterprise should focus on the individual needs of customers and meet that needs to attract them to purchase again [1].
In 1994 the United States established the econometric model (ACSI) of customer satisfaction index, in order to monitor the operation condition of the macroeconomic and increase comparability of customer satisfaction crossindustry and cross-department, but the model only stayed at macroscopic level. Since the customer satisfaction index has been introduced into China in 1995, domestic scholars have conducted a lot of research. According to the actual situation of the Chinese market, Tsinghua University has taken the lead in putting forward the CCSI model of Chinese customer satisfaction index. From seven aspects including enterprises’ brand image, expected quality, perceived quality, perceived value to reflect the customer satisfaction, customer complaints and customer loyalty, which evaluates the customer satisfaction at the micro level and also makes improvement for the existing customer satisfaction model [2].
2. Literature Review
2.1. Development and Situation of Convenience Stores
The operation of convenience stores (CVS) is facing a crossover revolution by providing multiple services, including daily fresh foods, a café, ticketing, and a grocery [3]. It means the convenience stores may provide greater access to foods and beverages than supermarkets or small grocery stores and thus influence food choice and consumption [4,5]. During these years, competition intensity in the retail industry has been getting more and more centralized and diversified. As a fast-developing retail condition, convenience stores have taken much more burden than they used to do the most important one among which is how to maintain the attraction to customers for convenience store [6]. Today’s conveniencestore retailing environment is hypercompetitive. Sustainable advantage gives way quickly as competitors scurry to copy innovations in operations and supply-chain management, implement similar technology, and mimic instore merchandising [7].
2.2. Customer Satisfaction Has Been Studied Widely
Churchill and Surprenant believed that consumer satisfaction derived from the results of consumers purchasing experiences and by using products [8]. Customer satisfaction has been studied widely.
Parasuraman, who has studied the impact of service quality on customer satisfaction, believed service quality has an important effect on customer satisfaction [9]. And the relationship between customer satisfaction and price sensitivity also has been studied. Satisfaction is divided into economic satisfaction derived from tangible products and social satisfaction provided by service encounters. That economic satisfaction is negatively associated with price sensitivity. However, social satisfaction is positively related to price sensitivity, especially for female customers and customers with high patronage frequency [10]. Personal interaction quality has a stronger influence on customer satisfaction. Customer satisfaction, in turn, contributes to customer loyalty; it means the satisfaction has a very strong influence on loyalty [11]. Besides, the study also involves the interests of the company, laws and regulations and so on.
3. Analysis of 7-ELEVEn in Hong Kong
In 1981, the first 7-ELEVEn in Hong Kong whose management right had been obtained by the Hong Kong milk company started business in happy valley. Just after 30 years, in Hong Kong, the number of 7-ELEVEn stores has increased to more than 1070 (To early 2012). And in those stores 24 hours a day are for customer service; at first there only sold drinks and snacks, later the “onestop” work style convenience services have been provided, such as charging, payment service, etc., and the Hot shot Hot selling cooked food has been opened, that provides customers with convenient fast food. In addition, the Hong Kong 7-ELEVEns also actively participate in public welfare activities and organize or support a variety of charity activities.
Hong Kong 7-ELEVEns’ management policies are as follows: 1) Complete ranges of goods, the goods customers need are readied so that the customers can search convenience and the search time will be reduced. 2) Guarantee of quality and fresh: The staff put fresh goods always and check the goods’ expiry date regularly every day to avoid expired food entering into the market and rights and interests of the consumers are harmed. 3) Hospitality: it provides good customer service; it’s believed the customer is god; they should provide service with smile and respect their demands then satisfy them. 4) Clean sanitation: the shops are kept clean and sanitary, because the stores’ environment has an effect on the shopping and make for happy customers (http://www. 7-11bj.com.cn/com_2.html finished by this studied).
4. Design of Research
1) By means of collecting the survey samples about Hong Kong 7-ELEVEn stores and analyzing the consumers’ behavior characteristics, the analysis will continue with the customer satisfaction and importance. 2) There is an evaluation for customers about the importance and satisfaction of products and services, through the comprehensive evaluation of the customer about Hong Kong at 7-ELEVEn stores. 3) Using the integration of CCSI model and service gap model, we have data analysis and SWOT analysis to judge whether the quality of service is fit and then find out the areas in need of improvement. 4) At last, the things to do are integrating the sample data, having a comprehensive evaluation on the service quality and customer satisfaction, and summarizing the main points to analyze the relationship between service quality and customer satisfaction, to improve customer satisfaction [12].
According to the characteristics of retail business in Hong Kong, there is research about 7-ELEVEn stores to understand the quality of service level and the characteristics of customer satisfaction, by means of part-time experiences in Hong Kong 7-ELEVEn and the in-depth interview with store managers. In this research, the CCSI model has been used to make a questionnaire which has surveyed the importance and satisfaction of customers with 21 problems. In addition, it has also analyzed the factors of customers with the help of sample analysis in SPSS (Figure 1).
Based on the characteristics of population distribution and consumers’ behavior, firstly, the research has investigated the cognitive importance about products in convenience stores, the customer loyalty and the satisfaction of convenience stores’ service, then it has analyzed the reliability, validity and variance, afterwards it can identify the problem and put forward corresponding countermeasure (Figure 2).
5. Basic Construction of the Customer Satisfaction Evaluation System
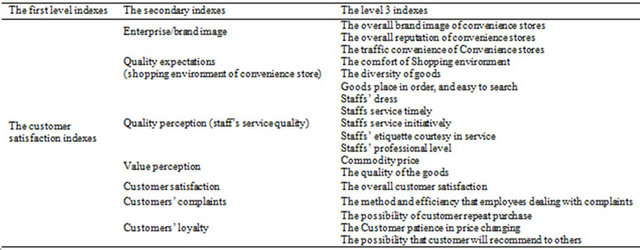
Combined with the characteristics of Hong Kong 7- ELEVEn stores, the investigation model of customer satisfaction has been established whose secondary indexes and level 3 indexes are reference to the structure design of CCSI model and micro model (Table 1).

Figure 1. The research approach.
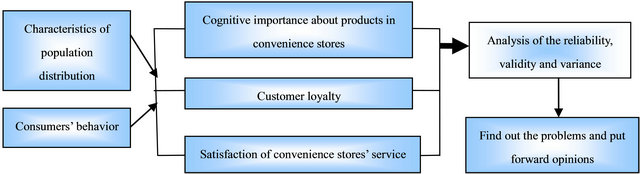
Figure 2. The technology roadmap.
Table 1. The customer satisfaction investigation (CCSI) model of Hong Kong 7-ELEVEn stores.
The five level Likert scale has been used. The questionnaire includes three parts: the first part is the evaluation about the degree of importance and satisfaction in various indexes for Hong Kong 7-ELEVEn stores’ customers; in this part, there is an evaluation from the enterprise/brand image, quality expectations (shopping environment of convenience stores), quality perception (staff’s service quality), value perception and overall customer satisfaction using the CCSI model as evaluation index. Customers should answer these indexes with the five level scale of Likert, which is from 1 to 5 and respectively mean extraordinary not important (extraordinary not satisfied), not important (not satisfied), general, important (satisfied), extraordinary important (extraordinary satisfied). The second part is the evaluation of customer satisfaction and loyalty; it is mainly about the repeat purchase possibility, the price’s bearing capacity and the possibility of recommending others to buy. Only get loyal customers, the enterprise can have profit. Only by getting loyal customers can the enterprise can have profit. The third part is the population characteristics, including gender, age, and occupation, etc. According to the content of each evaluation, it will analyze degree of satisfaction about Hong Kong 7-ELEVEn stores and find out the problems then put forward opinions.
This questionnaire aim at customers who have shopped in Hong Kong 7-ELEVEn stores. 1) The convenience store surveyed in this research is located in Kowloon Kwun Tong district of Hong Kong, and our targets are the residents there, so we handed out questionnaires to those customers who came to shop. 2) We handed out questionnaires to the students from Hong Kong in Jinan university, because in Jinan the Hong Kong students come from different districts, so that the data can be more comprehensive, but the ratio of students in vocational aspects will be relatively high. 3) At the same time, we also took an online questionnaire survey with the help of “questionnaire star” which is in highest reputation. By distributing this online questionnaire we could collect the questionnaire more conveniently and let respondents check the results through the network connection. That greatly increased respondent participation.
6. Data’s Collection and Processing
The questionnaire was distributed from April 3 to April 13 in 2012, 150 questionnaires had been distributed while 122 of them were sent back, and after the screening, 112 effective questionnaires were obtained; At the same time 162 questionnaires were distributed on the network, but there were only 150 effective questionnaires after deleting those invalid, so the final number of effective questionnaires was 262 and the effective rate was 83.9%.
6.1. Statistics of Basic Description
6.1.1. Population Characteristics
Male customers accounted for 48.5%, thus the female customer accounted for 51.5%. From this data distribution, it can be found the proportion of men and women consumers in Hong Kong 7-ELEVEn stores are relatively average. From the age of the structure, customers less than 20 years old accounted for 14.1%, between 21 to 30 years old accounted for 66.8%, 31 to 40 accounts for 11.1%. Thus on the whole, the customers in Hong Kong 7-ELEVEn stores are younger. And from the education of the structure, the ratio of university (college) is 70.2%, which in agreement with the result from age structure. By occupation, the ratios of students and people in the proportion is high, respectively is 48.9% and 40.8%. From the data, it can conclude that students and working people are the Main consumption group for Hong Kong 7-ELEVEn stores (Table 2).
6.1.2. Consumption Behavior Characteristics
The proportions of family income below 5000 yuan or between 10,000 and 20,000 yuan are bigger than others, which are 26.7% and 25.6%. The proportion of average consumption frequency every month of 1 - 10 times is biggest with 64.9%, while the proportion of zero time is only 9.2%, that means customers will consume in Hong
Table 2. Customers’ percentage data sheet in population characteristics.
Kong 7-ELEVEn stores. And the proportions of average consumption amount every month below 50 yuan or between 50 and 100 yuan are bigger than others, which are 31.1% and 30.5%. For the way customers know Hong Kong 7-ELEVEn stores, passing away occupies a large advantage with proportion in 61.5%, which illustrates that the distribution range of Hong Kong 7-ELEVEn stores is wide for the customers to consume (Table 3).
6.1.3. Importance and Satisfaction about Consumption of Customers
For the scores about the importance and satisfaction of the indexes in the sample data, four options including the overall brand image of convenience stores, whether goods are placed in order, and easy to search, staffs’ initiative in service and staffs’ professional level have greatest standard deviations in importance. Besides, other four options including staffs’ initiative, etiquette courtesy in service, staffs’ professional level and price make greatest standard deviations in satisfaction (Table 4).
Because customers are from different age, occupation, family income groups and so on, when they face the same product or service, the will have different behavior and reactions (Figure 3). The reasons are as follows: 1) The customer’s age—it is closely related to the product in convenience stores, service and price. The overall trend is that the number of customers between 21 and 30 years old is bigger than others while more than 30 years of age is relatively less. 2) Customers’ occupation—it is bound up with price of convenience store, the quality of service. The occupation has an effect on consumers’ consumption level and the consumption concept. The bear and accept ability of Students and on-the-job persons in the price of the convenience store to are higher. 3) The customer’s family income—it relates to the convenience stores’ brand, product diversity, the price and so on. Customers with high family income are more sensitive to the brand of convenience stores. 4) The customer’s degree of education—the degree of education is related to the abstract factors like brand and service. A high degree of education customers pay more attention to the added value of commodities, it means they also pay attention to “emotional interest” in the process of shopping besides the essence function of goods.
Table 3. The customers’ percentage data sheet in consumption behavior characteristics.
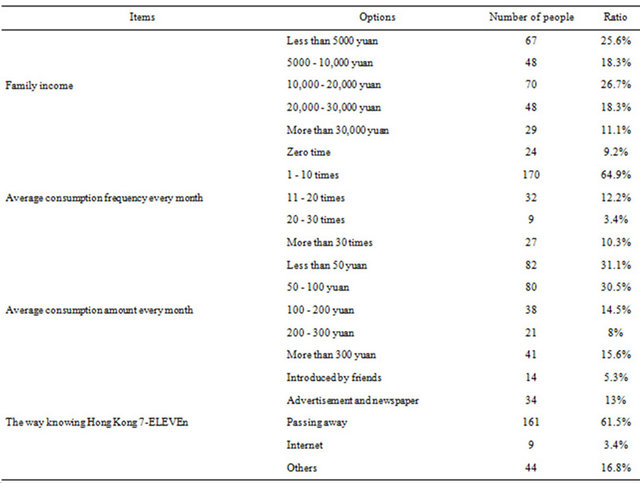
Table 4. The customers’ percentage data sheet in importance and satisfaction for products and services.

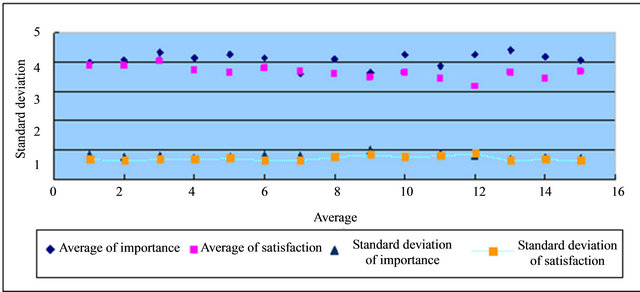
Figure 3. The comparison between importance and satisfaction of customers.
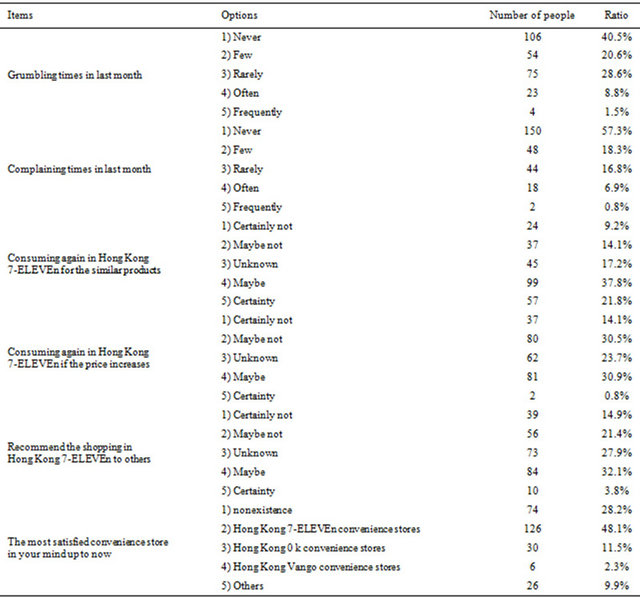
6.1.4. Loyalty of Customers
It can be seen the condition that customers never grumble or complain is common, the proportions of them are 40.5% and 57.3%, the high proportions mean all respects have done well in the convenience stores. And the ratio of continue consuming in this convenience store is 37.8%, if the price increases, the ratio of that they will continue buy is 30.9% and may not is 30.5%, and the high proportion tells that convenience stores should pay more attention to customer’s demand in price. In the aspect of recommendation, the proportion of choosing “may be” accounts for 32.1% and “I don’t know” accounts for 27.9%, “I don’t know” means customer may recommend or not. So far, from the data analysis of the survey, it can be concluded that for the most satisfied convenience store, the proportion of 7-ELEVEn accounts for 48.1%, the rival 0 k convenience store accounts for 11.5%, 28.2% of customers choose “no”, this is a potential customer’s category (Table 5).
6.2. Validity Analysis
6.2.1. Correlation Analysis
The KMO values here (Table 6) are 0.853 and 0.888, the statistics of importance index and satisfaction index are greater than 0.80, the presenting natures are “good”, it means there is a common factor among the variables and the variables are fit for factor analysis.
The importance value of Bartlett sphericity test is 1389.692, (the degree of freedom is 105) and the satisfaction value is 1627.260, (the degree of freedom is 105), the off-diagonal numerical of unit matrix which indicates net correlation matrix are zero, the significant probability value here is p = 0.000 < 0.05 and the null hypothesis is refused, namely the hypothesis that net correlation matrix of variables is not unit matrix hypothesis. Accepting the hypothesis that net correlation matrix is unit matrix hypothesis, it means there is a common factor among the variables and the variables are fit for factor analysis.
Table 5. The customers’ percentage data sheet in loyalty of customers.
6.2.2. Factor Extraction
When the principal component analysis is used to extract common factor, the preliminary intercommunity estimators are 1, and if the degree of communality is under 0.2, that this item can be deleted. In Table 7 the initial values of importance and satisfaction are 1, the values of the extraction are greater than 0.20, so all of that have no need to be deleted.
Here the Varimax is used to make the orthogonal rotation, and it’s treated with default method of Kaise normalizing in the orthogonal rotation which has 3 times conversion of iteration. The main purpose of rotation which has been arranged with the load capacity of factor is arranging the factors’ load capacity of items in each common factor. After the rotation, the factors’ load capacity which was bigger originally become much bigger, while the smaller one get much smaller, and the item’s quadratic sum of load capacity in each common factor (intercommunity of item) is the same as before. Because here we used is orthogonal rotation, the coefficient in the table can be regarded as correlation coefficient matrix about variable and factor, namely factor structure matrix, can also be regarded as factor’s weighting matrix (namely factor’s pattern matrix), the later factor matrix is made by the factor matrix before multiplying by the factor transformation matrix.
From Table 8, the following can be seen: the first common factor is contained in 10, 12, 13, 14 and 15 these five problems, the second one is contained in 5, 6, 7, 8, 9 and 11, and the third one is contained in 1, 2, 3 and 4, that means the correlation between them is large. In addition, the first common factor can be called “value and overall satisfaction”, the second one is “staffs’ service quality”, and the third one is “shopping environment and brand image”.
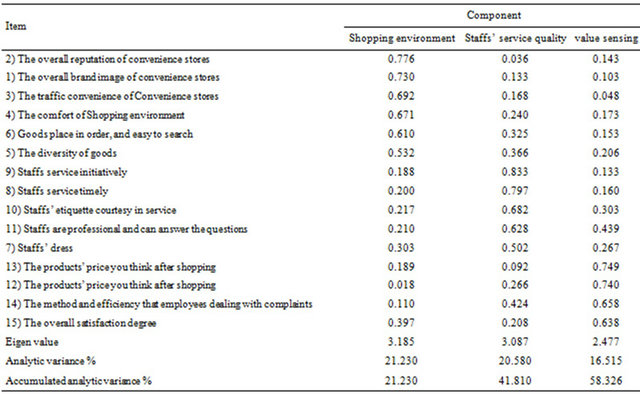
From Table 9, we also can find that: the first common factor is contained in 1, 2, 3, 4 , 5 and 6 these six problems, the second one is contained in 7, 8, 8, 10 and11, and the third one is contained in 12, 13, 14 and 15, that means the correlation between them is large. In the same way, the first common factor can be called “shopping environment and brand image”, the second one is “staffs’ service quality”, and the third one is “value and overall satisfaction”.
Table 6. The importance and satisfaction test in KMO and bartlett.
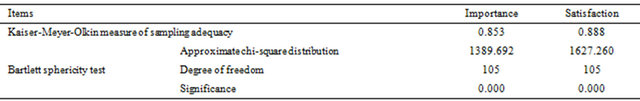
Table 7. The evaluation of communalities’ degree about importance and satisfaction.
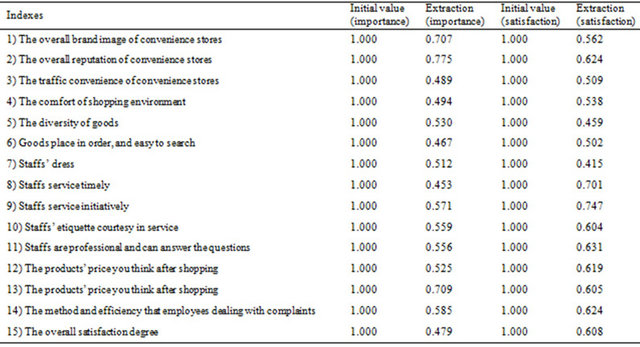
Table 8. The feature matrix of importance after rotation.
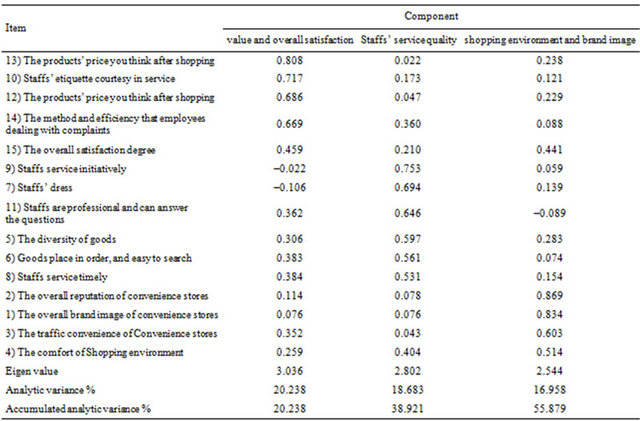
Table 9. The feature matrix of satisfaction after rotation.
7. Conclusions
The five level Likert scale has been used to scale every index of customer satisfaction, and it has been found that there are 15 factors affecting the customer satisfaction, the correlation and significance of these factors quite good with the research in importance and satisfaction these two aspects. For this reason, the studied category in this paper is more reasonable.
A CCSI model has been used, and the tangibility, reliability, reactiveness, assurance and empathy of the SERVQUAL scale have been mixed into the quality perception (staff’s service quality) of the CCSI model, here the quality perception is including staffs’ dress, staffs’ initiative service, staffs’ etiquette courtesy in service and Staffs are professional and can answer the questions. In this foundation, the reliability test and factor analysis has been used to find out the key factors that affect the customer satisfaction. This paper has used the Hong Kong 7-ELEVEn stores as the research object, built up a customer satisfaction model which is based on the Extraction methods: principal component analysis retail enterprise, then evaluated the customer satisfaction of Hong Kong 7-ELEVEn stores, at last identified the factors which affect customer satisfaction through the principal component analysis. We have provided a reference for the key to the enterprise’s future work and also for the optimal distribution of resources is the purpose of this paper.
8. Acknowledgements
Thanks for the helpful discussion with Miss. F. Z. Li and also the people who gave help in the questionnaire investigation.
REFERENCES
- N. Hill and J. Alexander, “Handbook of Customer Satisfaction and Loyalty Measurement,” Mechanical Industry Publishing House, Beijing, 2004, pp. 7-8.
- C. Fornell and J. L. Liu, “Customer Satisfaction and ACSI,” Tianjin University Publishing House, Tianjin, 2006, pp. 6-7.
- W.-I. Lee, B.-Y. Shih and C.-Y. Chen, “A Hybrid Artificial Intelligence Sales-Forecasting System in the Convenience Store Industry,” Human Factors and Ergonomics in Manufacturing & Service Industries, Vol. 22, No. 3, 2012, pp. 188-196. doi:10.1002/hfm.20272
- R. E. Walker and I. Kawachi, “Use of Concept Mapping to Explore the Influence of Food Security on Food Buying Practices,” Journal of the Academy of Nutrition, Vol. 112, No. 5, 2012, pp. 711-717.
- J. R. Sharkey, S. Horel, D. Han and J. C. Huber, “Association between Neighborhood Need and Spatial Access to Food Stores and Fast Food Restaurants in Neighborhoods of Colonias,” International Journal of Health Geographics, Vol. 8, No. 9, 2009, pp. 1-17. doi:10.1186/1476-072X-8-9
- Q.-C. Zhang, T.-J. Chou and L.-J. Yuan, “Research on the Link between Customer Satisfaction and Customer Behavior: A New Customer Management Profile. Forecasting, Vol. 27, No. 4, 2008, pp. 25-30.
- M2Media360, “The State of Innovation in the Convenience-Store Industry,” National Petroleum News, Vol. 92, No. 5, 2000, pp. 28-31.
- G. A. Churchill Jr. and C. Surprenant, “An Investigation into the Determinants of Customer Satisfaction,” Journal of Marketing Research, Vol. 19, No. 4, 1982, pp. 491- 504. doi:10.2307/3151722
- A. Parasuraman, V. A. Zeithaml and L. L. Berry, “SERVQUAL: A Multiple-Item Scale for Measuring Consumer Perception of Service Quality,” Journal of Retailing, Vol. 64, No. 1, 1988, pp. 12-40.
- W.-S. Low, J.-D. Lee and S.-M. Cheng, “The Link between Customer Satisfaction and Price Sensitivity: An Investigation of Retailing Industry in Taiwan,” Journal of Retailing and Consumer Services, Available online 15 September 2012.
- P. Z. Vesna, “Managing Customer Loyalty through the Mediating Role of Satisfaction in the DIY Retail Loyalty Program,” Journal of Retailing and Consumer Services, Vol. 16, No. 5, 2009, pp. 396-406. doi:10.1016/j.jretconser.2009.05.002
- China Quality Association, “Customer Satisfaction Assessment Handbook,” China Social Press, Beijing, 2007.
NOTES
*This paper is supported by key items of the soft science project in Guangdong provincial department of science and technology (Item Number: 2011A070102001) and the high-tech office in Guangdong provincial department of science and technology (Item Number: 2011B010100031).