Journal of Environmental Protection
Vol. 4 No. 5 (2013) , Article ID: 31417 , 11 pages DOI:10.4236/jep.2013.45052
Modeling Municipal Solid Waste Management in Africa: Case Study of Matadi, the Democratic Republic of Congo
![]()
1The Open University of Israel, Raanana, Israel; 2Tel-Aviv University, Tel-Aviv, Israel; 3Independent Expert for Waste to Energy Projects, Moshav Aniam, Israel.
Email: *gregoryyd@gmail.com
Copyright © 2013 Gregory Yom Din, Emil Cohen. This is an open access article distributed under the Creative Commons Attribution License, which permits unrestricted use, distribution, and reproduction in any medium, provided the original work is properly cited.
Received February 28th, 2013; revised March 30th, 2013; accepted April 29th, 2013
Keywords: Municipal Solid Waste; Waste Treatment; Emissions Trading; Planning; Economic Evaluation
ABSTRACT
The purpose of this article is to present the key elements for best performance and profitability of Municipal Solid Waste (MSW) management in a low-income city. The research provides an overview of methods and models for integrated planning of a two-phase program: MSW collection and transportation, and MSW treatment. We present the case study of Matadi (the Democratic Republic of Congo) that has a low level of the MSW management compared to other African cities. We develop a spreadsheet model for collection and transportation of MSW which is relevant for low-income cities and enables determining the waste collection fee. A CDM decay model is used to predict the GHG emissions in disposal site. The MSW treatment plant in case of Matadi is evaluated. For the anaerobic digestion technology selected as appropriate for this plant, the key factors that ensure profitability of the plant are as follows: tipping fee from the municipality (19% of total revenue), amount of carbon credits which can sum up to 16% of the total revenue, expansion of waste collection range from 25 to 50 km. The methods of this study can be used for solving waste problem in other low-income cities where the budget for municipal services is scanty, particularly when starting from a very low level of MSW management.
1. Introduction
A large amount of MSW in Africa still piles up on the spot, in trenches, ditches, riverbanks and roadsides, the waste burns in open air or drift by the river flow or the heavy rains. The consequences are air pollution, contamination of soil, groundwater, and rivers. In many Sub-Saharan African cities, MSW generation per capita/day ranges between 0.3 and 0.8 kilograms [1,2]. This amount is by far below the values in developed countries. Reports from OECD countries show average waste generation of 1.39 kg/capita/day [3]. The statistically significant relationship between waste generation per capita, on one hand, and gross national income and the human development index (this measures the country’s achievements in a long and healthy life, knowledge and a decent standard of living), on the other hand, explains this gap [4].
All the above is valid for Matadi, the main seaport of the Democratic Republic of Congo (the DRC). In 2010- 2011, this country had the world lowest GDP per capitain the range of 200 to 230 US$ [5]. Matadi is the capital of the province Congo Central situated in the bank of the Congo River. Approximately 350,000 citizens live in Matadi within the populated area of 224 km2 (UNAID centre in Matadi). Until 2011, MSW collection system was not common practice in Matadi. The waste was buried onsite, alongside the roads, in the streets, between houses, on low ground, in manmade channels. Burning waste was implemented everywhere. Disposal or transfer stations for waste do not exist in the province. The unsolved problem of municipal waste along with other human activities causes environmental damage to the Congo River, the second largest river in the world after the Amazon River in terms of the size of its drainage and water discharge [6].
In 2008, the Government of the province appealed for a study of possible MSW management solution in Matadi referring to the following questions:
Phase 1: Planning collection and transportation of MSW; what are the needed organizational, technical and financial resources? Is it feasible and sustainable?
Phase 2: MSW treatment: is it a profitable enterprise?
The purpose of this article is to present the key elements for best performance and profitability of MSW management in a low-income city. This requires processing and analyzing the database, implementing quantitative methods and models to draw conclusions and results. We had to compose applicable methods that would express our approach to the problems and concerns of MSW management in low-income cities in Africa.
In this study we provide methods relating to the case of Matadi. We answer the above questions and conclude with the importance of the study for other low-income cities that are facing similar problems and concerns regarding MSW management.
There are a number of features that define MSW management in Africa.
a) Generally, the level of waste management is very low. Furthermore, it differs between the city zones [7-9];
b) Techno-organizational reasons: poor accessibility within the city, lack of properly designed collection route system and time schedule, inadequate equipment;
c) Inappropriate methods of finance when the budget for municipal services is scanty. This can lead to failure to assess the revenue generating capacity of municipalities and their debt-servicing requirements [10];
d) Community issues: lack of public awareness and community involvement, lack of mandatory and environment regulations and enforcement of these regulations, no master plan designed to the region or for the future city development;
e) High population growth rate and rapid urbanization worsen chronic waste management problems [11].
Waste collection coverage in urban areas in many African countries remains low compared to developing countries in other regions. In 2009, for 6 selected African countries this coverage changed in the range from 27% to 87% while for 6 selected Latin American countries it changed from 56% to 97% [12].
The private sector can help in alleviating these problems. Private companies have an important role in the MSW management in developing countries offering a means of enhancing efficiency and lowering costs, mobilizing needed investment funds, and introducing proven and cost effective technologies along with management expertise [13]. Challenges of privatizing MSW management in one of the municipalities in Ghana and the role of tax incentives are presented [14]. A planning model for MSW collection and transportation described in our article is aimed at economic evaluating a private company in a city where the income of the company is derived from waste collection fee.
In the last years, the MSW management continues to be an environmental health burden in many African cities [15]. In the article [9] planning municipal systems of collection and transportation of MSW in low-income cities in Africa are described. In [16], the statutory, financial, and physical aspects of MSW management are discussed. Transportation distances, infrastructure quality and accessibility are identified as decisive factors on waste collection considerations in the city of Yaoundé, the capital of Cameroon.
The current MSW management in major African cities is discussed in [17]. The authors offer assessments concerning MSW collection and treatment, and specify investment and operational costs needed for expansion of waste collection service for the entire population in the surveyed cities.
The review [1] summarizes and compares GHG emissions from MSW treatment plants, in Africa particularly. The authors conclude that the CDM projects have made some progress in this field in developed countries; however, African countries lag by far behind.
The study [7] provides an information base to plan for the equipment required for the collection and transport of waste in a city of Ogbomoso, Nigeria. The study is aimed at making decisions on possibilities for waste reduction through sorting and recycling, and disposal methods. It highlights a very high proportion, more than three-quarters, of organic waste in total waste flows of the city.
To the best of our knowledge, our study provides the first empirical evidence for MSW management in Matadi.
2. Materials and Methods
2.1. Concept of the Study
A few groups of demographic, waste generation, technical and economic data for modeling MSW collection and transportation, calculating GHG emissions and carbon credits, evaluating MSW treatment are used (Figure 1: data base).
These data enable to calculate the generation of MSW, its growth during the planning period, the characteristics of equipment, labor, costs, and local conditions and abilities. At first, the plan related to the range of service of 25 km for waste collection but later the range of service was expanded to 50 km. We include Boma (a major port on Congo River, population 400 thousand) and adjacent ports to increase the collected amount of waste sufficient for the plant processing capacity and treatment efficiency. We use the IPCC first order decay model to predict GHG emissions abated due to MSW treatment plant. We survey the local waste quantities, fractions and composition. To evaluate MSW treatment technologies, we use budgetary proposals of the technologies supplied by their producers, and costs and abilities of local workshops.
For the development of the comprehensive solution of MSW treatment, we integrate all the above (Figure 1: data processing, integration).

Figure 1. The concept for planning MSW management in Matadi.
2.2. Evaluation of Waste Quantity and Composition. Basic Assumptions
Using estimates received from the Matadi municipality, an annual population growth rate of 3% is assumed. The growth rate of MSW generation in Matadi is defined conservatively 1.5% per year assuming a slow growth of income and small business activity in the city in the nearest years. Until now MSW was mostly burned on the spot. The municipality did not initiate any deliberate action on waste collection or treatment, and there were no available vessels or bins for waste collection in the streets. We found access roads to the residential areas and trip roads garbled and unmaintained.
In 2008-2009 we collected data of MSW generation in Matadi. We relied on a city map provided by UN Matadi headquarters. The data about the population are from the last General Census conducted in 1994. Using these sources and assuming 35% population growth rate in Matadi since 1994, we projected a total 44 thousand households in Matadi in 2011 and assumed an average of eight capita per household. We surveyed a number of public buildings, restaurants and hotels, and family food enterprises in the city. The residential area for MSW collection can be estimated as much as 35 km2, 200 m2 per household plus the equal additional public space (16% of the Matadi populated area).
In the pilot phase of estimation of MSW generated, additional points of interest like major markets, open burning spots of waste (Figure 2(a)), and waste disposal alongside river banks were surveyed. We also surveyed waste disposal yards that surround Government and municipal buildings, UN offices, hotels and restaurants. We prepared a small transit site for our tests and sampling (Figure 2(b)).
To determine waste production per capita, we collected and piled the waste from sixty households for three consecutive days. A distinction was made between five neighborhoods due to different life standards (workers, shop owners, small farmers). This is in line with conclusions of other researchers. The study [7] for a traditional African city in Nigeria shows that education, income and social status influence waste generation. The study [10] (Section 3.2.1) describe the experience of obtaining data concerning the waste in developing countries and note that residents of different socio-economic groups generate waste at different rates.
Five samples from each household were taken (total 5 × 60 = 300 samples). The waste from houses was weighted, divided in batches from the neighborhoods, and put on a plastic layer. The waste fractions were sampled by weight. To sort out the waste fractions, waste was sampled from all spots like riverbank, ditches, trenches, yards nearby small hotels and restaurants, and small food businesses. Based on these sources, we calculated weighted average of the waste components. We also sampled waste and residues from two major markets of the city. Seasonal variability of waste generation was assumed negligible due to the following reasons: the weather and the style of life are very stable throughout the year, and there is no tourism, colleges, seasonal business activity in the city.
The generation rate of MSW from households was estimated 91 kg per capita/year, or 0.25 kg per capita/day. The quantity of waste from small hotels, restaurants, and public buildings was estimated 3 thousand ton/year. The total generation rate of MSW was estimated 0.27 kg per capita/day, or 99 kg per capita/year. This is a low rate compared to other African low-income cities and to the estimates 0.35 - 0.65 kg per capita/day for small to
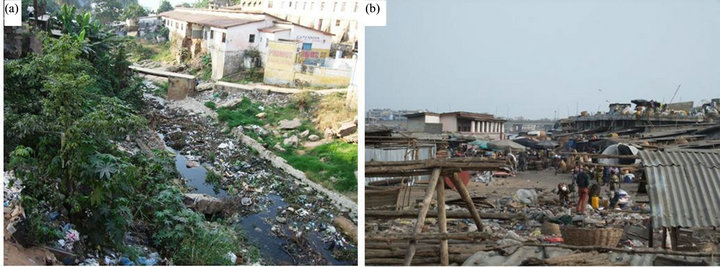
Figure 2. (a) Open burning trench in Matadi; (b) Waste sampling staff at work.
medium cities (under 500,000 residents) in low-income countries ([13], Appendix A, Table 4).
We took into account that the city has no master plan available. Matadi spreads over several hills along the Congo River. The infrastructure of the city is very poor. Main roads are narrow and not maintained properly; most of them are gravel roads. Houses/barracks are aggregated in neighborhoods with low accessibility to vehicles. Therefore, planning collection and transportation of MSW involved manual labor, small bins and very few transfer stations.
From the total amount of MSW, a part of the waste, mainly from small businesses, public buildings and neighboring households is planned for collecting in big Bins B (30 m3), and another part, mainly from households—for collecting in Bins A (3 m3). Handcarts with capacity of 0.25 m3 are planned to deliver the MSW from houses to Bins A.
Fresh MSW bulk density in handcarts and bins was estimated 400 kg/m3. This is in the range of data reported by other researchers. Because it is believed that degradation of waste increases waste density we compared our estimate with data of fresh MSW. In this comparison, we took into account that MSW in developing countries has an initial density similar to that of compacted MSW from developed countries, probably due to its initial moisture content, 30% to 70% in developing countries as against 25% to 35% in developed countries [18]. In the last study, initial densities are reported 130 - 190 kg/m3, and the density in the vehicle—400 to 550 kg/m3 (developing countries data). According to [19], for a collection truck that compacts the waste, waste density is normally between 350 and 420 kg/m3 (US data). In [20], the density of fresh MSW samples collected from the working face of a landfill was 515 kg/m+ (US data).
The analysis of wet MSW in Matadi by weight showed the following composition of waste: organic matter and food residues—80%; plastic, PVC, paper, cardboards— 12.5%; other: clothes, sand and stones, glass, ceramics— 7.5%.
We compared these data with those obtained in other low-income cities. In Phnom Penh (Cambodia), the MSW composition in 1999 was close to that from Matadi: 87%, 9%, and 4%, accordingly. In 2003, after a significant increase in GDP has begun, a greater part of nonorganic components was reported, and the composition was as follows: 63%, 22%, and 15%, accordingly [21].
2.3. MSW Collection and Transportation: A Planning Model and Framework
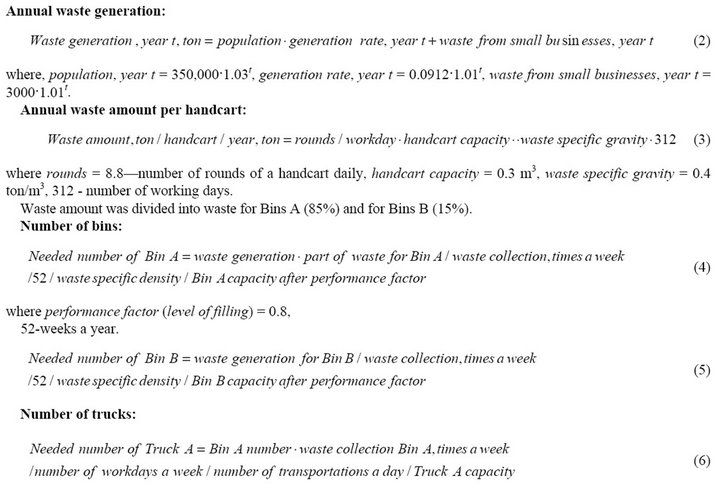
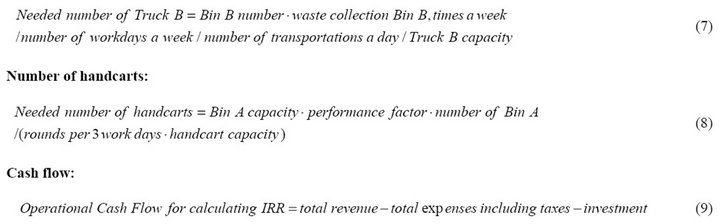
The spreadsheet model includes database and equations for calculating waste and machinery and equipment for its collection and transportation to the disposal site, costs, cash flow, and financial indices (Figure 3). The highlights of the model for 8 main equations are given in Appendix B.
In absence of local institutional, technical and management capacities in Matadi, it was decided to establish a company for realization, operating and maintaining the project. In addition, a period of chosen local team training for required tasks was planned. The output module includes all necessary information and data that justify the establishment of a company for MSW collection and transportation in Matadi (“MSW Company”). The income of the company is derived from tipping fee paid by the municipality. The model enables to determine the waste collection fee according to the planned payback period of the MSW company (five years payback period was assumed). The aims of the company are to realize the MSW collection and transportation program, to accomplish a gradual improvement in sanitation and betterment of life standard in the residential area, to employ local workers and existing abilities.

Figure 3. Flow chart of the planning model for MSW collection and transportation.
2.4. Prediction of GHG Emissions from Disposal Site and Calculation of Carbon Credits
Possible carbon credits can be predicted from GHG abated emissions in a central disposal site for MSW collected, and due to the emission savings for the generation of electricity by fossil fuel. General guidelines for this prediction, values of factors and coefficients are available in the IPCC guidelines and in the corresponding methodologies of CDM. Predicted biogas yields from non-processed MSW can be calculated based on the studied MSW composition, methane generation rates, and other constants, according to recommendations and within the normative range given by IPCC [22]. The predicted biogas yields are used for calculating carbon grants which are an important part of the economic evaluation of the MSW treatment.
The IPCC decay model enables to estimate emissions of methane from solid waste disposal sites using the first order decay model [23].
Using this model degradable organic carbon can be calculated, and on this basis, the baseline GHG emissions from the untreated MSW are predicted. The model is formulated as follows:
 (1)
(1)
where t is the time in years,
 is the mass of degradable organic carbon at time t,
 at the start of the reaction, and k is the reaction constant [22].
We assume that 80% of the GHG emission would be abated due to the waste treatment plant. The abated emissions can be converted to CER’s (Carbon Emission Reduction) equivalent unit (CO2eq) used in the financial calculations of CDM.
Additional amount of CERs can be predicted due to emissions abated for the electricity generation by fossil fuel. The plant in Matadi will begin with producing 14 thousand of kWth of electricity. The needed grid emission factor can be calculated from the data published by major producers of electricity in African countries [24]. According to this publication, there was 224.7 million tons of CO2 emissions related to sales of 218,591 GWh in 2010 by this company. It allows calculating a grid emission factor as follows:  (tCO2e/kWh). The value of CERs is determined in the international carbon finance bazaar. In the period studied, the price fluctuated around 13 US$/ton CO2eq.
In [25] several different waste emissions quantification methods are compared. The methods based on IPCC 2006 guidelines were found to be more appropriate for inventorying applications.
2.5. Evaluation of MSW Treatment Plant
To evaluate the MSW treatment plant the following tasks should be performed: choosing the technology, agreement upon the tipping fee payment by the municipality to the plant owner, key data assumptions, prediction of the CERs, business planning of the plant. Characteristics of technologies considered for the plant differ by investment, economic profitability, sources of waste that can be treated, process safety and environmental aspects.
After choosing the technology the following parameters are determined and submitted to the municipality: tipping fee for MSW treatment within the plant borders, expected CERs for the predicted amount of MSW, initial amount and period of the MSW accumulation before the operation of the treatment plant, the appropriate range of service, investment requirements for the chosen range of service, local abilities and infrastructure.
The following key data are used:
the price of electricity is 0.1 US$/kW (2010), a number of citizens included in the service range of MSW collection is 750,000 people, area per bin A is 100 thousand m2.
The collected data enable to prepare a business plan and forecast the economic performance of the plant. We used one of the widely accepted methods for evaluating investment projects based on the Internal Rate of Return (IRR) and derived from the discounted Cash Flow. Among other economic indices are Earnings Before Interest and Taxes (EBIT), and payback-period.
3. Results
3.1. Plan of Collection and Transportation of MSW in Matadi
The planning model (Figure 3) was used to calculate: 1) MSW generation and collection, number of bins, handcarts and needed trucks according to MSW amount; 2) cash flow and profitability of the MSW company. The logistics, storage, headquarters, control, operation and maintenance were derived from the model.
According to the model implementation, the handcart owner will collect the waste from the houses. Once the handcart is full, the worker disposes the waste content of the handcart into the bin. One handcart is operated by two workers. The company will hire approximately 240 employees, among them 220 drivers of handcarts, truck drivers, skilled and semiskilled labor.
The poor condition of access roads and the problematic topography conditions of Matadi dictate the size and number of bins and handcarts, type of trucks and the overall efficiency of collection. The compaction truck (Type A) evacuates Bins A. The platform truck (Type B) loads Bins B. Trucks of both types will evacuate the waste to the disposal site.
Calculation of MSW generation, needed trucks and equipment, capacity of bins, handcarts and trucks were done based on the key data of waste density, waste generation, on range service for bins, and on rate of waste collection (Tables 1 and 2).
Different fee values for collection and transportation of MSW were examined. The fee value of 15$ per household per year, for example, leads to 22% profitability and IRR equal to 29% along 8 years planning period. The sensitivity analysis shows how the lower fee worsens the payback and the NPV (Figure 4).
3.2. Estimated GHG Emissions
The waste will be accumulated during the first 3 - 4 years

Table 1. MSW generation, needed and purchased trucks and equipment in Matadi.

Table 2. Capacity of handcarts, bins, and trucks.
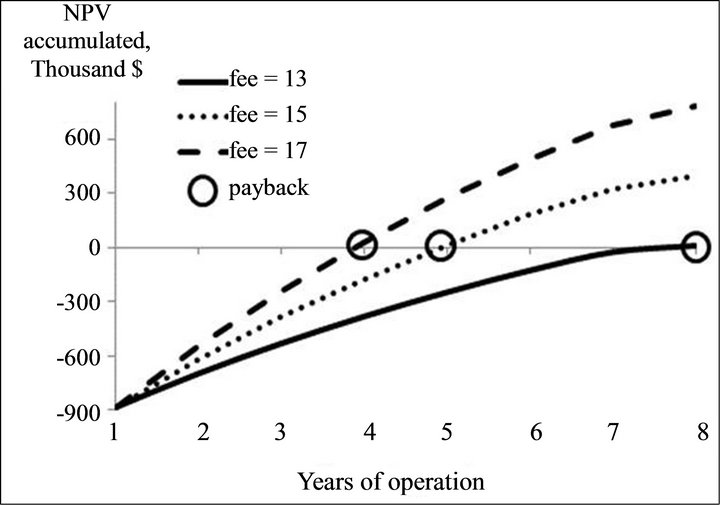
Figure 4. Profitability (in terms of NPV) of the MSW company as a function of waste collection fee.
in the disposal site. Consequently, the phase of land filling, capping and biogas extraction will start. For this period, the GHG emissions are predicted to change from 10 to 20 thousand CO2eq ton. A small fraction of Industrial origin waste and a high organic fraction in MSW explain the relatively large amount of recovered methane per 1 ton of MSW (Figure 5). The yearly amount of CERs grants revenues is predicted to increase from 125 to 225 thousand US$.
3.3. Profitability of MSW Treatment Plant
The anaerobic digestion technology was chosen for the establishment of an MSW treatment plant. The economic evaluation of the plant is based on the expanded range of service (50 km) in order to provide the sufficient amount of waste for the plant efficient operation—90 thousand ton of MSW per year. For anaerobic digestion technology, it will necessary to build a sorting facility. Due to the heavy unemployment in the city, it was decided to use hand sorting. According to the capacity of the sorting facility (approximately 320 tons of waste daily), 32 workers are needed for its operating. Each of them will work for 280 shifts yearly sorting 10 tons of waste during a shift.
We evaluate the plant using a few major financial indices: IRR, payback period, profitability on income, and

Figure 5. MSW disposal and GHG emission Reduction projected for Matadi.
profitability on investment (ROI). The planning horizon is assumed 10 years. The first two years of the evaluation period are for planning, erection, and startup. The sources of revenues are as follows: green electricity sales to the grid (65%), tipping fee payments from the municipality—5 $/ton (19%), and CERs grants (16%). The above revenue sources are specific for a MSW treatment plant. Payback period and IRR evaluated without CERs grants are less attractive for a possible investment (Table 3). The main financial risk is the prices fall. Environmental benefits are added values for the community and life standard.
4. Conclusion and Discussion
In this article, we provide the key models for comprehensive planning of collection, transportation, and MSW treatment plant in Matadi. The city of Matadi is a representative case applicable for other low-income cities in Africa where the budget for municipal services is scanty. Under these circumstances, private companies can play an important role in MSW management. Indirect evidence of this notion can be found in the article [26] where waste paper recovery is analyzed. The authors conclude that in addition to policy impacts, this sector of waste management is affected largely by economic factors such as prices and costs.

Table 3. Highlights of the MSW treatment plant evaluation.
The methods used in this study can assist other lowincome cities in the solution of waste problem, particularly when starting from a very low or even zero level of MSW management. To ensure successful results and high performance the following tools and methods were used:
• The spreadsheet model aimed at planning collection and transportation of MSW with a minimal budget. The model enabled to calculate the investment, the fee for MSW collection and transportation, and logistic and economic characteristics.
• CDM tools and methodologies were used for predicting carbon credit grants allowing for the economic evaluation of the MSW treatment plant. We found that CERs grants were essential for the plant’s profitability and comprised 16% of the revenue. This is in line with the conclusion in the study [27] that mechanical biological treatment of waste becomes more financially attractive if established through the CDM process.
• The economic evaluation of the MSW treatment plant based on the anaerobic digestion technology enabled determining the tipping fee for MSW treatment paid by the municipality.
Topographic difficulties inflicted on collection efficiency in Matadi. Future work on improvement of MSW collection and transportation in Matadi has to include improving roads for better accessibility for vehicles, handcarts and trucks for waste collection.
The experience of the presented case study shows that the general approach for MSW management in low-income cities has to consider economic evaluation based on the joined phases of collection and transportation and MSW treatment as one project. The first phase of collection and transportation is necessary but cannot stand alone due to economic aspects and environmental regulations.
The important reason for the plant projected profitability is expansion of service range of the MSW collection from 25 to 50 km. This is possible due to the neighboring city of Boma. The second reason is a high enough collection fee as shown in the sensitivity analysis. As for demand for the electricity produced in the plant, in the present energy situation in the DRC using landfill gas can become a viable source of energy [28]. Other factors of profitability are low expenses, particularly, low salaries and taxes. On the other hand, the sold electricity price and tipping fee for MSW treatment paid by the municipality are low comparing the developed countries practice. The payback period is long (10 years including 2 years of erection and running) because of the high investment costs of the imported equipment.
5. Acknowledgements
The authors wish to thank the Government of the province Congo Central, the DRC, which initiated this research. We are grateful to Dr. Zinaida Zugman for her helpful advice on models used in this article.
REFERENCES
- E. Friedrich and C. Trois, “Quantification of Greenhouse Gas Emissions from Waste Management Processes for Municipalities—A Comparative Review Focusing on Africa,” Waste Management, Vol. 31, No. 7, 2011, pp. 1585- 1596. doi:10.1016/j.wasman.2011.02.028
- T. Karak, R. M. Bhagat and P. Bhattacharyya, “Municipal Solid Waste Generation, Composition, and Management: The World Scenario,” Critical Reviews in Environmental Science and Technology, Vol. 42, No. 15, 2012, pp. 1509- 1630. doi:10.1080/10643389.2011.569871
- OECD, “Municipal Waste,” In: OECD, Ed., OECD Factbook 2010: Economic, Environmental and Social Statistics, OECD Publishing, 2010, pp. 172-173.
- D. C. Wilson, L. Rodic, A. Scheinberg, C. A. Velis and G. Alabaster, “Comparative Analysis of Solid Waste Management in 20 Cities,” Waste Management and Research, Vol. 30, No. 3, 2012, pp. 237-254. doi:10.1177/0734242X12437569
- World Development Indicators, “The World Bank,” 2012. http://data.worldbank.org/data-catalog
- A. Coynel, P. Seyler, H. Etcheber, M. Meybeck and D. Orange, “Spatial and Seasonal Dynamics of Total Suspended Sediment and Organic Carbon Species in the Congo River,” Global Biogeochemistry Cycles, Vol. 19, No. 4, 2005. doi:10.1029/2004GB002335
- A. Abel, “An Analysis of Solid Waste Generation in a Traditional African City: The Example of Ogbomoso, Nigeria,” Environment and Urbaniztion, Vol. 19, No. 2, 2007, pp. 527-537. doi:10.1177/0956247807082834
- R. Oyoo, R. Leemans and A. P. J. Mol, “Future Projections of Urban Waste Flows and Their Impacts in African Metropolises Cities,” International Journal of Environment Research, Vol. 5, No. 3, 2011, pp. 705-724.
- N. Regassa, R. D. Sundaraa and B. B. Seboka, “Challenges and Opportunities in Municipal Solid Waste Management: The Case of Addis Ababa City, Central Ethiopia”, Journal of Human Ecology, Vol. 33, No. 3, 2011, pp. 179-190.
- M. Coffey and A. Coad, “Collection of Municipal Solid Waste in Developing Countries,” 2nd Edition, UN-Habitat, Nairobi, 2010.
- C. Ezeah and C. Roberts, “Analysis of Barriers and Success Factors Affecting the Adoption of Sustainable Management of Municipal Solid Waste in Nigeria,” Journal of Environment Management, Vol. 103, 2012, pp. 9-14. doi:10.1016/j.jenvman.2012.02.027
- A. Scheinberg, D. C. Wilson and L. Rodic, “Solid Waste Management in the World’s Cities,” 3rd Edition, UNHabitat’s State of Water and Sanitation in the World’s Cities Series, Earthscan for UN-Habitat, London and Washington DC, 2010.
- S. Cointreau-Levine and A. Coad, “Guidance Pack on Private Sector Participation in Municipal Solid Waste Management,” SKAT, St. Gallen, 2000.
- A. K. Yahaya and O. S. Ebenezer, “Challenges of Privatizing Waste Management in the in Wa Municipality of Ghana: A Case of Zoomlion Ghana Limited,” Journal of Environment and Earth Science, Vol. 2, No. 11, 2012, pp. 68-79.
- M. Oteng-Ababio, J. E. Melara Arguello and O. Gabbay, “Solid Waste Management in African Cities: Sorting the Facts from the Fads in Accra, Ghana,” Habitat International, Vol. 39, 2013, pp. 96-104. doi:10.1016/j.habitatint.2012.10.010
- L. Parrot, J. Sotamenou and B. K. Dia, “Municipal Solid Waste Management in Africa: Strategies and Livelihoods in Yaoundé, Cameroon,” Waste Management, Vol. 29, No. 2, 2009, pp. 986-995. doi:10.1016/j.wasman.2008.05.005
- C. Collivignarelli, M. Vaccari, V. Di Bella and D. Giardina, “Techno-Economic Evaluation for the Improvement of MSW Collection in Somaliland and Puntland,” Waste Management and Research, Vol. 29, No. 5, 2011, pp. 521-531. doi:10.1177/0734242X10384431
- N. D. Dixon and R. V. Jones, “Engineering Properties of Municipal Solid Waste,” Geotextiles and Geomembranes, Vol. 23, No. 3, 2005, pp. 205-233. doi:10.1016/j.geotexmem.2004.11.002
- P. A. Vesilind and W. A. Worrell, “Solid Waste Engineering,” 2nd Edition, Cengage Learning, Stamford, 2011.
- K. R. Reddy, J. Gangathulasi, H. Hettiarachchi and J. Bogner, “Geotechnical Properties of Municipal Solid Waste Subjected to Leachate Recirculation,” In: M. V. Khire, A. N. Alshawabkeh and K. R. Reddy, Eds., GeoCongress: Geotechnics of Waste Management and Remediation (GSP 177), American Society of Civil Engineers 2008, pp. 144-151.
- B. Seng, H. Kaneko, K. Hirayama and K. KatayamaHirayama, “Municipal Solid Waste Management in Phnom Penh, Capital City of Cambodia,” Waste Management and Research, Vol. 29, No. 5, 2011, pp. 491-500. doi:10.1177/0734242X10380994
- Intergovernmental Panel on Climate Change, “Intergovernmental Panel on Climate Change Guidelines for National Greenhouse Gas Inventories,” IGES, Japan, 2006.
- X. F. Lou and J. Nair, “The Impact of Landfilling and Composting on Greenhouse Gas Emissions—A Review,” Bioresourse Technology, Vol. 100, No. 16, 2009, pp. 3792- 3798. doi:10.1016/j.biortech.2008.12.006
- Eskom, “Integrated Report 2010: On the Path to Recovery,” 2013. www.eskom.co.za
- E. A. Mohareb, H. L. MacLean and C. A. Kennedy, “Greenhouse Gas Emissions from Waste Management—Assessment of Quantification Methods,” Journal of the Air and Waste Management Association, Vol. 61, No. 5, 2011, pp. 480-493. doi:10.3155/1047-3289.61.5.480
- C. Berglund and P. Soderholm, “An Econometric Analysis of Global Waste Paper Recovery and Utilization,” Environmental and Resource Economics, Vol. 26, No. 3, 2003, pp. 429-456. doi:10.1023/B:EARE.0000003595.60196.a9
- R. Couth and C. Trois, “Sustainable Waste Management in Africa through CDM Projects,” Waste Management, Vol. 32, No. 11, 2012, pp. 2115-2125. doi:10.1016/j.wasman.2012.02.022
- W. N. Mbav, G. Coppez, S. Chowdhury and S. P. Chowdhury, “Energy Production from Landfill Gases in African Countries,” Power System Technology (POWERCON), 2010 International Conference, 24-28 October 2010, pp. 1-8.
- J. Okot-Okumu and R. Nyenje, “Municipal Solid Waste Management under Decentralisation in Uganda,” Habitat International, Vol. 35, No. 4, 2011, pp. 537-543. doi:10.1016/j.habitatint.2011.03.003
- J. N. Fobil, N. A. Armah, J. N. Hogarh and D. Carboo, “The Influence of Institutions and organisations on Urban Waste Collection Systems: An Analysis of Waste Collection System in Accra, Ghana (1985-2000),” Journal of Environmental Management, Vol. 86, No. 1, 2008, pp. 262-271. doi:10.1016/j.jenvman.2006.12.038
- S. Kathiravale and M. N. Muhd Yunus, “Waste to Wealth,” Asia Europe Journal, Vol. 6, No. 2, 2008, pp. 359-371. doi:10.1007/s10308-008-0179-x
- J. O. Babayemi and K. T. Dauda, “Evaluation of Solid Waste Generation, Categories and Disposal Options in Developing Countries: A Case Study of Nigeria,” Journal of Applied Sciences & Environmental Management, Vol. 13, No. 3, 2009, pp. 83-88.
- A. M. Mshandete and W. Parawira, “Biogas Technology Research in Selected Sub-Saharan African Countries—A Review,” African Journal of Biotechnology, Vol. 8, No. 2, 2009, pp. 116-125.
- T. Getahun, E. Mengistie, A. Haddis, F. Wasie, E. Alemayehu, D. Dadi, T. Van Gerven and B. Van der Bruggen, “Municipal Solid Waste Generation in Growing Urban Areas in Africa: Current Practices and Relation to Socioeconomic Factors in Jimma, Ethiopia,” Environmental Monitoring and Assessment, Vol. 184, No. 10, 2011, pp. 6337-6345. doi:10.1007/s10661-011-2423-x
Appendix A
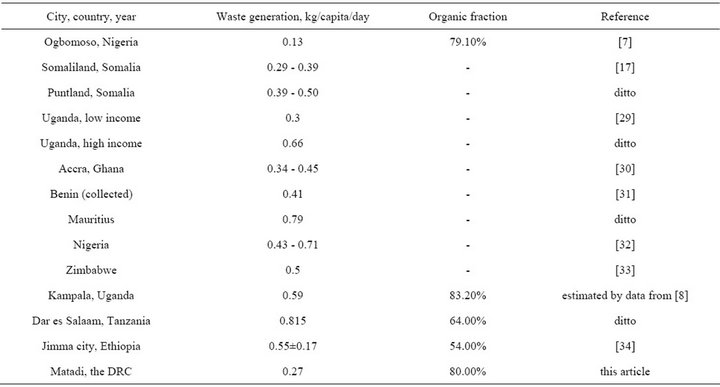
Table 4. Waste production per capita in African cities compared to Matadi.
Appendix B. Highlights of the Planning Model for MSW Collection and Transportation
NOTES
*Corresponding author.