Atmospheric and Climate Sciences
Vol.4 No.3(2014), Article ID:48162,27 pages
DOI:10.4236/acs.2014.43040
Minimum and Maximum Temperature Trends in Congo-Brazzaville: 1932-2010
Gaston Samba*, Dominique Nganga
Centre de Recherches et d’Études sur l’Environnement (CR2E), Université Marien Ngouabi, Brazzaville, République du Congo
Email: *cree.ensumng@gmail.com
Copyright © 2014 by authors and Scientific Research Publishing Inc.
This work is licensed under the Creative Commons Attribution International License (CC BY).
http://creativecommons.org/licenses/by/4.0/


Received 1 April 2014; revised 1 May 2014; accepted 30 May 2014
ABSTRACT
Maximum and minimum temperatures time series of Congo-Brazzaville are analyzed for trend and discontinuities over the period 1932 to 2010. Temperatures series show an irregular increase. A total of 8 synoptic stations show positive trends in their annual mean maximum temperature series, and 7 of them are significant, with higher trends for urban stations. Annual mean minimum temperature showed 6 stations having positive trends. This increase is in relation with observations at regional scale. However, the differences are observed between large towns (Brazzaville and Pointe-Noire), and small or rural towns (Dolisie, Sibiti, Impfondo, Djambala). Trends in diurnal temperature range (DTR) are large positive trends in maximum temperature that are mainly observed in cities. The curve of DTR shows a decreasing trend which indicates the increasing of minimum temperatures. The effects of urbanization on temperature trends are investigated. Most stations regarded as urban stations are still useful for trend analysis; being situated on the suburban of the studied cities, they are therefore, not substantially influenced by the urban heat island.
Keywords: Congo Republic, Temperatures Maximum and Minimum, Temperature Trends

1. Introduction
This study assesses trends of minimum and maximum temperature in the Congo-Brazzaville from 1932 to 2010, a period for which reliable temperatures database are available. A large number of studies documented climate variations and changes across the 20th century in West Africa, e.g., [1] -[7] , Southern Africa, e.g., [8] [9] and Eastern Africa, e.g., [10] -[14] . Mpounza et al. [15] have shown a rise of temperature of about 1˚C in Brazzaville for the period 1960-1990, with values ranging from 0.6˚C to 1.6˚C across the rest of the country. Studies on minimum and maximum temperature trends in the Congo basin forest are scare [16] ; they concern all the Africa countries [17] -[21] and give an indication of evolutions of the Congo-Brazzaville temperatures of the last half of 20th century. This study compares the different data of urban and non-urban stations. We examine the effect of urbanization on temperature trends. It is important to conduct an assessment of the severity of urban contamination of climate data, especially when assessments of the historical variability and changes of climate are made. The effect of urbanization on the minimum and maximum temperature trends was investigated for the urban stations by comparing their trends with those of non-urban stations. According to IPCC [22] , the global warming is a reality. It would be caused by natural variability and accented by anthropogenic activities [18] [23] -[25] . It is important to be informed and regularly updated on observed regional temperature trends. These results also can be obtained by using the climate model studies, which in turn will assist with planning for agricultural development.
The climate variables (temperature, rainfall, insolation, wind, etc.) are important components on agriculture development process. The rural economy in Congo relies essentially on agriculture, which in turn depends on weather and climate. In the same way climate components (e.g., air temperatures) play an important role in the water balance for the crops. However, successful agriculture yield requires suitable combinations of various factors like soil, crop, water, regime of temperature, etc. Therefore climate plays a crucial role in the growth and production of crops. It is then important to know the influence of climate parameters on plant growth and agriculture yield. The aim of analysing climate components (e.g., air temperatures) is to understand the effect of climate factors on agriculture. This analysis can provide global trend on temperature to detect the period of drought, during which air temperatures play a crucial role. The air temperature is the most important weather parameters because of physical and chemical for evolution within plants. Each crop has its own lethal maximum, minimum limits and the optimum temperature for its normal growth and reproduction.
The aim of this paper is to identify fluctuations and possible changes (trends or abrupt shifts) in the air temperature series across the country on annual and seasonal scales. In particular, one will examine whether the warming trend found in some parts of the region since the 1970s or 1980s in previous studies [19] [26] has continued in the 1990s. The spatial distribution of the temperatures variations and changes will also be discussed, with the aim to assess the role played by regional and local geographic factors and anthropogenic activities.
The Section 1 is the introduction; data have been presented and average temperature in Section 2. In Section 3, we describe the methods used. In Section 4, we describe the temperatures trends. The Section 5 is reserved for the discussion of the different resultants. In conclusion, we examine some environments impacts of the area study.
2. Data
The data used in this study come from the archives of the “Direction Météorologie Nationale” of Congo-Brazzaville. These dataset are extracted from the database of the Centre de Recherche et d’Etude sur l’Environnement (CR2E) of the Marien Ngouabi University. The database concerns the temperature of the air on a monthly time scale, from 1932 to 2010 of thirteen synoptic stations (Figure 1, Table 1). The station time-series are unfortunately characterized by missing data. The data series of each station were scrutinized for possible moves and changes of instruments. After deleting the stations with missing data, a total of 12 synoptic stations remained that had sufficiently complete datasets, and which were deemed to not have moved substantially to influence the homogeneity of their time series. Most meteorological stations have incurred no site far-reaching changes during the period under study (Table 1). The station of Brazzaville was relocated in 1966, Djambala in 1957, Loubomo in 1957 and Makoua in 1956 and in 1963.
3. Statistical Methods
We examine the monthly temperature of 12 synoptic stations. Descriptive statistics for the annual and seasonal maximum and minimum temperature for the 12 stations are given in Table1 The trends were determined for annual and seasonal maximum and minimum temperature time series. In order to smooth out high frequency variations (i.e., isolated years with exceptionally high or low temperature), five-year moving averages have been computed.

Table 1. Stations used their altitude and statistical parameters (mean temperatures minimum and maximum) over the period 1932-2010.

Figure 1. Locations of the 13 synoptic stations in Congo-Brazzaville used in the study.
Temperatures are transformed in absolute temperatures before their analysis. The annual and seasonal mean absolute temperatures at each station are standardized to obtain the annual and seasonal mean temperatures anomalies according to the relation:
 (1)
(1)
where xij is the monthly or annual mean absolute temperatures for the station i in the year j, xi, the mean monthly or annual mean absolute temperatures for station i, and σi the standard deviation of annual totals.
Standardized time-series climate were used by many authors such as [27] -[29] , to document interannual mean temperature variability. In this study, we also used the Expression (1) to depict the annual regime (Figure 2). This method was used to reduce the local climatic peculiarities. The normalized series are then averaged spatially.
The 12 synoptic stations were subjected to two non-parametric Mann-Kendall and Pettitt
tests to detecting trends and abrupt changes in time-series over the period 1932-2010.
The principles of this test have been largely described by Sneyers [30] and Vandiepenbeeck [31]
. In the Mann-Kendall test, for each element
 of a series y of length n, ni is the number of elements j which precede
i (i > j) such as xi > xj. The trend statistic t of the test
is computed as follows:
of a series y of length n, ni is the number of elements j which precede
i (i > j) such as xi > xj. The trend statistic t of the test
is computed as follows:
 (2)
(2)
The distribution of t, under the null hypothesis, is practically a normal distribution with the average and the variance given by the following Expressions (3) and (4):
 (3) and
 (4)
(4)
The reduced statistics of the test, given by , is thus compared to a normal distribution law.

Figure 2. Average monthly temperatures in the Congo-Brazzaville expressed in normalized anomalies (over 1932-2010).
 (5)
(5)
The null hypothesis can, therefore, be rejected for high values of , this being the probability α1 of
rejecting the null hypothesis when it is derived by a standard normal distribution
table:
, this being the probability α1 of
rejecting the null hypothesis when it is derived by a standard normal distribution
table:

The Mann-Kendall test consists in calculating two series of statistical values,
one from the beginning of the series, another from the end; these series are shown
in the form of two curves called respectively the direct curve (ui) and
the retrograde curve ( ). The trend is significant when the curve ui
exceeds 5% of threshold or level
). The trend is significant when the curve ui
exceeds 5% of threshold or level
 > 1.96. Sneyers [30] demonstrated the usefulness
of this test, using its direct progressive and retrograde forms, for identifying
the intervals in which trends are most pronounced, and trend turning points and/or
climate shifts. The point which marks the beginning of the change corresponds to
the intersection of direct (ui) and retrograde (
> 1.96. Sneyers [30] demonstrated the usefulness
of this test, using its direct progressive and retrograde forms, for identifying
the intervals in which trends are most pronounced, and trend turning points and/or
climate shifts. The point which marks the beginning of the change corresponds to
the intersection of direct (ui) and retrograde ( ) curve. Graphically, the retrograde and direct
curves are often confused when there is no significant trend in the series. When
values of
) curve. Graphically, the retrograde and direct
curves are often confused when there is no significant trend in the series. When
values of
 are significant, one concludes to a rising or decreasing trend, for
 > 0 or
 < 0, respectively.
Another Figure of instability of the series results from an abrupt change of the series. This can put out by means of the test of Pettitt [32] applied by Démarée [33] , Vanistsem and Démarée [34] , Coops [35] of which the hypothesis does not consist of the equality of the averages of two sub-series from the initial series.
We consider xi, i = 1, 2, …, n, the terms of a continuous chronological series. For every t, t = 1, 2, …, n, we calculate the statistics:
Utn = 2Wt – t(n+1) with
 where Rj is the rank of the element xj in the series lined
un increasing order.
where Rj is the rank of the element xj in the series lined
un increasing order.
Under the no hypothesis of the unpredictable character, the Wt are distributed according to a normal law with average and variance as:
 (6) and
 (7)
(7)
The probability UE associated with the statistics is given by:

when we calculate the various statistics utn for t from 1 to n we can, in this series, look for the extreme values of utn. The critical value at the level of α = 0.05 is given by:

The value of t such as
 > Uc is the estimation of a change. This change is in the increasing
or decreasing sense as UE < 0 or UE > 0. The application of
the test in the sub-series delimited to the point t can determine the stability
of the sub-series.
> Uc is the estimation of a change. This change is in the increasing
or decreasing sense as UE < 0 or UE > 0. The application of
the test in the sub-series delimited to the point t can determine the stability
of the sub-series.
Different sub-periods from 1932 to 2010 were compared to examine if there was any change in temperature trends throughout the period of investigation. A change was detected and dated. A comparison between the two sub-periods was carried out using the t-test (8). Trends are indicated to be significant in the discussions of results. It is only when the “t”-test is significant that the shift in the average climate is validated. In the t-test, if we suppose that two sub-samples are different the observed difference between the averages of two sub-samples is significant.
Here is the analytical expression of “t”-test:
 (8)
(8)
where
 and
and
 are the average of the first and second sub-samples, respectively;
 and
and
 the size of the first and second sub-samples;
 and
and
 the standard-deviations of the first and second sub-sample and
 , the degree of freedom. t follows a Student
distribution.
, the degree of freedom. t follows a Student
distribution.
Next section relating to the results our analyses are about on the determination of the trends.
4. Results
4.1. Average Monthly Temperatures
Our analyses of monthly trends of all stations point out large temporal differences in trends between months for individual stations. The monthly minimum and maximum temperatures average have been standardized and plotted for every station (Figure 2). The standardized monthly temperatures averages were used to study regime in Congo-Brazzaville. The main minimum and maximum temperatures average regimes of Congo-Brazzaville are displayed as a standardized monthly minimum and maximum temperatures average for every station (Figure 2). All stations are characterized by a bimodal regime; most of them show two peaks which are associated to three-month periods of March to May (MAM) and September to November (SON).
Figure 2 shows the monthly minimum and maximum temperatures spatial variability. This variability is characterized by a discontinuity of higher (red colour) or lower (blue colour) of the monthly temperatures in the inter-station. The monthly trends of each station were plotted and investigated after standardized monthly values. Figure 2 points out that stations in the same vicinity presented, similar monthly differences, similar increases and decreases in trend from one month to another, as well as monthly minimum and maximum trend.
4.2. Variability Times Series of Mean Annual Maximum and Minimum Temperatures
Figure 3 shows standardized time series of mean annual minimum and maximum temperatures at different stations. It again shows, time series plots of the annual mean annual minimum and maximum temperatures evolution over the Congo-Brazzaville. By linking anomalies and 5-years moving average we determine different periods of the mean annual minimum and maximum temperatures evolution. Most of stations of Congo-Brazzaville recorded mean annual minimum temperatures series with majority of negative anomalies during the 1930s, 1950s and 1960s. The decade 1950 shows a majority of negative anomalies. The 1970s, 1980s, 1990s and 2000s are characterized by mean annual minimum and maximum temperatures excess on the whole country. The 1980s and 1990s knew the most important mean annual maximum positives anomalies temperatures. The transition between positive and negative anomalies decades is not uniform on the whole country. It appears either at the end of the 1960s, or during the 1970s for means annual minimum temperatures. The evolution of the mean annual minimum temperatures in Brazzaville is predominant, although there are important positive abnormalities during the 1990s. The increase annual temperatures begin at minimum temperatures of the 1960s, or during the 1970s before maximum temperatures after 1980s, 1990s.
The southern Congo-Brazzaville shows consecutive year periods with positives anomalies during the last year, whereas the northern have shown non-persistent mean annual minimum and maximum temperatures since the late 1970s. The major warming covered the whole Congo-Brazzaville. During the two last decades 1990s and 2000s, the mean annual minimum and maximum temperatures in all regions were above average.
The season DJF is characterized by the warm months in major stations of Congo-Brazzaville. The time series of the DJF mean seasonal minimum and maximum temperatures (Figure 4) shows evolution characterized by alternating negative the decades 1950s and 1960s and positive anomalies the decades 1980s and 1990s. However, we note some peculiarities in the evolution of the minimum and maximum temperatures by the lower positive anomalies that appear during the 1980s.
The season MAM is the period with higher warming months in the annual cycle at all stations over the country. It’s the first warming peak over annual. The time series of the MAM mean seasonal minimum temperatures (Figure 5) shows the same temperatures evolution associated with every station that is characterized by negative and positive anomalies. Not peculiarities exist over the evolution of the temperatures between stations.
The time series of the JJA mean seasonal minimum temperatures (Figure 6) show the same temperatures evolution with positive anomalies in all stations during the decades 1950s and 1960s, and the 1980s and 1990s. On this season JJA the particularities is the minimum temperatures increases.
The SON season constituted the second peak of warming months. The minimum and maximum temperatures evolutions show a predominance of the positive anomalies during the last two decades (Figure 7).


Figure 3. Standardized time series of mean annual minimum and maximum temperatures (bars) and 5-year moving averages (lines) with coefficient of variation over the period.


Figure 4. Standardized time series of mean seasonal DJF minimum and maximum temperatures (bars) and 5-year moving averages (lines) with coefficient of variation over the period.


Figure 5. Standardized time series of mean seasonal MAM minimum and maximum temperatures (bars) and 5-year moving averages (lines) with coefficient of variation over the period.


Figure 6. Standardized time series of mean seasonal JJA minimum and maximum temperatures (bars) and 5-year moving averages (lines) with coefficient of variation over the period.


Figure 7. Standardized time series of mean seasonal SON minimum and maximum temperatures (bars) and 5-year moving averages (lines) with coefficient of variation over the period.
With regard to what precedes, the evolution of the mean minimum and maximum temperatures is recorded in different ways over the country. This evolution is marked by predominance of the positive anomalies over the two last decades in the second half of the 20th century and the start decade for 21st century.
4.3. Trends and Changes in the Mean Annual Maximum and Minimum Temperatures
The non-parametric tests Mann-Kendall and Pettitt applied on the annual maximum and minimum temperatures series data showed an increase over major stations in Congo-Brazzaville (Figure 8). The Figure 8 shows an increasing trend of the temperatures series of the 12 stations. The results of the study showed spatial variability and indicate general warming over the study area (Figure 8). At national level, maximum and minimum temperatures showed a warming trend. Two warm phases were identified: the first was from the early in 1930s and late in 1940s, and the second was from the early in 1980s to the end of the period of study. All these studies, however, do not include the middle and the end of 1970s. From the middle to the end of 1990s, in general data showed a continued increase trend of the global temperatures. The Figure 8 points out the annual average minimum and maximum temperatures. Some other stations Brazzaville, Sibiti, Pointe-Noire… showed a positive trend, with 7 of them significant. The effects of urbanization likely affect the temperature trends of these stations because of their location especially Brazzaville, Pointe-Noire, Dolisie and Ouesso stations. From the results above, it is evident that there is a general predominance of the positive trend in the times-series, although not always significant, for the period 1970 to 2010 over Congo-Brazzaville.
It also is interesting to note that 5 of the stations showed significant positive trends. It is already established that most stations showed a significant increase in maximum and minimum annual temperature for the period 1932 to 2010, as shown in Figure 8.
Globally, the last decade of the 20th century was shown to be substantially warmer than previous decades. There is much difference between the trends for the two periods and the average trend for the latter last period which is slightly higher than for the former.

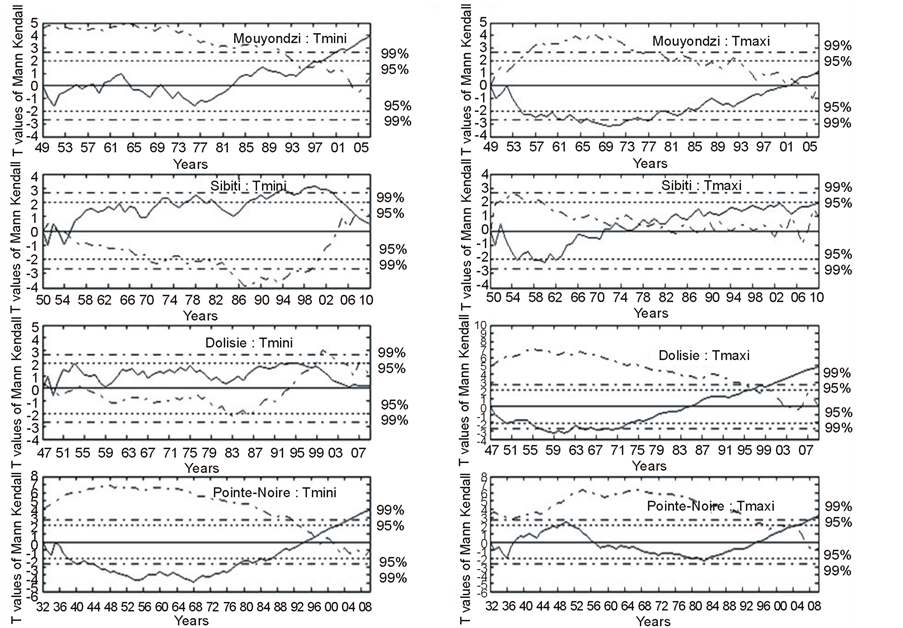
Figure 8. Trends in annual mean minimum and maximum temperature for the period 1932-2010 (significant trend at the 95% level).
We can conclude that there is gradual increase in annual mean temperature trends from 1960 to 2010. These results are consistent with those of Mpounza et al. [15] and Samba et al. [16] . A larger percentage of stations show significant increase trends which indicates a continuation of positive temperature trends for the decades 1980 and 1990. Those results obtained resemble with those of the global scale [35] .
To investigate if there was an abrupt increase in annual mean maximum and minimum temperatures on a shorter time scale. The time series was subject to a Student’s t-test for the differences in mean of annual mean temperatures between the period from 1932 to a specific year and the period after that year to 2010. The higher the absolute value of the test statistic, the larger the difference is deemed to be in mean temperature between the period before a specific year and the period after that year, for the number of years utilized for each period. The change in the t-test statistic is shown in Table 2 and Table3 If the trend in annual mean temperature stays more or less constant, and if there had been a gradual increase in temperature trend throughout the whole period from 1950 to 2010, then the graph would have shown a gradual decrease in the values of the time series of the t-test statistic, but this is not the case. From 1980, with some exceptions, there is, rather, an increase in the test statistic from year to year, indicating a change in trend.
Student’s test applied on two sub-samples allowed us to quantify the average difference in trends of mean annual temperatures, between the periods 1930 to 1970/1980 and 1980 to 2010 (Table 2, Table 3). The difference between the two averages of two sub-period for 1930 to 1970/1980 and 1980 to 2010 has an average annual maximum and minimum temperature of a trend of +0.2˚C and +1.4˚C for the 6 stations. Though in the same period some stations has an average temperature of a decrease trend between −0.2˚C and −1.5˚C (Table 2, Table 3).
Table 2. Test of Student on sub-periods defined by Mann-Kendall and Pettitt test; corresponding unlike Temperatures minimum between two sub-periods (over the period 1932-2010).
Table 3. Test of Student on sub-periods defined by Mann-Kendall and Pettitt test; corresponding unlike Temperatures maximum between two sub-periods (over the period 1932-2010).
Annual mean minimum temperatures know the first increase after period 1970 and after 1970 (between +0.2˚C and +1.4˚C). However, trends of annual mean minimum temperature showed clear and significant changes, for comparison with the results of this study. Maximum temperatures increased between +0.5˚C and +1.5˚C.
Temperatures increase is more important in urban (big Town) stations than non-urban (small Town). For urban stations the minimum temperatures have increase trend more +1.0˚C on average and for non-urban stations a trend of under +1.0˚C.
4.4. Trend Analysis Seasonal Minimum and Maximum Temperatures
The results of the above seasons are shown in Figure 9, Figure 10, Figure 11 and Figure 12 respectively for the season December to February (DJF), March to May (MAM), June to August (JJA) and September to November (SON). Those results indicate clearly the increase of temperature trends after 1970s with many nuances between season’s temperatures in stations.
The non-parametric Mann-Kendall trend test results, shows a significant trend in the seasonal minimum and maximum temperatures average in the Congo-Brazzaville over the period 1932-2010. The Figure 9, Figure 10, Figure 11 and Figure 12 related to seasonal minimum temperatures average in northern stations point out stable evolution (Ouesso, Impfondo) and show significant decreases. Those Figures give the graphical result of the Mann-Kendall trend test, indicating a significant decline in mean minimum temperatures from the 1940s, 1950s and 1960s. So, in the whole country we can identify two sub-periods: before (first period) and after (second period) the 1980s.
The first and second sub-periods correspond respectively to the temperature decrease and increase period. The seasonal temperatures decrease between two sub-periods reaching up to −0.2˚C at −1.2˚C. The seasonal temperatures from March to May in the southern stations point out significant increase (Pointe-Noire, Dolisie, Brazzaville); whereas the northern stations (Impfondo, Ouesso) show a decrease (Figure 9).

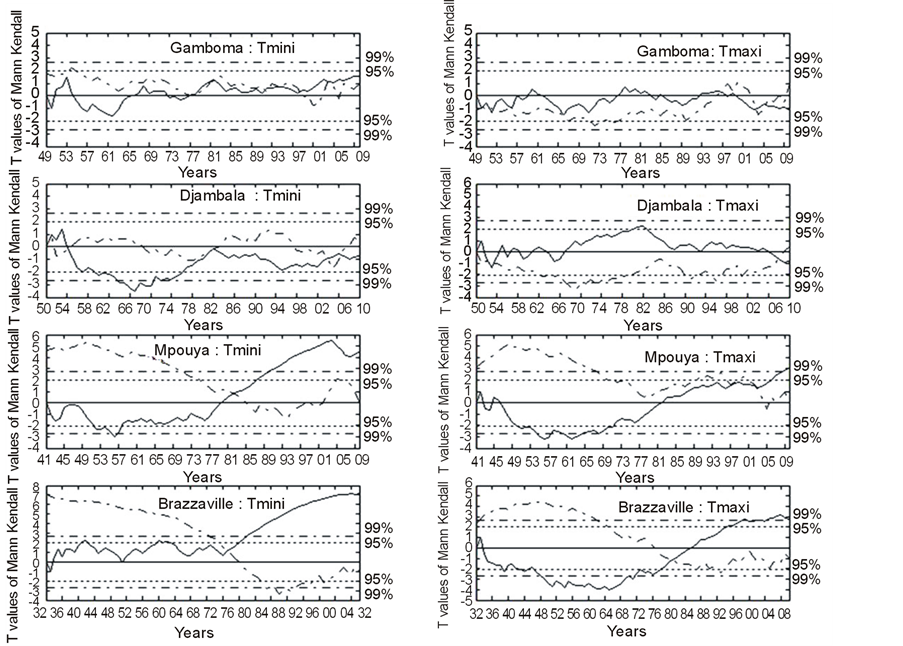

Figure 9. Trends in seasonal DJF mean minimum and maximum temperature for the period 1932-2010 (significant trend at the 95% level).


Figure 10. Trends in seasonal MAM mean minimum and maximum temperature for the period 1932-2010 (significant trend at the 95% level).
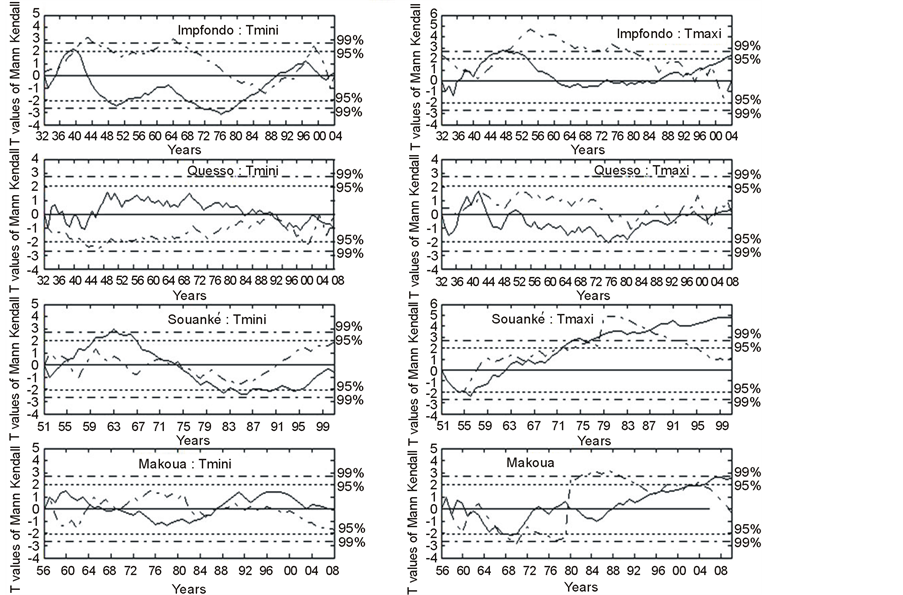


Figure 11. Trends in seasonal JJA mean minimum and maximum temperature for the period 1932-2010 (significant trend at the 95% level).
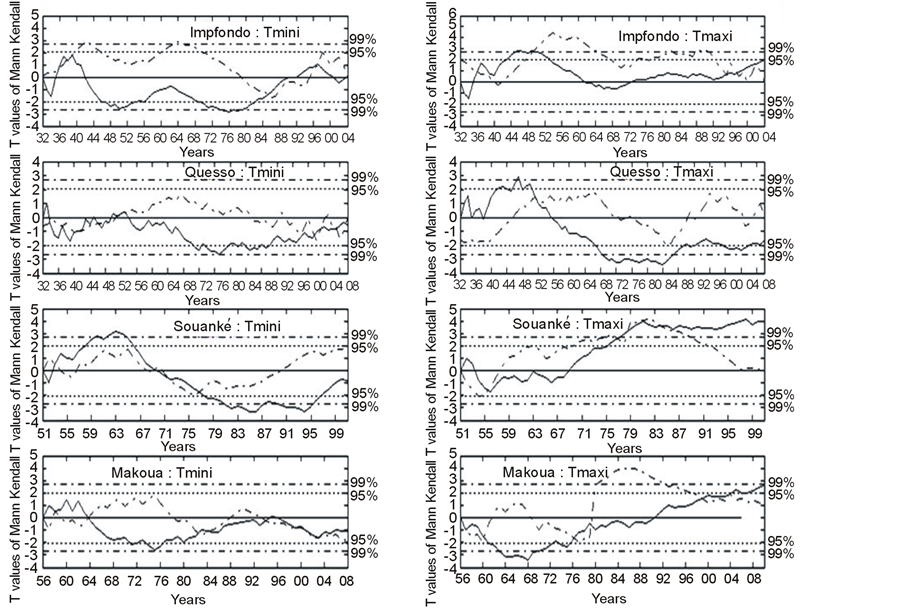


Figure 12. Trends in seasonal SON mean minimum and maximum temperature for the period 1932-2010 (significant trend at the 95% level).
From the t-test student the decline was compared between two sub-periods revealed by Mann-Kendall (Table 2, Table 3). The southern stations (e.g., Brazzaville) show a significant warming in the mean MAM seasonal minimum and maximum temperatures, from +1.0˚C to +1.2˚C. The mean MAM seasonal minimum and maximum temperatures in Dolisie increased from +1.1˚C and in Pointe-Noire it increased from +1.0˚C. We note an opposition of evolution of minimum and maximum temperatures at the annual scale and the level of the season MAM between the north and the south. This opposition of minimum and maximum temperatures is not observed for the season SON (Figure 12). Indeed, the majority of the stations show a significant increase of rains during the season SON.
4.5. Diurnal Temperature Range (DTR)
The global trend is for the DTR trend to be negative over the last half century due to the fact that, trends of minimum temperatures are higher than trends in maximum temperature (Figures 13-14). Four stations showed positive DTR trends, with five of them significant, and six stations showed negative trends. The stations in the southern showed high positive trends due in part to the high trends in annual mean maximum temperature, also because of the small negative trends in annual mean minimum temperatures for some of the stations. Other stations with the same tendency are situated in the northern, but their trends in DTR were much smaller, although significant for Mpouya station. Most some of these stations with negative or positive trends showed a substantial significant increase in minimum temperatures, whatever the trends in maximum temperatures. The results obtained are similar with those of the other studies on the in country Africa [36] or global scale [35] .
4.6. Effects of Urbanization on Temperature Trends
In this section we compare the temperature trends of the urban stations with the rest of stations in small cities. The stations that knew substantial increase of urbanization in their vicinities during the study period are Brazzaville, Pointe-Noire and Dolisie. All these stations of big town knew an increase of the trends maximum and minimum temperatures more than +1.0˚C. Although, the stations in small towns in the forest zone (Sibiti, Impfondo, Makoua), show a increasing of trends trends maximum and minimum temperatures. By contrast, the trends maximum and minimum temperatures of Brazzaville, Pointe-Noire and Dolisie, differ strongly to other stations, which are located in the small towns. This is due certainly by the effect of urbanization. These stations show a significant increase in mean annual minimum temperature more than +1.0˚C compared with +0.2˚C to +0.7˚C, in the small city.
In the average annual minimum temperature trends, the urban stations (Brazzaville, Pointe-Noire) show, on average, a significant positive trend of +1.1˚C and +1.4˚C compared with a significant +0.4˚C or +0.6˚C for non-urban stations (Impfondo, Sibiti, Mouyondzi); for average annual maximum temperature trends is a significant +0.6˚C, at +1.1˚C (urban) compared with a significant more than +1.1˚C (non-urban).
By splitting urban stations and non-urban, in general the average minimum annual temperatures trends of urban stations showed more positive trend than non-urban stations. This means that there might be a strong increase in minimum temperatures compared with maximum temperatures for urban stations than the non-urban stations.
The reason for the difference in trends seems to be the increase of the mean minimum temperature for urban stations than the non-urban stations, although the differences in mean maximum temperature between urban and non-urban station also seem to play a role to a certain point.
5. Discussion and Conclusions
This study documents minimum and maximum temperature in Congo-Brazzaville, over the west part of Atlantic Equatorial Africa. The results obtained are similar with those of the other studies on the in country Africa [18] [20] [37] -[39] . Indeed, Congo-Brazzaville maximum and minimum temperatures trends, except some stations used in the study, showed significantly positive results in maximum and minimum temperatures trends. In all cases, maximum and minimum average annual temperatures time series show the evolution that coincides with the general trend of the average global time series. In most cases, they show positive trends on average during the last two decades. Those trends are like the ones obtained by Babatolu1 and Mühlenbruch-Tegen [38] , Rosenbluoeth [39] and Akinnubi [40] in the river Niger Basin (Nigeria). The small towns have shown increasing trends with maximum and minimum temperatures. Although less spacious, the republic of Congo react positively against global climate warming. Urban stations investigated show trends were substantially the same from


Figure 13. Diurnal temperature range (DTR) for the period 1932-2010 (significant trend at the 95% level).

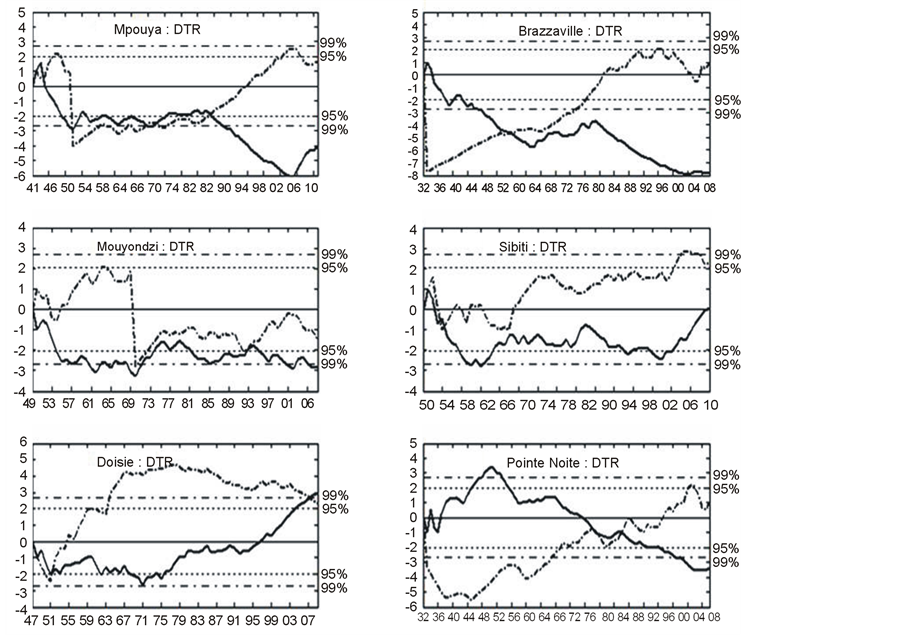
Figure 14. Trends diurnal temperature range (DTR) for the period 1932-2010 (significant trend at the 95% level).
those in the same non-urban stations. The maximum and minimum temperature evolution of Congo corresponds to that of the intertropical convergence zone (ITCZ) as published by the WMO. The years 80’s were less warm than the years 90’s. Nevertheless two periods clearly individualize the recent temperature evolution of Congo: before 1970 and after. The first period shows a temperature decrease or low temperatures. The second period is very uniform on the totality of the country and is marked by warmer temperatures. Trends in temperature range also show that results on a regional basis coincide with the general global trends, which have been positive over the last century [19] . Eventually, Congo has known a net trend of temperature between 1932 and 2010 with an increase of average temperatures +0.5˚C to 1˚C in the course of the last two decades. In sum, temperatures evolution in Republic of Congo is following the sameness to inter-tropical zone. The two last decades have been characterized by a warming climate after a long period of moderate temperatures. Although it is widely accepted that the maximum and minimum average temperatures for the 1990s were substantially warmer than preceding decades, trends in temperatures in Congo-Brazzaville have increased during the two last decade.
In this evolution of temperatures in Congo, there are urban zones which have known the most important warming, without any doubt linked to the phenomenon of urbanization. But the even generalized rising in weak urbanization zones seems to be a sign of sensitivity space of Congo to the global climate change.
However, there does not seem to be much spatial coherence in the results of temperature trends for other seasons. Temperature trends were also found not to be consistent between seasons, with MAM being the season of highest temperature trends on average and DJF being the season of lowest trends. DTR trends mean annual minimum and maximum temperature trends; many stations showed positive trends.
The conclusions are as follows:
• It is possible to establish a general increase of temperatures for all stations, and the annual temperature is characterised by a rise of temperatures quasi generalized to all stations; all series show a relative precipitation amount in the course of decades 1970 and 1990 compared to other decades. However, temperatures seem to begin a rise from the 1990s.
• It was found that there was rather a relatively increase minimum temperatures in the early 1970s, this being the main cause of the general increase average temperatures over the whole period from 1932 to 2010.
Acknowledgements
The authors wish to thank the Direction de la Météorologie nationale du Congo-Brazzaville for providing the data used in this study.
References
- Motha, R.P., Leduc, S., Steyeart, L.T., Sakamoto, C.M. and Strommen, N.O. (1980) Precipitations Patterns in West Africa. Monthly Weather Review, 108, 1567-1578. http://dx.doi.org/10.1175/1520-0493(1980)108<1567:PPIWA>2.0.CO;2
-
Janicot, S. (1992) Spatiotemporal Variability of West African Rainfall. Part 2:
Associated Surface and Air Mass Characteristics. Journal of Climate, 5, 499-511.
http://dx.doi.org/10.1175/1520-0442(1992)005<0499:SVOWAR>2.0.CO;2 - Janicot, S. and Fontaine, B. (1993) L’évolution des idées sur la variabilité interannuelle récente des précipitations en Afrique de l’Ouest. La Météorologie, Série XIII, 1, 28-51.
- Fontaine, B., Janicot, S. and Moron, V. (1995) Rainfall Anomaly Patterns
and Wind Field Signals over West Africa in August (1958-1989). Journal of Climate,
8, 1503-1510.
http://dx.doi.org/10.1175/1520-0442(1995)008<1503:RAPAWF>2.0.CO;2 -
Mahé, G., L’Hote, Y., and Olivry, J.C. (2001) Trends and Discontinuities in Regional
Rainfall of West and Central Africa: 1951-1989. Hydrological Sciences, 46, 211-226.
http://dx.doi.org/10.1080/02626660109492817 -
Nicholson, S.E., Dezfuli, A.K. and Klotter, D. (2012) A Two-Century Precipitation
Data Set for the Continent of Africa. Bulletin of the American Meteorological Society,
93, 1219-1231.
http://dx.doi.org/10.1175/BAMS-D-11-00212.1 - Nicholson, S.E. and Dezfuli, A.K. (2013) The Relationship of Rainfall Variability in Western Equatorial Africa to the Tropical Oceans and Atmospheric Circulation. Part I: The Boreal Spring. Journal of Climate, 26, 45-65. http://dx.doi.org/10.1175/JCLI-D-11-00653.1
- Mason, S.J. and Joubert, A.M.
(1997) Simulated Changes in Extremes Rainfall over Southern Africa. International
Journal of Climatology, 17, 291-301.
http://dx.doi.org/10.1002/(SICI)1097-0088(19970315)17:3<291::AID-JOC120>3.0.CO;2-1 - Richard, Y., Camberlin, P., Fauchereau, N. and Mulenga, H. (2001) Cohérence inter-saisonnière de la variabilité pluviométrique interannuelle en Afrique du Sud. L’Espace Géographique, 31, 63-72.
- Ogallo, L.J. (1988) Relationship between Seasonal Rainfall in East Africa and the Southern Oscillation. Journal of Climate, 8, 31-43. http://dx.doi.org/10.1002/joc.3370080104
- Beltrondo, G. and Camberlin, P.
(1993) International Variability of Rainfall in the Eastern Horn of Africa and indicators
of Atmospheric Circulation. Journal of Climate, 13, 533-546.
http://dx.doi.org/10.1002/joc.3370130505 -
Camberlin, P. (1997) Rainfall Anomalies in the Source Region Nile and Their Connection
with the Indian Summer Monsoon. Journal of Climate, 10, 1380-1392.
http://dx.doi.org/10.1175/1520-0442(1997)010<1380:RAITSR>2.0.CO;2 - Smakhtina, O. (1998) Historical Changes in Rainfall Pattern in the Eastern Cape Province, South Africa. Proceedings of International Conference on Water Resources Variability in Africa During the 20th Century, Cote d’Ivoire, 16-19 November 1998, 135-142.
- Mutai, C.C. and Ward, M.N. (2000) East African Rainfall and the Tropical
Circulation/Convection on Intraseasonal to Interannual Timescales. Journal of Climate,
13, 3915-3939.
http://dx.doi.org/10.1175/1520-0442(2000)013<3915:EARATT>2.0.CO;2 - Mpounza, M. Samba, G. Biona B.C. and Massouangui-Kifouala, M. (2003) L’évolution des températures dans le sud du Congo-Brazzaville (1950-1998). Publication de l’ Association Internationale de Climatologie, 15, 428-433.
- Samba, G., Nganga,
D. and Mpounza, M. (2008) Rainfall and Temperature Variations over Congo-Brazzaville
between 1950 and 1998. Theoretical and Applied Climatology, 91, 85-97.
http://link.springer.com/article/10.1007/s00704-007-0298-0 -
Hughes, S.H. and Balling, R.C. (1996) Urban Influences on South African Temperature
Trends. International Journal of Climatology, 16, 935-940.
http://dx.doi.org/10.1002/(SICI)1097-0088(199608)16:8<935::AID-JOC64>3.0.CO;2-V - Unganai, L.S. (1997) Surface Temperature Variation over Zimbabwe between 1897 and 1993. Theoretical and Applied Climatology, 56, 89-101. http://dx.doi.org/10.1007/BF00863786
- Hulme, M., Doherty, R., Ngara, T., New, M. and Lister, D. (2001) African Climate Change: 1900-2100. Climate Research, 17, 145-168 http://dx.doi.org/10.3354/cr017145
-
King’uyu, S.M., Ogallo, L.A. and Anyamba, E.K. (2000) Recent Trends of Minimum and
Maximum Surface Temperatures over Eastern Africa. Journal of Climate, 13, 2876-2886.
http://dx.doi.org/10.1175/1520-0442(2000)013<2876:RTOMAM>2.0.CO;2 - Kruger, A.C. and Shongwe, S. (2004) Temperature Trends in South Africa: 1960-2003. International Journal of Climatology, 24, 1929-1945. http://onlinelibrary.wiley.com/doi/10.1002/joc.1096/pdf
- IPCC (2007) Climate Change 2007: The Physical Science Basis. In: Solomon, S., Qin, D., Manning, M., Chen, Z., Marquis, M., Averyt, K.B., Tignor, M. and Miller, H.L., Eds., Contribution of Working Group I to the 4th Assessment Report of the Intergovernmental Panel on Climate Change of the Intergovernmental Panel of Climate Change, Cambridge University Press, Cambridge, 996 p.
- Kayane, I. (1960) Temperature Increase Due to the Expansion of Urban Area in Tokyo. Tenki, 7, 269-274.
- Sakakibara, Y. (1996) A Change of Air Temperature with Reurbanization in Tsukuda. Tenki, 43, 25-31.
- Sakakibara,
Y. and Owa, K. (2005) Urban-Rural Temperature Differences in Coastal Cities: Influence
of Rural Sites. International Journal of Climatology, 25, 811-820.
http://dx.doi.org/10.1002/joc.1180 - Hubbard, K.G. and Lin, X. (2002) Real-Time Data Filtering Models for Air Temperature Measurements. Geophysical Research Letters, 29, 671-674. http://dx.doi.org/10.1029/2001GL013191
- Kraus, E.B. (1977) Subtropical Droughts and Cross-Equatorial Energy Transports. Monthly Weather Review, 105, 1009-1018. http://dx.doi.org/10.1175/1520-0493(1977)105<1009:SDACEE>2.0.CO;2
-
Nicholson, S.E. (1986) The Spatial Coherence of African Rainfall Anomalies: Interhemispheric
Teleconnections. Journal of Climate and Applied Meteorology, 25, 1365-1381.
http://dx.doi.org/10.1175/1520-0450(1986)025<1365:TSCOAR>2.0.CO;2 - Osman, Y.Z. and Shamseldin, A.Y. (2002) Qualitative Rainfall Prediction Models for Central and Southern Sudan Using El Nino-Southern Oscillation and Indian Ocean Sea Surface Temperature Indices. International Journal of Climatology, 22, 1861-1878. http://dx.doi.org/10.1002/joc.860
- Sneyers, R. (1975) L’analyse statistique des séries d’observations. Note Technique, 143, OMM, No. 415, 192 p.
- Vandiepenbeeck, M. (1995) Détection pratique de changement de climat dans le cas d’une alternative au caractère aléatoire. Publication de l’Association Internationale de Climatologie, 8, 116-124
- Pettitt, A.N. (1979) A Nonparametric Approach to the Change-Point Problem. Applied Statistics, 28, 126-135. http://dx.doi.org/10.2307/2346729
- Demarée, G.R. (1990) Evidence of Abrupt Climate Change from the Rainfall Data of a Mauritanian Station. Institut Royal de Météorlogie Belgique, Publication, Série A, 124, 80 p.
- Vannitsem, S. and Demarée, G. (1991) Détection et modélisation des sécheresses au Sahel. Hydrologie Continentale, 6, 155-171.
- Coops, A.J. (1992) Analysis of Temperature Series in Europe in Relation
to the Detection of Enhanced Greenhouse Effect. Theoretical and Applied Climatology,
46, 89-98.
http://dx.doi.org/10.1007/BF00866088 -
Easterling, D., Horton, B., Jones, P.D., Peterson, T.C., Karl, T.R., Parker, D.E.,
Salinger, M.J., Razuvayev, V., Plummer, N., Jamason, P. and Folland, C.K. (1997)
Maximum and Minimum Temperature Trends for the Globe. Science, 277, 364-367.
http://dx.doi.org/10.1126/science.277.5324.364 -
Tshiala, M.F., Olwoch, J.M. and Engelbrecht, F.A. (2011) Analysis of Temperature
Trends over Limpopo Province, South Africa. Journal Geography and Geology, 3, 13-21.
http://dx.doi.org/10.5539/jgg.v3n1p13 - Mühlenbruch-Tegen, A. (1992) Long-Term Surface Temperature Variations in South Africa. South African Journal of Science, 88, 197-205.
- Rosenblüth, B., Fuenzalida, H.A.
and Aceituno, P. (1997) Recent Temperature Variations in Southern South America.
International Journal of Climatology, 17, 67-85.
ttp://dx.doi.org/10.1002/(SICI)1097-0088(199701)17:1<67::AID-JOC120>3.0.CO;2-G -
Babatolu, J.S. and Akinnubi, R.T. (2013) Surface Temperature Anomalies in the River
Niger Basin Development Authority Areas, Nigeria. Atmospheric and Climate Sciences,
3, 532-537.
http://dx.doi.org/10.4236/acs.2013.34056
NOTES

*Corresponding author.