International Journal of Geosciences
Vol.4 No.1A(2013), Article ID:27451,7 pages DOI:10.4236/ijg.2013.41A024
Intra-Seasonal Variability of Aerosols and Their Radiative Impacts on Sahel Climate during the Period 2000-2010 Using AERONET Data
1Laboratoire de Physique de l’atmosphère et de l’Océan Siméon Fongang, Université Cheikh Anta Diop, Dakar-Fann, Sénégal
2Laboratoire d’océanographie des Sciences de l’environnement et du Climat, UFR des Sciences et Technologies, Université de Ziguinchor, Ziguinchor, Sénégal
Email: *moctar1sn@yahoo.fr
Received October 7, 2012; revised November 6, 2012; accepted December 5, 2012
Keywords: AERONET; Aerosol Optical Depth; Radiative Forcing
ABSTRACT
This paper presents a study using in situ measurements (AERONET data) to characterize the intra-seasonal variability of aerosols and their shortwave radiative impacts on Sahel (11˚N - 18˚N and 20˚W - 15˚E) climate using a long time series (2000 to 2010) from AERONET data. We first used the MISR aerosol optical depth (AOD) averaged between 2000 and 2010 to identify dust maxima regions. They are mainly located over Eastern Mauritania-Northern Mali and Eastern Niger-Western Tchad (near the Bodele depression). Moreover the aerosol loading is stronger during the spring (MAM) and particularly during the summer (JJA). The analysis of AERONET data at 4 Sahelian stations (Dakar, Agoufou, Banizoumbou and Ouagadougou) shows that Sahel is under dust influence all year long. The dust season is mainly located between March and October, with two peaks of AOD recorded in March and June; while the maximum of biomass burning activity is recorded in winter (December to February). The radiative forcing of aerosols on the Sahelian climate results mainly in a cooling as well as at the surface than at the top of the atmosphere (TOA) but the forcing is stronger at the surface and particularly during the summer (JJA) and spring (MAM) periods. Although there is not a sharp difference between DJF and SON periods from a station to another one when considering the aerosol loading (AOD), the radiative forcing is stronger at the surface and weaker at the TOA during DJF for most stations. The analysis of the force effectiveness (ratio between AOD and the radiative forcing) suggests that the BOA radiative forcing is mainly influenced by the nature of aerosols.
1. Introduction
West Africa is the biggest dust and biomass burning smoke aerosol source of the world [1,2]. Massive dust plumes regularly propagate from the continent to the ocean and as far as Florida particularly during the summer in the so-called Saharan air Layer [3,4]. These mineral particles exert a strong influence on the radiative balance and the climate [5,6]. The years of rainfall deficits over West Africa are marked by anomalies in the dynamics of the monsoon system and mineral dust has kept increasing during drought years [7,8]. But the cause of this continuous dust increase is still unknown because it may be linked to the increase in wind intensity during dry years and/or a decrease in vegetation [9,10]. Several studies using short time and spatially limited observed data have been conducted to characterize these particles and their impacts on the regional climate. Mineral dust particles were investigated during the SHADE campaign over the West Africa, while their radiative effects were measured in the solar spectrum by ground-based measurements [11,12]). The particles found in [11] during field measurements were only dust with relatively low absorption properties. During the winter time, mixed particles composed of dust and biomasses burning are found by [13]. The properties of this mixture are very poorly documented [14,15].
The modeling approach has been used by some authors [16-18] to study aerosols spatio-temporal distribution and their impacts on the climate.
Despite these studies, the spatio-temporal distribution of aerosols and their radiative impacts on the climate is still an investigation topic.
A long time-series (2000-2010) of in-situ measurements (AERONET data) is used in this study to characterize and evaluate the aerosols properties and their impacts on climate over the Sahel considering 4 stations: Dakar (Senegal), Agoufou (Mali), Ouagadougou (Burkina-Faso) and Banizoumbou (Niger). These stations (particularly Dakar) are ideally placed to study the spatiotemporal distribution of coarse (mineral dust) and fine (biomass burning) particles over the Sahel. We present first the data and the methodology used. A seasonal characterization of aerosols properties at each station is performed considering the same period (2000-2010) in the second part. Finally, the shortwave radiative impact of aerosols is assessed.
2. Data and Methodology
2.1. Presentation of AERONET Network and Stations
The AErosol RObotic NETwork (AERONET) program is a federation of ground-based remote sensing aerosol networks established by the NASA and PHOTONS (University of Lille 1, CNES, and CNRS-INSU) and is greatly expanded by collaborators from national agencies, institutes, universities, individual scientists, and partners [19]. More than 200 instruments (photometers) were installed around the world. These instruments provide the spectral optical thickness and other parameters such as size distribution, the index of refraction and the Angstrom coefficient. These parameters are obtained from the results of inversion algorithm [20]. The Sahelian stations used in this study are displayed in Figure 1: Banizoumbou (Niger), Agoufou (Mali), Ouagadougou (Burkina Faso) and Dakar (Senegal).
The second dataset used is the Multi-Angle Imaging Spectro Radiometer (MISR) sensors aeronet optical depth [21] in the aim to characterize the regional scale coverage and maxima of aerosols.

Figure 1. Map of AERONET stations used in this study.
2.2. Methodology
Data used in this work are AERONET aerosol optical depth and radiative properties products (level 2) available on http://aeronet.gsfc.nasa.gov/file_help.html. The AOD is available at 532 nm which corresponds to the maximum of solar radiation. Other parameters such as the angstrom coefficient and single scattering albedo are derived from the spectral AOD. The aerosol optical properties retrieval algorithm is extensively described in [20] and [22]. The radiative properties of aerosol particles are calculated with the radiative transfer model of the Global Atmospheric Model—GAME [23,24].
3. Results and Discussions
3.1. Spatio-Temporal Distribution of the MISR Aerosol Optical Depth
Figure 2 shows the seasonal cycle of the AOD over West Africa from the sensor MISR averaged between 2000 and 2010. If we assume that aerosols maxima are closest to the source regions as in [25], sources of aerosols are mainly located over the Northern part of the Sahel—and over the Sahara; especially during the summer (JJA) and spring (MAM) periods. During JJA, dust sources are located at the border of Mauritania/Mali, southern Algeria and at the border of Niger-Tchad (near to the Bodele depression). The latter region has been identified as a major dust source by several studies [26,27]. During the spring, only the Sahel maxima are visible. These two sources are permanent features because they are active all year long. During MAM, a maximum is found off the West Africa which results from the low-levels transport by the Harmattan Winds. The maximum of biomass burning occurs in winter (DJF) and the maxima are mainly located over the Gulf of Guinea.
After diagnosing the aerosols maxima, we used the AERONET data to characterize their optical properties and radiative impacts over the Sahel.
Figure 3 shows the seasonal cycle of the AERONET aerosol loading (AOD) averaged between 2000 and 2010 for four AERONET stations at 532 nm. The concentration of aerosols is stronger in spring and summer with the peaks located in March and in June. The AOD is higher in March in Banizoumbou and Ouagadougou with respective values of 0.83 and 0.88; and during June for Dakar (AOD = 0.66) and Agoufou (AOD = 0.89). Table 1 summarizes the seasonal mean of AOD (550 nm) for considered AERONET stations during DJF, MAM, JJA and SON averaged between 2000 and 2010. Weaker values of AOD are recorded for all stations during DJF and SON compared to the spring (MAM) and summer (JJA) seasons. The maximum in JJA may be explain by the fact that during that period, strong African Easterly Waves (AEWs) and gravity density associated with me-

Figure 2. MISR seasonal (DJF, MAM, JJA and SON) aerosol optical depth (550 nm) averaged between 2000 and 2010 over West Africa. AERONET sites are denoted by gray circles in figure-d. The AOD is unitless.
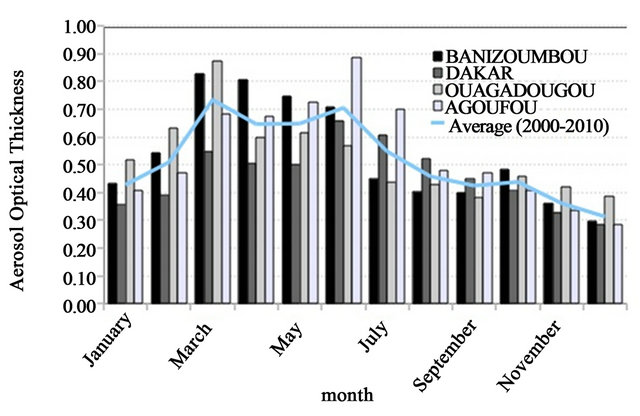
Figure 3. Histogram of the seasonal cycle of the aerosol optical thickness over the selected AERONET stations averaged between 2000 and 2010. The curve represents the monthly average of all stations The AOT is unitless.
soscale convective systems produce large dust event that are transported by air masses over West Africa and particularly over the Atlantic Ocean in the so-called Saharan air layer [28-30]. During that period (JJA), the aerosol loading is higher in Western stations (Dakar and Agoufou).
Table 1. The aerosol optical depth (AOD) averaged between 2000 and 2010 during DJF, MAM, JJA and SON for the considered AERONET stations. The AOD is unitless.

3.2. Types of Particles
Figures 4 and 5 show respectively the seasonal mean AERONET Angström coefficient and the single scattering albedo (SSA) averaged between 2000 and 2010 for the selected stations. The period located between March and June is characterized by the presence of large (small values of Angström coefficient) and scattering (strong values of single scattering albedo) particles that are the signature of mineral dust aerosols. From October to February, the absorption increases slightly (decrease of single scattering albedo); while the Angström coefficient values increase and reach values as high as 0.6 during December. These particles correspond to a mixture of dust and biomass burning as observed by [13] at Mbour station during the winter of 2006. During that period, fires are active in the Sub-Sahelian region of North Africa [31]. Overall, the single scattering albedo and Angstrom coefficient present roughly the same trend regardless the station with the predominance of large (dust) and diffusive particles during the spring and the summer and a mixture of dust and biomass burning aerosols especially during the winter period. When considering Mbour station, our conclusions are in line with [32] who found that this station is all year long under dust influence particularly during the summer period and sporadic biomass events during the winter of 2006.

Figure 4. Seasonal cycle of Angstrom coefficient averaged between 2000 and 2010 for the selected AERONET stations. The Angstrom coefficient is unitless.

Figure 5. Seasonal cycle of the Single Scattering Albedo averaged between 2000 and 2010 for the selected AERONET stations in Sahel. The SSA is unitless.
Figure 6 shows the seasonal cycle of the size distribution over considered AERONET stations. The size distribution is a classification of the number of particles per size. The distribution is bimodal for all stations with the predominance of the large mode (dust particles). The mean radius is approximately 2 µm. The maximum in size distribution is noted during the spring season (MarchApril-May) when considering all stations. Dust minimum is recorded in September-October-November (SON) for most stations. During DJF and SON, the small mode of the distribution increases with a radius located around 0.1 µm. This signature is related to biomass burning [13].
3.3. Shortwave Radiation Budget
Figures 7 and 8 present respectively the aerosol radiative forcing at the top of atmosphere (TOA) and at the bottom of the atmosphere (BOA). There is a general cooling trend in the Sahel due to the reflecting properties of dust particles; this is called the direct aerosol effect. The maximum cooling at the surface recorded during March and June is consistent with the maximum dust loading diagnosed during those months. The surface radiative forcing values range between −80 and −100 W/m²/day. The cooling is more pronounced at Agoufou and Ouagadougou stations with values as low as −120 W/m²/day during respectively June and March. After the JJA period, a reduction of the cooling is noted due to the decrease of dust loading over the region.
Table 2 summarizes the mean radiative forcing at the surface during DJF, MAM, JJA and SON. The radiative forcing is more important during the summer season (JJA) for Northern stations (Dakar and Agoufou); while the cooling is stronger during MAM for the Southern stations (Ouagadougou and Banizoumbou). Moreover, despite the fact that there is not a sharp difference when considering

Figure 6. Seasonal distribution of the size distribution versus the radius averaged between 2000-2010 at Banizoumbou, Agoufou, Dakar and Ouagadougou (DJF, MAM, JJA and SON). The size distribution is unitless.

Figure 7. Histogram of the radiative forcing at the bottom of the atmosphere (BOA) averaged between 2000 and 2010. The curve represents the monthly average of all stations. The BOA radiative forcing unit is W/m2.

Figure 8. Histogram of the radiative forcing at the top of the atmosphere (TOA) averaged between 2000 and 2010. The curve represents the monthly average of all stations. The TOA radiative forcing unit is W/m2.
Table 2. Radiative forcing at the bottom of the atmosphere (BOA) for the AERONET stations averaged between 2000 and 2010 during DJF, MAM, JJA and SON. The BOA radiative forcing unit is W/m2.

the aerosol loading between SON and DJF, the radiative cooling at the surface is stronger for all stations during DJF probably due to the presence of absorbing particles (biomass burning particles).
Due to the fact that the radiative forcing at the surface is mainly linked to the atmospheric aerosols loading and their nature (diffusive or absorbing particles), we calculated the forcing efficiency or force effectiveness (ratio of the BOA radiative forcing to the AOD); the result for the Sahel is displayed in Table 3. This parameter allows us to perform a sensitivity test based on the quantity (AOD) and nature of aerosols (or the single scattering albedo parameter). The absolute value of the forcing efficiency is weaker during the summer and the spring which are the aerosols loading and BOA radiative forcing maxima periods (Table 1). This result suggests that the main factor that impacts the BOA radiative forcing is the aerosol nature; diffusive particles tend to cool the surface more strongly than the absorbing ones.
At the top of the atmosphere, the cooling effect is present for most AERONET stations but this negative effect is less important than at the surface. The radiative forcing values are 10 W/m²/day (Agoufou) and −35 W/m²/day (Dakar) respectively in November and July. From November to February it decreases and reaches −20 W/m²/day (Figure 8). The station that is strongly affected by the cooling at the TOA is Dakar. The seasonal radiative forcing at the TOA is summarized in Table 3. The TOA radiative forcing is stronger in MAM for all stations except for Dakar where the cooling peaks during the summer period (JJA). When considering the average of all AERONET stations, the periods of maximum aerosol loading (MAM and JJA) present the strongest TOA shortwave radiative forcing. During these two periods (JJA and MAM), the Sahel region is primarily under mineral dust particles (scattering aerosols) which are known to have a negative direct radiative effect at the TOA [33,34].
4. Conclusions
This study dealt with the characterization of West African (especially the Sahel) aerosols properties and their impacts on the climate using a long temporal series of observations (AERONET data from 2000 to 2010). The first part was devoted to the intraseasonal variability of aerosols retrieved by MISR and 4 AERONET stations. The AOD maxima are recorded in spring (MAM) and summer (JJA) periods with values in excess of 0.79. AERONET data show that stronger AOD values associated with a weaker Angström coefficient and stronger values of single scattering albedo were recorded from March to September traducing the presence of a strong
Table 3. Seasonal evolution of the forcing efficiency (ratio between the BOA shortwave radiative forcing and the AOD) for the AERONET stations averaged between 2000 and 2010 during DJF, MAM, JJA and SON. The unit of the forcing efficiency is W/m2.

concentration of large and diffusive particles (mineral dust). The winter period is characterized by the presence of a mixture (dust and biomass burning aerosols) as diagnosed by [13]. The size distribution seasonal cycle confirms results from the Angstrom coefficient map; it shows that most particles have larger size (around 1.6 µm).
Radiative forcing calculated from the optical properties of aerosols showed a general cooling trend over the Sahel region. The shortwave radiative forcing is stronger during the dust season (MAM and JJA). During that season, the mean value of the radiative forcing is approximately −87.5 W/m²/day at the surface and −17 W/m²/day at the top of the atmosphere. From November to February, there is a decrease in the cooling trend due to the decrease in dust concentration and by the positive radiative forcing induced by the biomass burning which is known to have absorbing properties. This study also shows that with the same aerosol loading, the BOA radiative forcing is mainly affected by the nature of aerosols.
5. Acknowledgements
We thank the principal investigator of AERONET sites for the availability of AERONET data. Moctar Camara is supported by the University of Ziguinchor, Senegal and the ICTP associate program. Mamadou Drame is supported by UCAD.
REFERENCES
- S. Woodward, “Modeling the Atmospheric Life-Cycle and Radiative Impact of Mineral Dust in the Hadley Centre Climate Model,” Journal of Geophysical Research, Vol. 106, No. D16, 2001, pp. 18155-18166. doi:10.1029/2000JD900795
- T. C. Bond, D. G. Streets, K. F. Yarber, K. F. Nelson, S. M. J. H. Woo and Z. Klimont, “A Technology-Based Global Inventory of Black and Organic Carbon Emissions from Combustion,” Journal of Geophysical Research, Vol. 109, No. D14, 2004, p. D14203. doi:10.1029/2003JD003697
- G. A. D’Almeida, “A Model for Saharan Dust Transport,” Journal of Climate and Applied Meteorology, Vol. 25, No. 7, 1986, pp. 903-916. doi:10.1175/1520-0450(1986)025<0903:AMFSDT>2.0.CO;2
- M. Drame, G. S. Jenkins, M. Camara and M. Robjhon, “Observations and Simulation of a Saharan Air Layer Event with a Midtropospheric Dust Layer at Dakar, Senegal, 6-7 July 2010,” Journal of Geophysical Research, Vol. 116, 2010, p. D21204.
- X. Li, H. Maring, D. Savoie, K. Voss and J. Prospero, “Dominance of Mineral Dust in Aerosol Scattering in the North Atlantic Trade Winds,” Nature, Vol. 380, No. 6573, 1996, pp. 416-419. doi:10.1038/380416a0
- J. Huang, P. Minnis, H. Yan, Y. Yi, B. Chen, L. Zhang and Coauthors, “Dust Aerosol Effect on Semi-Arid Climate over Northwest China Detected from A-Train Satellite Measurements,” Atmospheric Chemistry Physics, Vol. 10, No. 14, 2010, pp. 6863-6872. doi:10.5194/acp-10-6863-2010
- J. Prospero, P. Ginoux, O. Torres and S. E. Nicholson, “Environmental Characterization of Global Sources of Atmospheric Soil Dust Derived from the NIMBUS-7 TOMS Absorbing Aerosol Product,” Reviews of Geophysics, Vol. 40, No. 1, 2002, pp. 2-1-2-31. doi:10.1029/2000RG000095
- M. Yoshioka N. Mahowald, A. Conley, W. Collins, D. Fillmore, C. Zender and D. Coleman, “Impact of Desert Dust Radiative Forcing on Sahel Precipitation: Relative Importance of Dust Compared to Sea Surface Temperature Variations, Vegetation Changes and Greenhouse Gas Warming,” Journal of Climate, Vol. 20, No. 8, 2007, pp. 1445-1467. doi:10.1175/JCLI4056.1
- J. K. Leenders, J. H. Boxel and G. Sterk, “The Effect of Single Vegetation Elements on Wind Speed and sediment Transport in the Sahelian zone of Burkina Faso. Earth Surface Processes and Landforms,” Vol. 32, No. 10, 2007, pp. 1454-1474. doi:10.1002/esp.1452
- J. K. Leenders, G. Sterk and J. H. Van Boxel, “Modelling Wind-Blown Sediment Transport around Single Vegetation Elements,” Earth Surface Processes and Landforms, Vol. 36, No. 9, 2011, pp. 1218-1229. doi:10.1002/esp.2147
- D. Tanré, J. Haywood, J. Pelon, J. Leon, B. Chatenet, P. Formenti, P. Francis, P. Goloub, E. J. Highwood and G. Myhre, “Measurement and Modeling of Saharan Dust Radiative Impact: Overview of the Saharan Dust Experiment (SHADE),” Journal of Geophysical Research, Vol. 108, No. D18, 2003. doi:10.1029/2002JD003273
- J. Haywood, S. Osborne, P. Francis, A. Keil, P. Formenti, M. Andrea and P. Kaye, “The Mean Physical and Optical Properties if Regional Haze Dominated by Biomass Burning Aerosol Measured from C-130 Aircraft during SAFARI 2000,” Journal of Geophysical Research, Vol. 108 No. D13, 2003. doi:10.1029/2002JD002226
- Y. Derimian, J. F. Léon, O. Dubovik, I. Chiapello, D. Tanré, A. Sinyuk, F. Auriol, T. Podvin, G. Brogniez and B. N. Holben, “Radiative Properties of Aerosol Mixture Observed during the Dry Season 2006 over M’Bour, Senegal (African Monsoon Multidisciplinary Analysis Campaign),” Journal of Geophysical Research, Vol. 113, No. D23, 2008.
- T. W. Kirchstetter, T. Novakov and P. V. Hobbs, “Evidence that the Spectral Dependence of Light Absorption by Aerosols is Affected by Organic Carbon,” Journal of Geophysical Research, Vol. 109, No. D21, 2004. doi:10.1029/2004JD004999
- M. O. Andreae and A. Gelencser, “Black Carbon or Brown Carbon? The Nature of Light Absorbing Carbonaceous Aerosols,” Atmospheric Chemistry Physics, Vol. 6, No. 10, 2006, pp. 3131-3148. doi:10.5194/acp-6-3131-2006
- G. Myhre, A. Grini, J. M. Haywood, F. Stordal, B. Chatenet, D. Tanré, J. K. Sundet and I. S. K. Isaksen, “Modeling the Radiative Impact of Mineral Dust during the Saharan Dust Experiment (SHADE) Campaign,” Journal of Geophysical Research, Vol. 108, No. D18, 2003. doi:10.1029/2002JD002566
- A. Konare, S. Zakey, F. Solmon, F. Giorgi, S. Rauscher, S. Ibrah and X. Bi, “A Regional Climate Modeling Study of the Effect of Desert Dust on the West African Monsoon,” Journal of Geophysical Research, Vol. 113, No. D12, 2008.
- M. Camara, G. S. Jenkins and A. Konare, “Impacts of Dust on West African Climate during 2005 and 2006,” Atmospheric Chemistry Physics Discussion, Vol. 10, No. 2, 2010, pp. 3053-3086. doi:10.5194/acpd-10-3053-2010
- B. Holben, T. Eck, I. Sluster, D. Tanre, J. Buis, A. Setzer and Coauthors, “AERONET-A Federated Instrument Network and Data Archive for Aerosol Characterization,” Remote Sensing Environment, Vol. 66, No. 1, 1998, pp. 1-16. doi:10.1016/S0034-4257(98)00031-5
- O. Dubovik and M. A. King, “Flexible Inversion Algorithm for Retrieval of Aerosol Optical Properties from Sun and Sky Radiance Measurement,” Journal of Geophysical Research, Vol. 105, No. D16, 2000, pp. 20673- 20696. doi:10.1029/2000JD900282
- D. J. Diner and Coauthors, “Multiangle Imaging SpectroRadiometer (MISR)-Instrument Description and Experiment Overview,” IEEE Trans Geoscience Remote Sensing, Vol. 36, No. 4, 1988, pp. 1072-1087.
- O. Dubovik, A. Sinyuk, T. Lapyonok, H. N. Holben, M. Mishchenko, P. Yang and Coauthors, “Application of Spheroid Models to Account for Aerosol Particle Nonsphericity in Remote Sensing of Desert Dust,” Journal of Geophysical Research, Vol. 111, No. D11, 2006. doi:10.1029/2005JD006619
- P. Dubuisson, J. C. Buriez and Y. Fouquart, “High Spectral Resolution Solar Radiative Transfer Absorbing and Scattering Media: Application to the Satellite Simulation,” Journal of Quantum Spectroscopy Radiative Transfer, Vol. 55, No. 1, 1996, pp. 103-126.
- P. Dubuisson, J. C. Roger, M. Mallet and O. Dubovik, “A Code to Compute the Direct Solar Radiative Forcing: Application to Anthropogenic Aerosols during the Escompte Experiment. International Radiation Symposium (IRS 2004) on Current Problems in Atmospheric Radiation,” Edited by H. Fischer, B.-J. Sohn and A. Deepak, Hampton, 2006, pp. 127-130.
- M. Legrand, C. N’Doume and I. Jankowiak, “SatelliteDerived Climatology of the Saharan Aerosol,” In: D. K. Lynch, Ed., Passive Infrared Remote Sensing of Clouds and the Atmosphere II, SPIE Proceeding, Vol. 2309, 1994, pp. 127-135.
- L. Herrmann, K. Stahr and R. Jahn, “The Importance of Source Region Identification and Their Properties for Soil-Derived Dust: The Case of Harmattan Dust Sources for Eastern West Africa,” Contributions to Atmospheric Physics, Vol. 72, No. 2, 1999, pp. 141-150.
- A. E. Kalu, “The African Dust Plume: Its Characteristics and Propagation across West Africa in Winter,” In C. Morales, Ed., Saharan Dust Mobilization Transport Deposit, SCOPE 14, John Wiley, 1979, pp. 95-118.
- P. Tulet, K. Crahan Kaku, M. Leriche, B. Aouizerats and S. Crumeyrolle, “Mixing of Dust Aerosols into a Mesoscale Convective System Generation, Filtering and Possible Feedbacks on Ice Anvils,” Atmospheric Research, Vol. 96, No. 2-3, 2010, pp. 302-314. doi:10.1016/j.atmosres.2009.09.011
- C. Flamant, et al., “Airborne Observations of the Impact of a Convective System on the Planetary Boundary Layer Thermodynamics and Aerosol Distribution in the Intertropical Discontinuity Region of the West African Monsoon, Quarterly Journal of Royal Meteorology Society, Vol. 133, No. 626, 2007, pp. 1175-1189. doi:10.1002/qj.97
- J. Haywood, J. Pelon, P. Formenti, et al., “Overview of the Dust and Biomass burning Experiment and African Monsoon Multidisciplinary Analysis Special Observing Period-0,” Journal of Geophysical Research, Vol. 113, No. D23, 2008. doi:10.1029/2008JD010077
- F. Léon Y. Derimian, I. Chiapello, D. Tanré, T. Podvin, B. Chatenet, A. Diallo and C. Deroo, “Aerosol Vertical Distribution and Optical Properties over M’Bour (16.96˚W; 14.39˚N), Senegal from 2006 to 2008,” Atmospheric Chemistry Physics, Vol. 9, No. 23, 2009, pp. 9249-9261. doi:10.5194/acp-9-9249-2009
- P. Chylek and J. Wong, “Effect of Absorbing Aerosol on Global Radiation Budget,” Geophysical Research Letters, Vol. 22, No. 8, 1995, pp. 929-931. doi:10.1029/95GL00800
- J. M. Haywood and K. P. Shine, “The Effect of Anthropogenic Sulfate and Soot Aerosol on the Clear Sky Planetary Radiation Budget,” Geophysical Research Letters, Vol. 22, No. 5, 1995, pp. 602-606. doi:10.1029/95GL00075
NOTES
*Corresponding author.