American Journal of Climate Change
Vol.2 No.1(2013), Article ID:29104,5 pages DOI:10.4236/ajcc.2013.21006
Exploring of Water Distillation by Single Solar Still Basins
1Mechanical Engineering Department, Damascus University, Damascus, Syria
2Mechanical Engineering Department, King Khalid University, Abha, Saudi Arabia
Email: gaalhassan@hotmail.com, algarni_salem@hotmail.com
Received October 30, 2012; revised December 1, 2012; accepted December 8, 2012
Keywords: Solar Still; Single Basin; Syria
ABSTRACT
The lack of potable water poses a big problem in Syria. The underground water, where exists, is usually brackish and cannot be used as it is for drinking purposes. Syria lies in high solar isolation band and the vast solar potential can be exploited to convert saline water to potable water. The most economical and easy way to accomplish this objective is using solar still. The purpose of the project is to evaluate the potential of using a solar still basin. To implement this goal three similarly solar still basins have been designed, manufactured and tested in selected day for saline water in month of November, 2010. Each solar still consists of insulated metal box with channels. Pyramidal glass covers attached to the basin at an angle (α = 45˚). The three basins have divided into three models (M1, M2 and M3). Before taking the measurement of the distilled water three different amount of water used, so for the (model M1) 3 liter of water, (model M2) 6 liter and (model M3) 9 liter, to study and evaluate the effect of water depth in the basin. The average daily output was found to be (3.924) liters/day for model (M1), (3.116) liters/day for model (M2) and 2.408 liters/day for model (M3) for basin area of 1 m2 based on data of selected day.
1. Introduction
One of the important and technically viable applications of solar energy is the distillation of seawater coastal areas and small islands, and brackish wells water in remote towns and villages. Such utilization of solar energy offers an almost cost-free alternative for supplying potable water, particularly for small communities in arid regions [1], which are characterized by low demand of water and abundant solar radiation [2,3]. This advantage is generally offset by the low productivity of commonly used solar stills. An early large-scale solar still was built in 1872 to supply a mining community in Chile with drinking water [4]. Therefore, extensive efforts have been carried out through numerous investigations to improve the efficiency of solar distillation process. Various approaches have been suggested to achieve such goal, either through improving designs of conventional stills, or developing unique designs through adjustment of stills operating parameters [5]. The methods, of solar water desalination are classified according to the way in which solar energy is used, given in [6]; also, other approaches were adapted in which connection of stills with assisting external systems or elements showed different degrees of improvement in the stills yield [7,8].
2. Design of the Solar Still
A schematic diagram of the designed solar still is shown in Figure 1. The actually fabricated solar still is shown in Figure 2. The basin area of the still is 0.25 m2, fabricated using galvanized iron sheet of 18 gauge thickness. The bottom and sides of the basin are insulated by 5 cm thick fiber-glass surrounded by a wooden frame of 5 cm thickness. The surface of the basin is painted black to absorb maximum solar radiations. On the inside rim of the basin two troughs have been fixed with each one extends along two sides of the basin. The main function of these troughs is to collect the distillated water falling from the glass cover which is fixed above the tray. Each trough is titled at a small to permit the distillated water to leave the stiller through water to a graded flask.
The function of the glass cover is to permit solar radiation to pass to the stiller and elevate the temperature of the hot water in the tray. This enhances the evaporation process of water in the basin, which will condense on the inner surface of the glass covers whose temperature is definitely lower than that of the water. Four used glass covers are used on the four sides of the tray. Each side is equilateral triangle. The four sides when assembled and contained in frame pyramid shape of the stiller as shown
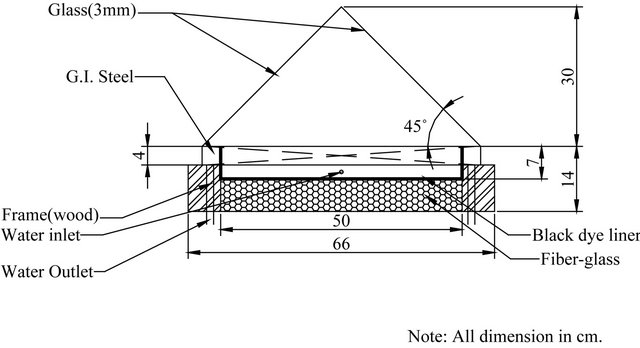
Figure 1. Schematic diagram of the designed single basin solar still (drawn not to scale).
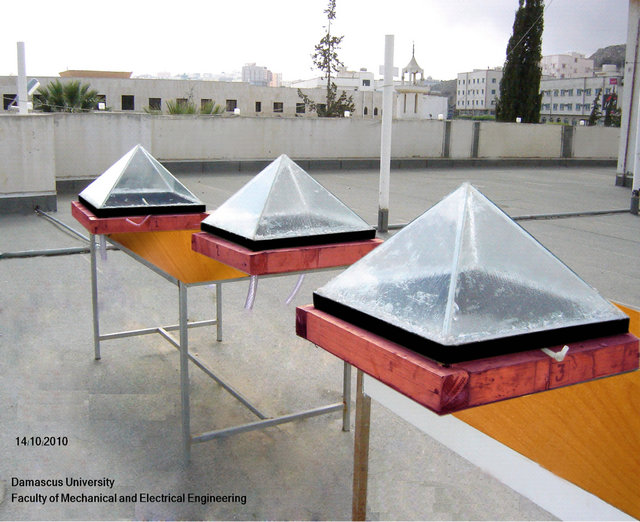
Figure 2. The fabricated solar still being tested in outdoor conditions.
in Figure 2. To evaluate the performance of the water distillation process, the ambient temperature is measured along with the hourly solar radiation and the amount of distillate. All measured parameters are recorded every hour starting from 6 a.m. to 5 p.m. daily.
3. Measurements and Results
Investigation of the proposed stills performance was carried out through measurements of different parameters for three solar stills contain different amount of water in each one. For the first still the amount of water was 3 liter and this still was marked M1 as model number one. The second still tested for 6 liter and named model M2 while the third one tested for 9 liter with a model name M3. The solar stills were tested outdoors at Damascus University-in Syria. The measured parameters concerning the distillation process are the hourly distillated quantity of water for each model. Also the ambient conditions of solar insulation and ambient temperature were recorded every hour over the day-light during the period of performance tests. The wind speed has been determined from the recorded official weather data for Damascus city. All these measured parameters have been used to evaluate the performance of these stills.The obtained results are presented and discussed below. The ambient temperature, the value of distillated water of the three models of the stills, the solar radiation and wind speed on selected day in the month of November 2010 are as following. Table 1 lists the measured hourly values of ambient temperature, amount of distillated water produced in these the stills, and solar radiation and wind
Table 1. Ambient temperature, distillated water, solar radiation and wind speed as function of time (on November 14, 2010).
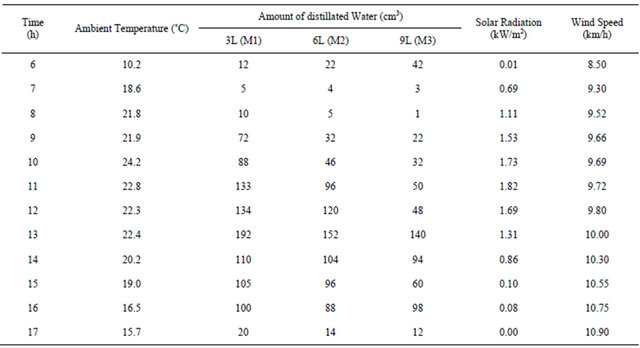
speed on November 14, 2010. The variation of these parameters along the day from (6 am) in the morning until the time of sunset is shown in Figures 3-7.
Figure 3 shows that ambient temperature increases with time until it reaches its maximum value around noon time then decrease gradually as shown in the figure.
Figure 4 shows that the solar radiation increases with time until reaching a maximum value around noon time.
After reaching its peak value, the solar radiation decreases with time until it diminishes near sunset as shown in the figure. The shape of solar insulation curve is very much similar to the expected theoretical curve by forecast for clear day except in afternoon around (3 p.m.) where some cloud might caused the depression at that time.
Figure 5 shows the variation of the wind speed during the day-light of November 14, 2010. It increases for (8 km/h) in the early morning up to (11 km/h) by the end of the day.
Figure 6 shows the variation of the hourly productiveity (amount of distillated water) along the day of November 14, 2010 for the three stills.
The figure indicates that the rate of hourly productivity for all stills increased with time until reaching a maximum value near noon time. The shape of the productivity curve is identical for the three models with high productivity for model with lower quantity for all times. Model M1 (3 liter) produce higher quantity of distillated water in compare with the other models. In the afternoon period, the hourly distillation rate decreases until reaching
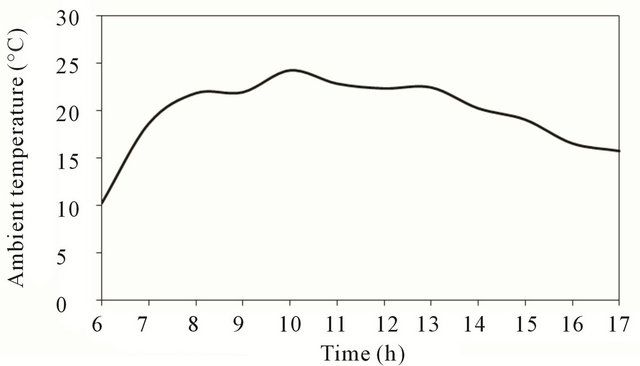
Figure 3. Ambient temperature at test location.
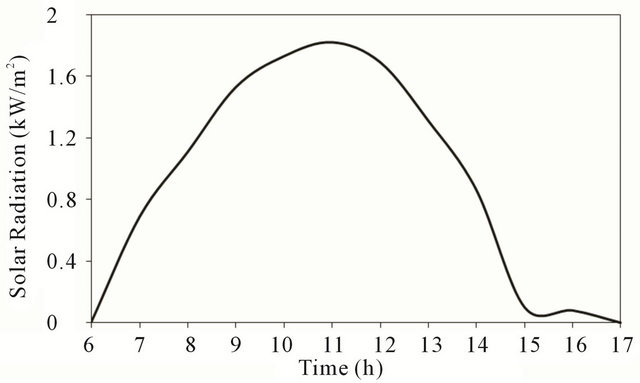
Figure 4. Solar radiation at test location.
its lowest value at sunset hour. The distillation process continued during the night because of the heat in the water, however the amount produced was very low. No measurement was taken of productivity during the night,
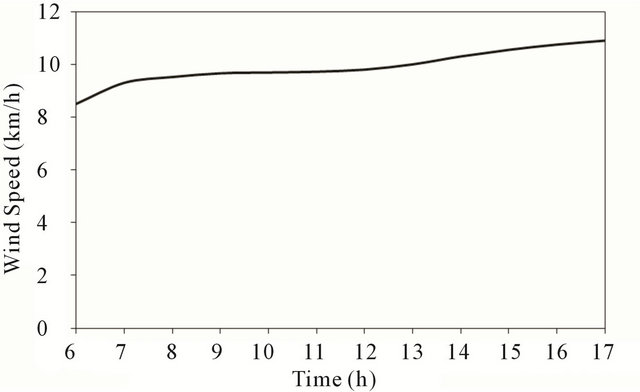
Figure 5. Wind speed at test location.
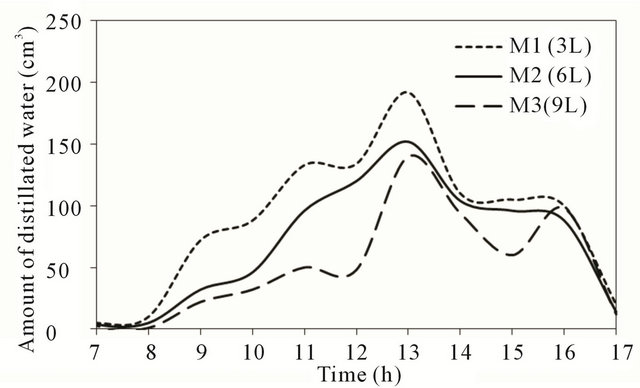
Figure 6. Distillated water at test location.
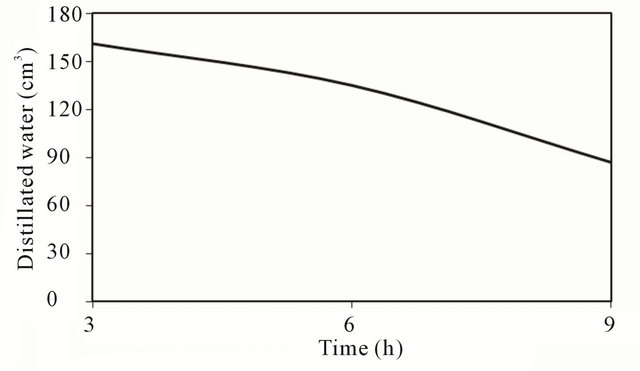
Figure 7. Accumulated quantity of distillated water.
only the accumulated quantity was recorded in the morning of the next day.
Comparison of the accumulated quantity of distillated water for the three models is shown in Figure 7. The figure indicates that the productivity decreases with the increase of quantity of water in the stills.
The higher the water temperature compared with layer quantity under same operating conditions, thus more evaporation and consequently higher productivity is expected stills with low quantity as the figure indicates. It is worth mentioning that there is a time along of about an hour between the peaky of hourly productivity and that of the solar radiation. This shift between the peak of productivity and solar radiation is attributed to the response of the system (time constant) due to its thermal capacity. Similar results were obtained on other days of (November 12 and 13, 2010). Therefore, the average daily output was found to be (3.924) liters/day for model (M1), (3.116) liters/day for model (M2) and 2.408 liters/day for model (M3) for basin area of 1 m2 based on data of selected days whereas the literature tells us that efficiently designed solar stills have daily output of the order of 4 liter/m2 in high insulations areas.
4. Desalinated Water Quality
Three parameters TDS, pH and conductivity were measured for just one sample before and after desalination process. The results are presented in Table 2.
According to WHO Guidelines for Drinking-water Quality, the palatability of water with a TDS level of less than 600 mg/liter is generally considered to be good; drinking water becomes significantly and increasingly unpalatable at TDS levels greater than about 1000 mg/ liter. The Presence of high levels of TDS may also be objectionable to consumers, owing to excessive scaling in water pipes, heaters, boilers and household appliances.
However WHO does not propose any health-based guideline value for TDS. The TDS values for tested sample after desalination fall well within the 600 mg/liter level. No health-based guideline value has been proposed by WHO for pH either. Although pH usually has no direct impact on consumers, it is one of the most important operational water quality parameters. The optimum pH required varies in different supplies according to the composition of the water and the nature of the construction materials used in the distribution system, but it is usually in the range 6.5 - 8 [9]. The pH of the samples after desalination is not far off from these values.
5. Conclusions
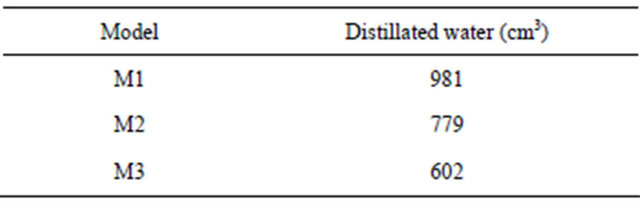
Three similar insulated stills basins were manufactured from metal attached to pyramidal glass with angle (α = 45˚) were evaluated and tested for saline water. To study the effect of the water depth in basin different amount of water has put inside the solar still. They are (3, 6 and 9 liter). The daily output for the previous mentioned variable is demonstrated in the following table (Table 3).
Finally, distillation of water using solar still basin is the most economical method to get portable drink water. The water that is made in these stills is of a better quality than bottled water because it is purified using the distillation process, and because the water is slowly evaporated instead of rapidly boiled, the water tastes sweeter due to the natural process. Contaminants such as salts, odor, heavy metals, bacteria, micro-organisms, sand, rust, fluoride etc. are completely removed in the distillation process. In area that is challenged with water problems, sev
Table 2. Tested water quality parameters.

Table 3. Daily output for the three tested solar still basins.
eral solar stills can be permanently placed for producing drinkable water. The solar stills are appropriate technology because they are site specific, use no electricity to run, require no running water to work, gets rid of contaminants, have a life expectancy of (20) years and are easy to use and maintain.
REFERENCES
- J. Lindblom, “Solar Thermal Technologies for Seawater Desalination: State of the Art,” Renewable Energy Systems, Lulea University of Technology, Lulea, 2010. http://energi.fysikk.uio.no/rebus/phd_2003/SOASeawater
- U. K. Mirza, M. M. Maroto-Valer and N. Ahmad, “Status and Outlook of Solar Energy Use in Pakistan,” Renewable and Sustainable Energy Reviews, Vol. 7, No. 6, 2003, pp. 501-514. doi:10.1016/j.rser.2003.06.002
- S. Kumar and R. A. Attalage, “Applications of solar thermal energy: Liquid Systems,” Asian Institute of Technology, Pathumthani, 2005. http://www.courses.ait.ac.th/ED06.22/course1/lecs/module3/m31o98.html
- Intermediate Technology Development Group, “Solar Distillation: Technical Brief,” The Schumacher Centre for Technology & Development, Rugby, 2005. http://www.itdg.org/docs/technical_information_service/ solar_distillation.pdf
- S. Aboul-Enein, A. A. El-Sebaii and E. El-Bialy, “Investigation of a Single-Basin Solar Still with Deep Basins,” Renewable Energy, Vol. 14, No. 1-4, 1998, pp. 299-305. doi:10.1016/S0960-1481(98)00081-0
- C. N. Harris, E. C. Miller and E. T. Irving, “Solar Energy Systems Design,” Wiley, New York, 1985.
- M. A. Samee, U. K. Mirza, T. Majeed and N. Ahmad, “Design and Performance of a Simple Single Basin Solar Still,” Renewable and Sustainable Energy Reviews, Vol. 11, No. 3, 2007, pp. 543-549. doi:10.1016/j.rser.2005.03.003
- Solar Humidification, 2005. http://www.serve.com/damien/home/solarweb/desal/solarstill.html
- World Health Organization, “Guidelines for DrinkingWater Quality, Recommendations,” Vol. 1, Geneva, 2004.