Paper Menu >>
Journal Menu >>
 International Journal of Geosciences, 2011, 2, 102-110 doi:10.4236/ijg.2011.22011 Published Online May 2011 (http://www.SciRP.org/journal/ijg) Copyright © 2011 SciRes. IJG Zonation and Prediction of Land Subsidence (Case Study-Kerman, Iran)* Seyed Mahmood VaeziNejad, Mohammad Mohsen Toufigh, Seyed Morteza Marandi Department of Civil Engineering, Bahonar University, Kerman, Iran E-mail: Mahmoodvn@gmail.com Received November 17, 2010; revised February 6, 2011; accepted March 12, 2011 Abstract Drought and Immethodical ground water withdrawal in recent years has caused numerous problems such as subsidence due to falling of subsurface water table, the reduction of water quality, etc. in cities across the world. This research as a case study deals with harmful effects of subsurface water withdrawal in the city of Kerman and practical monitoring of the subsidence and makes prediction of land subsidence. The artificial neural network has been used for modeling the monitored results and prediction of future subsidence. A sur- veying network with more than 500 installed benchmarks in an area of 334 square kilometer has been used to measure the subsidence of the city area. Benchmarks were installed in the beginning of 2004 and were mo- nitored at the end of 2004, 2006, and 2007. For modeling, extra data were obtained from Iranian Surveying Organization for the years before 2004. The resulting model showed that, the subsidence varies between zero and 15cm per year in different parts of the City, which depends on the subsurface-layered soils, their com- pressibility, and the manner of subsurface water withdrawal. Keywords: Land Subsidence Zonation, Subsurface Water Withdrawal, Artificial Neural Network, Subsidence Prediction 1. Introduction Land subsidence has cau sed many difficulties around the world. This phenomenon takes place by various factors such as ground settlement due to deformation and dis- placement of subsurface soil layers, ground water with- drawal, gas and petroleum withdrawal, subsurface exca- vations, mine exploitation, execution of heavy buildings and embankments, ground tectonic movement, dissolv- ing of lime layers etc. which arise from man’s interfe- rence in nature [1]. Anisotropic settlements have caused irretrievable damages such as ground fissure and cracks, destruction of structures, domestic installations, rail tracks etc. This phenomenon has also caused changes in slopes and heights of irrigation channels, irrigator and domestic sewage systems. In coastal areas even with isotropic set- tlements, water advancement may cause floodwater in the region. In recent years, some parts of the earth have expe- rienced the subsidence phenomenon due to subsurface water withdrawal. Barbarella et al. [2] r eported prob lems occurred in historical buildings of Bologna in Italy be- cause of 2 m subsidence for a period of 30 years. Holzer et al. [3], Metzger et al. [4], Sneed et al. [5], Gabrysch, [6] and Galloway et al. [7] studied problems associated with land subsidence in Texas, California, Arizona, Ne- vada etc. in the United States of America. Between 1955 and 1980, the land subsidence in some parts of Greece reached 3 to 4 meters [8]. In north part of China, for a period of thirty years, the subsurface water table fell down from eight to 50 m [9]. Phien-wej et al. [10] re- ported that, in the early years of 1980s, some parts of Thailand experienced land subsidence of 12 cm per year due to withdrawal of more than 120 million cubic meters of water per day. Zonation of subsidence phenomenon may control the planning and improvement of the negative effects and can be a proper method for subsidence prediction. For this purpose, the factors affecting earth subsidence such as subsurface cavity and holes, water quantity, subsur- face water level, and type and specification of subsurface layers must be determined. In addition to these factors, *The paper with the same title which was published in the Proceedings of EISOLS2010 was a short discussion and this paper is a complete version of the p a p er includes all contr i b u ti o n s an d w o rks. 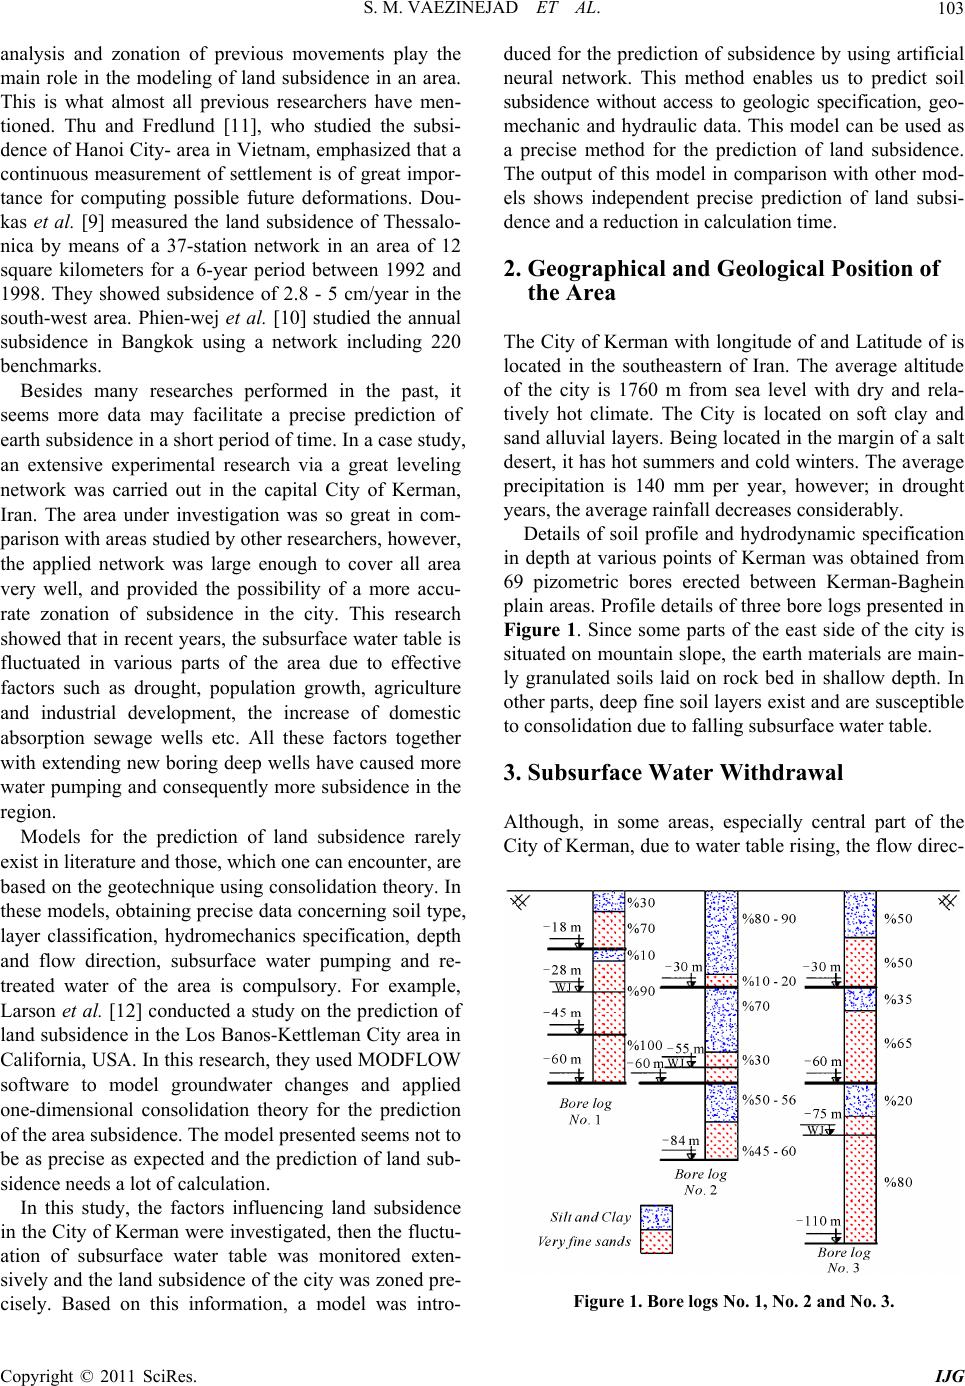 S. M. VAEZINEJAD ET AL. Copyright © 2011 SciRes. IJG 103 analysis and zonation of previous movements play the main role in the modeling of land subsidence in an area. This is what almost all previous researchers have men- tioned. Thu and Fredlund [11], who studied the subsi- dence of Hanoi City- area in Vietnam, emphasized that a continuous measurement of settlement is of great impor- tance for computing possible future deformations. Dou- kas et al. [9] measured the land subsidence of Thessalo- nica by means of a 37-station network in an area of 12 square kilometers for a 6-year period between 1992 and 1998. They showed subsidence of 2.8 - 5 cm/year in the south-west area. Phien-wej et al. [10] studied the annual subsidence in Bangkok using a network including 220 benchmarks. Besides many researches performed in the past, it seems more data may facilitate a precise prediction of earth subsidence in a short period of time. In a case study, an extensive experimental research via a great leveling network was carried out in the capital City of Kerman, Iran. The area under investigation was so great in com- parison with areas studied by other researchers, however, the applied network was large enough to cover all area very well, and provided the possibility of a more accu- rate zonation of subsidence in the city. This research showed that in recent years, the subsurface water table is fluctuated in various parts of the area due to effective factors such as drought, population growth, agriculture and industrial development, the increase of domestic absorption sewage wells etc. All these factors together with extending new boring deep wells have caused more water pumping and consequently more subsidence in the region. Models for the prediction of land subsidence rarely exist in literature and those, wh ich one can encounter, are based on the geotechnique using consolidation theory. In these models, obtaining precise data concerning soil type, layer classification, hydromechanics specification, depth and flow direction, subsurface water pumping and re- treated water of the area is compulsory. For example, Larson et al. [12] conducted a study on the prediction of land subsiden ce in the Los Banos-Kettleman City area in California, USA. In this research, they used MODFLOW software to model groundwater changes and applied one-dimensional consolidation theory for the prediction of the area subsidence. The model presented seems not to be as precise as expected and the prediction of land sub- sidence needs a lot of calculation. In this study, the factors influencing land subsidence in the City of Kerman were investigated, then th e fluctu- ation of subsurface water table was monitored exten- sively and the land subsidence of the city was zoned pre- cisely. Based on this information, a model was intro- duced for the prediction of subsidence by using artificial neural network. This method enables us to predict soil subsidence without access to geologic specification, geo- mechanic and hydraulic data. This model can be used as a precise method for the prediction of land subsidence. The output of this model in comparison with other mod- els shows independent precise prediction of land subsi- dence and a reduction in calculation time. 2. Geographical and Geological Position of the Area The City of Kerman with longitude of and Latitude of is located in the southeastern of Iran. The average altitude of the city is 1760 m from sea level with dry and rela- tively hot climate. The City is located on soft clay and sand alluvial layers. Being located in th e margin of a salt desert, it has hot summers and cold winters. The average precipitation is 140 mm per year, however; in drought years, the average rainfall decreases co nsiderably. Details of soil profile and hydrodynamic specification in depth at various points of Kerman was obtained from 69 pizometric bores erected between Kerman-Baghein plain areas. Profile details of three bore logs presented in Figure 1. Since some parts of the east side of the city is situated on mountain slope, the earth materials are main- ly granulated soils laid on rock bed in shallow depth. In other parts, deep fine soil layers exist and are susceptible to consolidation due to falling subsurface water table. 3. Subsurface Water Withdrawal Although, in some areas, especially central part of the City of Kerman, due to water table rising, the flow direc- Figure 1. Bore logs No. 1, No. 2 and No. 3. 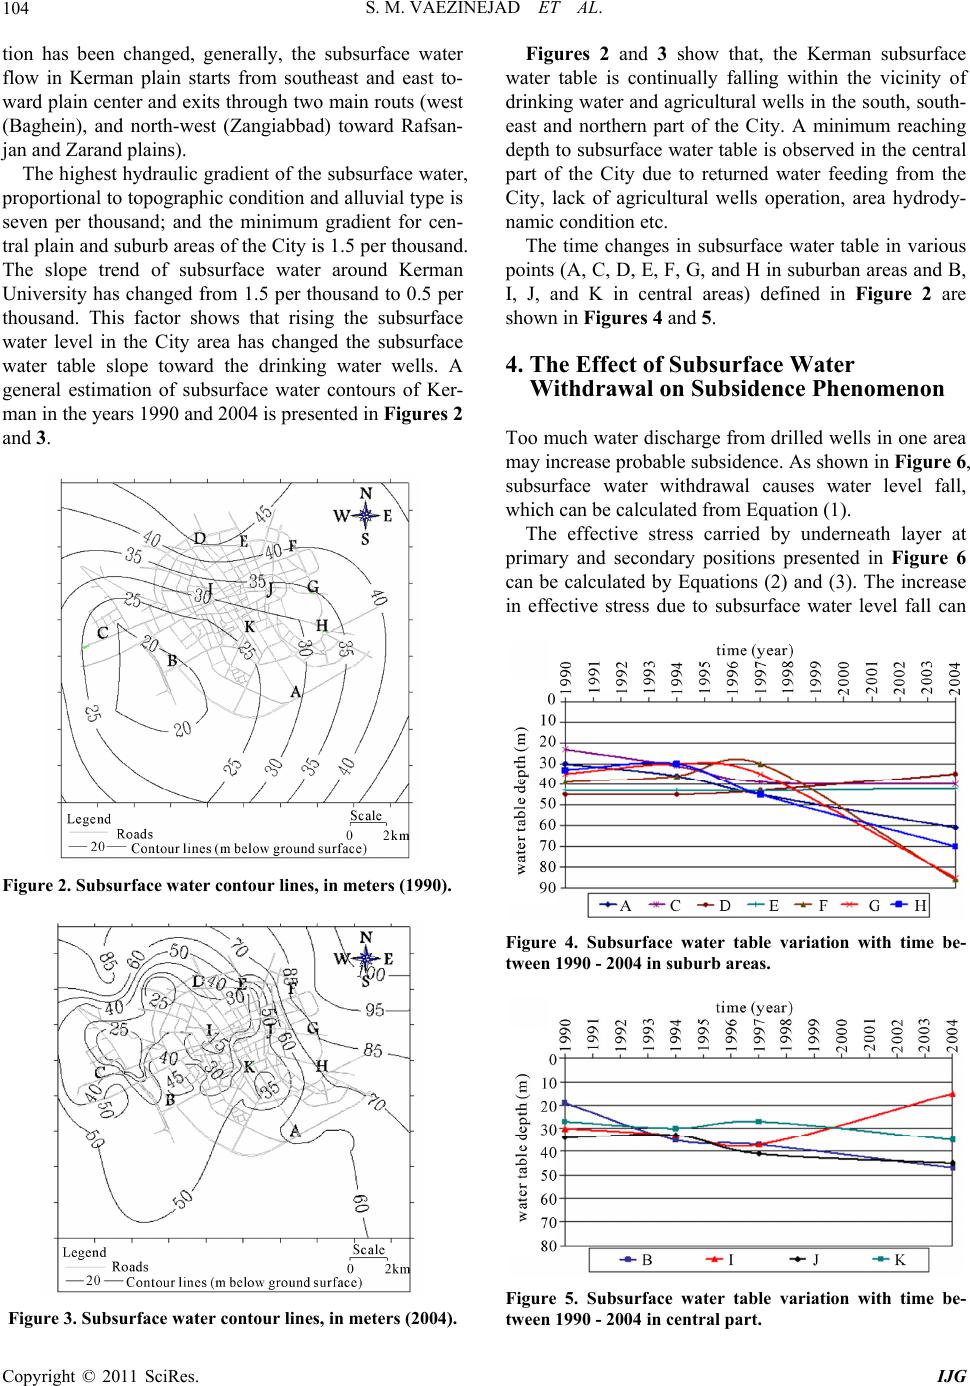 S. M. VAEZINEJAD ET AL. Copyright © 2011 SciRes. IJG 104 tion has been changed, generally, the subsurface water flow in Kerman plain starts from southeast and east to- ward plain center and exits through two main routs (west (Baghein), and north-west (Zangiabbad) toward Rafsan- jan and Zarand plains). The highest hydraulic gradient of the subsurface water, proportional to topo graphic conditio n and alluvial type is seven per thousand; and the minimum gradient for cen- tral plain and suburb areas of the City is 1.5 per thousand. The slope trend of subsurface water around Kerman University has changed from 1.5 per thousand to 0.5 per thousand. This factor shows that rising the subsurface water level in the City area has changed the subsurface water table slope toward the drinking water wells. A general estimation of subsurface water contours of Ker- man in the years 1990 and 2004 is presented in Figures 2 and 3. Figure 2. Subsurface water contour lines, in meters (1990). Figure 3. Subsurface water contour lines, in meters (2004). Figures 2 and 3 show that, the Kerman subsurface water table is continually falling within the vicinity of drinking water and agricultural wells in the south, south- east and northern part of the City. A minimum reaching depth to subsurface water table is observed in the central part of the City due to returned water feeding from the City, lack of agricultural wells operation, area hydrody- namic condition etc. The time changes in subsurface water table in various points (A, C, D, E, F, G, and H in suburban areas and B, I, J, and K in central areas) defined in Figure 2 are shown in Figures 4 and 5. 4. The Effect of Subsurface Water Withdrawal on Subsidence Phenomenon Too much water discharge from drilled wells in one area may increase probable subsidence. As shown in Figure 6, subsurface water withdrawal causes water level fall, which can be calculated from Equation (1). The effective stress carried by underneath layer at primary and secondary positions presented in Figure 6 can be calculated by Equations (2) and (3). The increase in effective stress due to subsurface water level fall can Figure 4. Subsurface water table variation with time be- tween 1990 - 2004 in suburb areas. Figure 5. Subsurface water table variation with time be- tween 1990 - 2004 in central part.  S. M. VAEZINEJAD ET AL. Copyright © 2011 SciRes. IJG 105 Figure 6. Subsurface water le vel falling. also be calculated from Equation (4) (the difference be- tween Equations (2) and (3). The increase in effective stress may consolidate the underneath layers and causes subsidence in the long term. 1122 hhh h h (1) 012vsandsat w hh (2) 112vsandsat w hh (3) 10 vvvsandsatw h (4) 5. Land Subsidence Measurement In order to determine the subsidence of various points of the City, an extensive surveying network using 500 sta- tions in an area of 334 square kilometers was used. The stations erected at the beginning of 2004 and monitored at the end of 2004, 2006 and 2007 with accuracy of ± 1 cm. In each stage of reading, all stations were monitored re- fer to a reference benchmark. Based on obtained data and using surveying methods, the heights of stations were calculated precisely. Consequently, the subsidence for each time period is equal to the difference in calculated relative heights for each station. Then stations altitude and latitude were monitored on the basis of Universal Transverse Mercator (UTM) by a Global Positioning System (GPS). The measurement results are presented in Figures 7 and 8. To access previous years information, the data of some benchmarks were obtained from Iranian Surveying Or- ganization stations. The stations erected by this organiza- tion were 108 stations and monitored from 2001 to 2003. The quantity of subsidence, which occurred d uring these years, was measured and its related contour lines are presented in Figure 9. To compare results obtained from our stations and re- sults of surveying network of Iranian Surveying Organi- zation, the data for these benchmarks were monitored in 2006 and 2007. Results showed a proper compatibility Figure 7. Subsurface contour lines, in meters for City of Kerman (2004-2006). Figure 8. Subsurface contour lines, in meters for City of Kerman (2004-2007). Figure 9. Subsurface contour lines, in meters for City of Kerman (2001-2003).  S. M. VAEZINEJAD ET AL. Copyright © 2011 SciRes. IJG 106 with results of Iranian Surveying Organization. The qu an- tity of subsiden ce, in a six-year period between 2001 and 2007 is presented in Figure 10, which is the result of comparison of the reading in 2007 and the reading of Iranian Survey i ng O rganization in 2001. 6. Prediction of Subsidence Using Artificial Neural Network Model In recent years, the use of Artificial Neural Networks (ANNs) inspired by brain applications, was extended by many factors. The most important factor is special cha- racteristics of the brain in processing data, which are beyond the reach of ordinary methods of programming. Among these characteristics, learning and generalizing of examples, ability to make solutions for problems with changeable conditions that need high speed processing, can be mentioned. In reality, artificial neural networks are extensive pa- rallel processors that are made of simple processing units, known as “neurons”. Neural networks can store experi- mental information and then these networks can be pre- pared for future uses; this process is called “training”. There are two methods for the training of ANNs, su- pervised and unsupervised. Using each one of these me- thods, the network can produce special outputs for a group of inputs. The process of training in unsupervised networks has special conditions and due to absence of a training group is very complicated. The situation is com- pletely different in supervised ones. At this method of training, a group of exact input-outputs has been pre- pared and the process is performed under the supervision of this group. This simplicity led to more usage of super- vised networks. Artificial neural networks include an arbitrary number of layers, which have some neurons internally. In these networks, signals transfer from a neuron to the ot h e r o n e through connections represented by “Weights”. The number of layers and their neurons are different for various networks but in all of them, the first layer is in- put layer, which gives input variables and the last one is output layer that represents outputs of network. Other layers between these two layers are called “hidden lay- ers”, which transform the input d ata into the output data. At final layer, the amount of difference between outputs of network and target outputs that are clear from training group are measured and the performance of networks is measured by using “MSE”1 function defined in Equation (5). 1 1n ii i M SEnd y (5) Figure 10. Subsurface contour lines, in meters for City of Kerman (2001 - 2007). where, in Equation (5) n is number of outputs, d is target value and y is the network output. It is a fact that, in the process of training, weights change until MSE decreases to a required minimum. 6.1. Providing Training Group for Network Training As mentioned earlier, for training of a network in super- vised manner, a group of data including real input-out- puts is required. This group must be in accordance with the following criteria: A- The training data must include such a large range that, it can teach all conditions which might happen for network in future. B- The data must be completely accidental and not be sorted in a special manner. Otherwise, the network would memorize the manner and training would not be true. C- Values of inputs and outputs in training group must be large enough so that all ranges of them can be consi- dered in the training process. D- The training group must include some fault values so that the network would be controlled to recognize them and give correct outputs. Keeping in mind the above criteria, the information for each point is sorted and used in the artificial neural net- work. The input data is (x, y, t) where, (x, y) are UTM coordinates of each point and t is the period for each movement. The period is calculated from 2001 and is based on a monthly basis. The output data is s, which is the amount of movement in the period of t. By sorting all d ata, th ey were d ivided in to thr ee g r o u p s : 1-training group for training (learning) of network, 2-validating group for optimizing operation of network 1Mean squared error performance function.  S. M. VAEZINEJAD ET AL. Copyright © 2011 SciRes. IJG 107 and 3-testing group for the test of network to give right answers to undefined conditions. 6.2. Network Algorithm Previous researchers showed that a multi-layer feed-for- ward network using Error-Back Propagation algorithm (BP) would be the best network for prediction purposes [13]. Figure 11(a) illustrates various steps of training in these networks. At first step, input values are presented for network. After processing them in hidden layers, outputs are obtained. These outputs must be compared with target ones, witch are clear from the training group. Such a comparison gives error values and the network performance (MSE) could be calculated. If this value is proper, the training process stops, otherwise values of weights must change and the iteration continues. The process is depicted more clearly in Figure 11(b), it is shown that, the input vector of nth neuron in kth layer that is represented by x(n), is multiplied by the corres- ponding weights and bias value is added. Finally, the neuron value of th is layer, yk(n), is calculated from Equa- tion (6). 1 m kikik i ynfxw v (6) where, in Equation (6) f is “transfer function”, which generates neuron outputs, m is the number of neurons in the (k − 1)th layer and k is the value of bias in kth layer. As shown, the neuron value, yk(n), is compared with desired one, dk(n), and error value, ek(n), which is used for adjusting weights, is obtained. The BP algorithm uses the gradient of transfer function to determine how to ad- just the weights to minimize performance. In this study, among various networks with different layers and structures, which were made, validated and tested, a multi-layer feed-forward network with three hidden layers had the best performance in the training and testing processes. Due to three variables in input data (x, y, t) and one variable in output data (s), the first layer of this network had three neurons and the last one had one neuron. Each of the three hidden layers had five neurons. Transfer functions of layers one to four was “Tansig”2 and for layer five “Purelin”3 function applied. As mentioned earlier, the error-back propagation algorithm was se- lected and the training function was “Trainlm” function that updates weight and bias values according to Leven- berg-Marquardt optimization. The created network was used for the prediction of (a) (b) Figure 11. Multi-layer feed-forward network function. (a) Network algorithm; (b) Adjusting of weights. subsidence in different parts of Kerman. Subsequently, the contour lines of the City subsidence for 2001 - 2011 and 2001 - 2016 are dr awn in Figures 12 and 13 respec- tively. Figures 12 and 13 show that, the land subsidence on the outskirts of Kerman will resume if usage of ground water continues with current speed. In addition, the results show that, in central parts of the city, the amounts of settlement will grow more slowly. 7. Discussions and Analysis Figure 7 showed that, various parts of the City of Ker- man are experiencing subsidence between zero and above 15cm per year. Paying attention to points A, D, E and F in Figure 4 and also, considering Figures 7 to 10, it is apparent that, even though, at some parts of the north of the city, water table has not changed significantly, in all northern and southern areas of the city high-speed subsidence is occurring. These areas include industrial and agricultural regions, drinking water wells in the south and some agricultural regions in the north, which have active deep wells and high daily-usage of ground water. Figures 12 and 13 show that ground movements of these areas will resume; if water withdrawal continues with the same rate and consequently in southeastern parts of the city, the land subsidence will reach to 2 m for a period of 15 years. Although water table changes are extensive in the eastern parts of the city; near point G in Figures 2 and 3, but because of being close to the foothill and presence of rocky layers, ground surface movements at these places are little. This trend will be the same in future and the 2Hyperbolic tangent sigmoid transfer function 3Linear transfer function  S. M. VAEZINEJAD ET AL. Copyright © 2011 SciRes. IJG 108 Figure 12. Subsurface contour lines, in meters for City of Kerman (2001-2011). Figure 13. Subsurface contour lines, in meters for City of Kerman (2001-2016). maximum settlement in a 15-year period between years 2001 and 2016 will reach to about 20 cm. Going faraway from these regions in various directions; toward sou- theastern, northeastern or central parts of the city, in a short distant, the amount of subsidence increases imme- diately. This fact is clear due to future land subsidence contour lines shown in Figures 12 and 13 for points I, J and k in central area and point H in southeastern regions of the city. It is clear that due to observed ground move- ment effects in central areas, water withdrawal has been controlled during previous years but, the ground subsi- dence resumes. This phenomenon occurs due to previous high pumpages of ground water and the presence of a thick layer of soft clay in these regions that led to a time-dependent consolidation. Points B and C in Figures 4 and 5 show that, in wes t- ern and southwestern areas of the city, that are densely populated, because of an absence of industrial and agri- cultural regions, the need for water pumpage is very low and water table has no notable changes. Consequently, even some cases of uplift have been observed, and the land subsidence in these areas is not significant. For better comparison of land subsidence on the out- skirts and central parts of the City of Kerman, two sec- tions of the city are provided. The directions of A-B (an east-west section) and C-D (a south-north section) are presented in Figure 14, and the sections are presented in Figure 15. Figure 15(a) shows that, the amount of subsidence in the southern regions of the City is high and in central parts, the amount of subsidence has been reduced, how- ever at the end of section A-B, in northern regions, this amount increases again. Considering Figure 15(b), it shows that, in the eastern regions near the foothill, due to the existence of rocky layers, the amount of subsidence is very low. By passing these regions, the amount of sub- sidence increases and ultimately in western regions, be- cause of low usage of ground water, the amount of sub- sidence decreases again. 8. Summary and Results The experimental results obtained from a case study in the Kerman City in Iran, for zonation and prediction of land subsiden ce due to immethodical ground water with- drawal and drought have been summarized as follows: 1) Accurate surveying is a proper method for zonation of subsidence. For this purpose, an appropriate network that properly covers the surface of the selected region is necessary. It is obvious that, as benchmarks become closer, the accuracy of zonation becomes higher. The Figure 14. Extent of sections A-B and C-D on Kerman’s map.  S. M. VAEZINEJAD ET AL. Copyright © 2011 SciRes. IJG 109 (a) (b) Figure 15. Variation of land subsidence’s amounts along sections A-B and C-D. (a) Section A-B; (b) Section C-D. network used for subsidence zonation in the city of Ker- man provided acceptable results for the study of this phenomenon in this city. 2) Obtained data showed that at present, various parts of the City subside between zero and above 15 cm per year. High usag e of groundwater together with existence of fine-grained soil and compressibility of underneath soil layers, are the main reasons of land subsidence in the City of Kerman. 3) Differences in the amount of water pumpages and subsurface soil profiles and the presence of foothill and rocky layers are the main reasons for changes in the rate of annual subsidence in the City. 4) Since consolidation is time-dependent, even if in a region, water withdrawal discontinues, the settlement will not stop but its rate will decrease. 5) Due to high speed and proper accuracy, the use of a multi-layer feed-forward artificial neural network, which uses back propagation error algorithm for training, may contribute to better results in comparison with traditional methods for prediction of subsidence. Accurate predic- tion is so helpful in the design of civil plants, sched uling the usage of water resources, construction of vital build- ings, arrangement of roads etc. 6) The Prediction of future subsidence in the city showed that in some areas in the north and south of Kerman, the subsidence of 2m will occur between 2001 and 2016. It is so shocking that the predicted relative subsidence in the City between two parts with a short distance will reach to above 1m that will be so hazard- ous. 7) In the eastern part of the City, which is located at the mountain slope, there is limited change in subsidence between 2001 and 2016, yet, in the areas with thick fine-grained soil layers, the intensity of subsidence is very high. 9. References [1] J. F. Poland, “Guide Book to Studies of Land Subsidence Due to Ground-Water Withdrawal,” United Nations Edu- cat i o n a l , Sci e n t i f i c a n d Cu l t u ral Or g a niz a t i o n , P a r i s , 1984. [2] M. Barbarella, A. Gubellini, P. Russo and A. Vettore, “Time Series Analysis by Collocation on the Vertical Movements of the Asinelli Tower in Bologna,” Confe- rence of Height Determination and Recent Vertical Move- ments in Western Europe, Hanover, 15-19 September 1986, pp. 687-702. [3] T. L. Holzer, S. N. Davis and B. E. Lofgen, “Faulting Caused by Groundwater Extraction in South-Central Arizona,” Journal of Geophysical Research, Vol. 84, No. B2, 1979, pp. 603-612. doi:10.1029/JB084iB02p00603 [4] F. L. Metzger, M. E. Ikehara and F. J. Howle, “Vertic- al-Deformation, Water-Level, Microgravity, Geodetic, Water-Chemistry and Flow-Rate Data Collected during Injection, Storage and Recovery Tests at Lancaster, An- telope Valley, California, September 1995 through Sep- tember 1998,” U.S. Geological Survey, Open-File Report 01-414,159, 2001. [5] M. Sneed, S. V. Stork and L. D. Galloway, “Detection and Measurement of Land Subsidence Using Global Po- sitioning System and Interferometric Synthetic Aperture Radar, Coachella Valley, California, 1998-2000,” U.S. Geological Survey , Wa ter Re sources Investigation Report 02-4239, 2002. [6] R. K. Gabrysch, “Land-Surface Subsidence in the Hou- ston-Galveston Region, Texas,” Proceeding of 7th Inter- national Symposium on Land Subsidence, Shanghai, 23- 28 October 2005, pp. 736-743. [7] D. Galloway, D. R. Jones and S. E. Ingebritsen, “Land Subsidence in the United States,” U.S. Geological Survey Report, 1999. [8] S. C. Stiros, “Subsidence of the Thessaloniki (Northern Greece) Coastal Plain, 1960-1999,” Journal of Engineer- ing Geology, Vol. 61, No. 4, 2001, pp. 243-256. [9] I. D. Doukas, I. M. Ifadis and P. Savvaidis, “Monitoring and Analysis of Ground Subsidence Due to Water Pump- ing in the Area of Thessaloniki, Hellas,” FIG Working Week, Athens, 22-27 May 2004, pp. 1-14. [10] N. Phien-Wej, P. H. Giao and P. Nutalaya, “Land Subsi- dence in Bangkok, Thailand,” Engineering Geology, Vol. 82, No. 4, 2006, pp. 187-201. doi:10.1016/j.enggeo.2005.10.004 [11] T. M. Thu and D. G. Fredlund, “Modelling Subsidence in the Hanoi City-Area Vietnam,” Canadian Geotechnical  S. M. VAEZINEJAD ET AL. Copyright © 2011 SciRes. IJG 110 Journal, Vol. 37, No. 3, 2000, pp. 621-637. doi:10.1139/t99-126 [12] K. J. Larson, H. Basagaoglu and M. A. Marino, “Predic- tion of Optimal Safe Ground Water Yield and Land Sub- sidence in the Los Banos-Kettleman City Area, California, Using a Calibrated Numerical Simulation Model,” Jour- nal of Hydrology, Vol. 242, No. 1-2, 2001, pp. 79-102. doi:10.1016/S0022-1694(00)00379-6 [13] T. Ambrozic and G. Turk, “Prediction of Subsidence Due to Underground Mining by Artificial Neural Networks,” Journal of Computers & Geoscience, Vol. 29, No. 5, 2003, pp. 627-637. |