Journal of Water Resource and Protection
Vol.4 No.11(2012), Article ID:24481,10 pages DOI:10.4236/jwarp.2012.411110
Hydrogeophysical Parameters Estimation for Aquifer Characterisation in Hard Rock Environment: A Case Study from Yaounde, Cameroon
1Department of Physics, Faculty of Science, University of Yaounde I, Yaounde, Cameroon
2Department of Earth Science, University of Yaounde I, Yaounde, Cameroon
3National Institute for Geologic and Mining Research, Yaounde, Cameroon
Email: *pnnouck@yahoo.com
Received August 2, 2012; revised September 1, 2012; accepted October 4, 2012
Keywords: Hydrogeophysical; Transmissivity; Hydraulic Conductivity; Yaounde
ABSTRACT
Detailed local geological and hydrogeophysical investigations were carried out for the aquifer in Yaoundé, Cameroon to delineate the architecture of different subsurface geological horizons using lithologs and generated vertical electrical sounding (VES) data. An attempt has also been made to estimate aquifer transmissivity from resistivity data. The transmissivity of the unconfined aquifer was computed by determining the Dar-Zarrouk parameters (longitudinal unit conductance and transverse unit resistance) and were compared with the actual field transmissivity. The results showed a direct relation between aquifer transmissivity and transverse resistance. The relationship established has therefore, been generalized in the study area in order to evaluate hydraulic conductivity and transmissivity at all the points where geoelectrical measurements have been carried out. This generalization allows one to derive maps of the product Kσ and transmissivity in the study area based on geoelectrical measurements. These maps are important in future modelling processes oriented towards better exploitation of the aquifers.
1. Introduction
In the past decade, the importance of groundwater resource in Yaounde areas has increased considerably and interest in exploration for potential sources has grown. Exploitation of the resources must be carried out with extreme care in order not to deplete them, and to ensure a long-lasting use of water. Efficient management of groundwater resources, therefore, depends on accurate groundwater modelling to predict aquifer behaviour during exploitation. Several methods are available in groundwater hydrology for the evaluation and estimation of the hydraulic characteristics of aquifers, like transmissivity, hydraulic conductivity, and storability [1]. The most commonly used methods involve conducting pumping tests on existing or newly drilled wells followed by analysis and interpretation of pumping test data. However, it should be appreciated that such tests are capital and labour intensive, requiring several boreholes, many operatives, and a considerable amount of equipment [2]. Furthermore, the estimation of hydraulic conductivity is crucial for the reliable simulation of the groundwater flow of one aquifer. Geophysical methods, particularly those involving resistivity, can contribute considerably to increase accuracy of the groundwater model, not only by delineating the aquifer extension and marking structural features, but also by establishing a relation between geoelectrical and hydrogeological parameters. [3] has characterized and derived the transmissivity and hydraulic conductivity of the Neogene aquifer in Al-Salamyeh region in Syria through the application of vertical electrical sounding technique (VES). [4] used electrical soundings to estimate transmissivity in Italy. [5] established an empirical relation between aquifer electrical resistivity and aquifer hydraulic conductivity and a semi-empirical relation between the aquifer formation factor and hydraulic conductivity. [6] reported that the relation between transmissivity and transverse resistance is more meaningful. [7] noted that it is better to use a modified transverse resistivity instead of transverse resistance. This modification is used to consider variations in the groundwater quality. [8] analysed the correlation between aquifer and geoelectrical parameters in both the saturated and unsaturated zones of aquifers. [9] used geoelectric resistivity soundings for groundwater evaluation in two different areas, namely the city of New Qena and the El-Khatatba area in Egypt. The main objectives of this paper, therefore are:
• Establishing and verifying a field scale theoretical relationship between geoelectrical resistivity data and hydrogeological data (hydraulic conductivity, and transmissivity) in order to improve the characterization of aquifer parameters.
• Establishing the corresponding maps of the variations of hydraulic and electrical properties of the aquifer across the study area.
2. Description of the Study Area
The city of Yaounde is located on the western edge of the plateau of Southern Cameroon between longitudes 11˚E and 13˚E and latitudes 3˚N and 5˚N (Figure 1). Semiarid climatic conditions prevail in the area, with minimum and maximum temperature of 23˚C and 26˚C, respectively.
2.1. Geology
Yaounde city belongs to the Pan-African Chain of Central Africa [10]. The soil is made up of thin layer of topsoil, a clay sand horizon furniture, clay with occasional blocks of weathered rock underlying [11] and finally bedrock which forms the base. Its basement is made up (Figure 1) of migmatites and gneisses [12].
In Yaoundé, the bedrock is neither porous nor soluble, but it is discontinuities (faults, diaclases) the formation; this last being anisotropic and heterogeneous.
2.2. Hydrogeology
The study area is characterized by continuous alterites aquifers, approximately exploitable overlying water bearing fissures or fracture aquifers in the bedrock [13]. These types of aquifers are superimposed or isolated. In a crystalline medium, capacitive and conductive functions both exist within each aquifer. Generally, the weathered medium is capacitive while the basement is conductive [14].
3. Geoelectrical Measurements and Interpretation
The geoelectrical data was obtained using the Schlumberger electrode configuration. The method is based on measuring the potentials between a pair of electrodes, while transmitting direct current (DC) between another
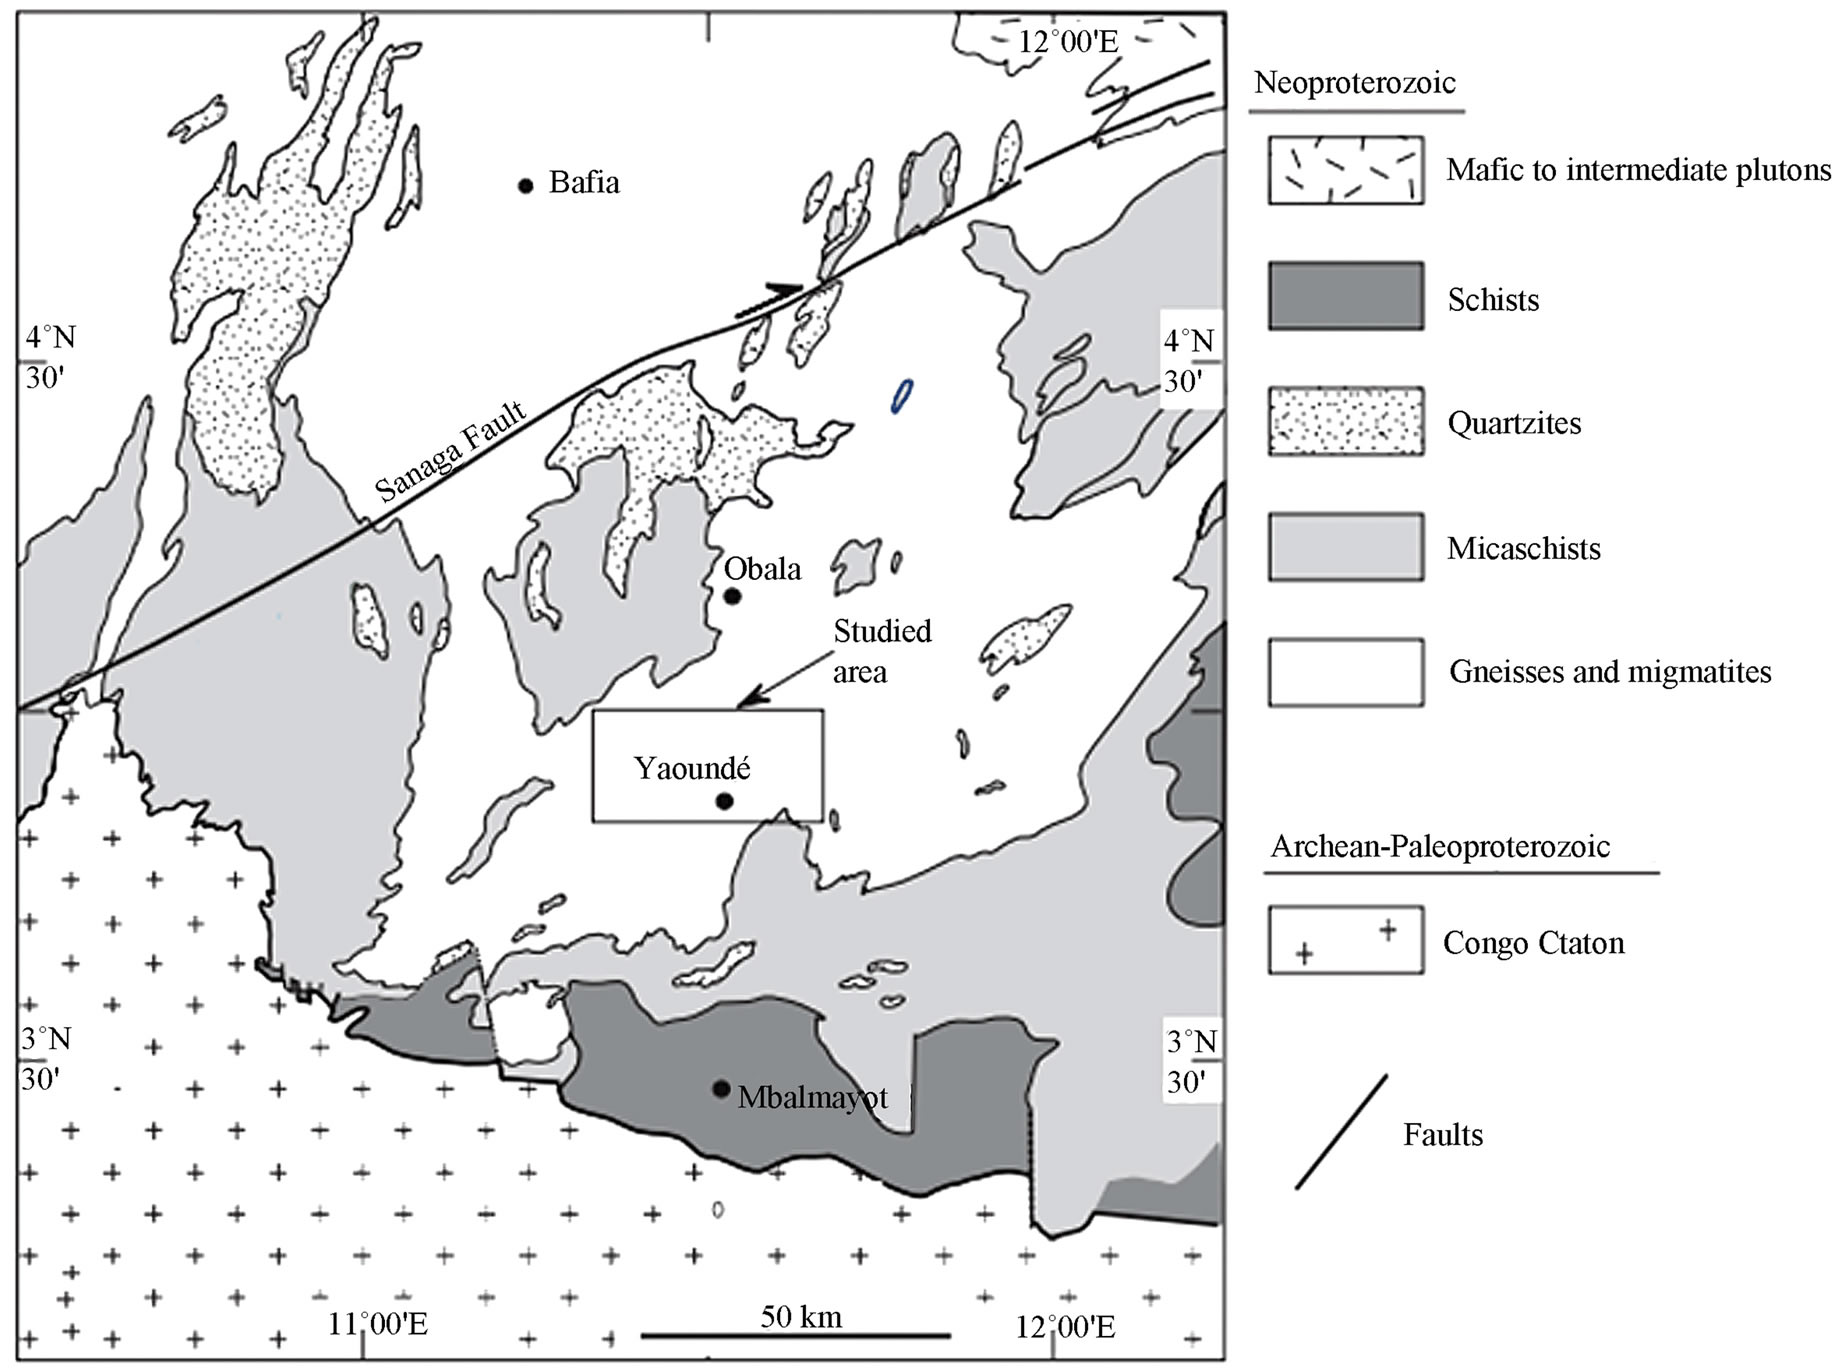
Figure 1. Geological map of Yaoundé area (modified [19]).
electrode pair. The depth of penetration is proportional to the separation between the current electrodes. By varying the electrical electrode separation, information about stratification of the ground is provided. The soundings were carried with maximum current electrode spacing ranging to 80 m. The electrical resistivity (ρ) of the medium is determined from the measurement of potential difference (ΔV) and injected current (I) as:
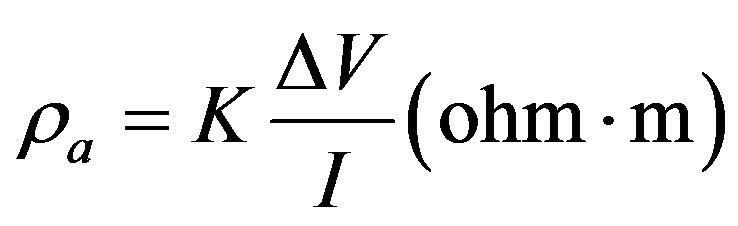 (1)
(1)
K is the geometric coefficient or array constant. The VES curves were obtained by plotting the apparent resistivity against electrode spacing, a computer program Genres [15], was used to reduce the geo-electrical sounding curves into values of thickness and resistivity of individual[11] layers. A total of seventeen (17) VES stations were sampled and the interpretation of sounding curves is summarized in [13]. The accuracy in estimating the thickness and electrical resistivity of the aquifer were maintained while interpreting the VES data at RMS error < 6%. A typical resistivity curve is shown in Figure 2.
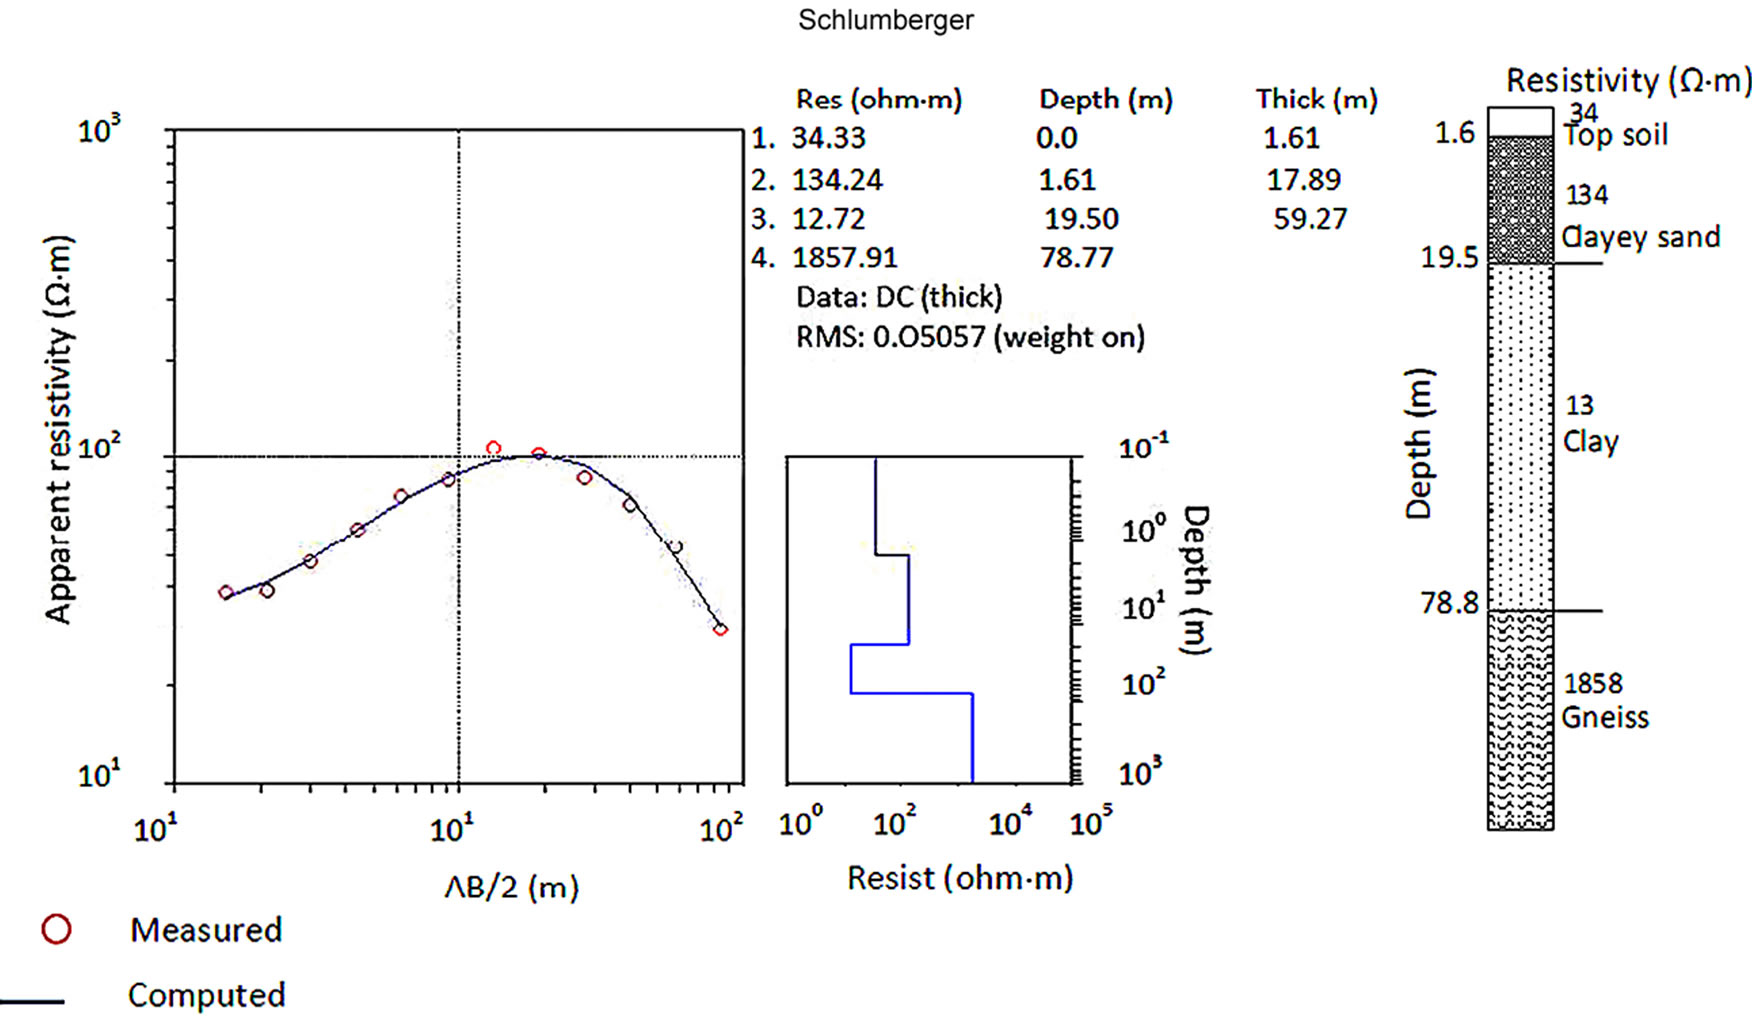
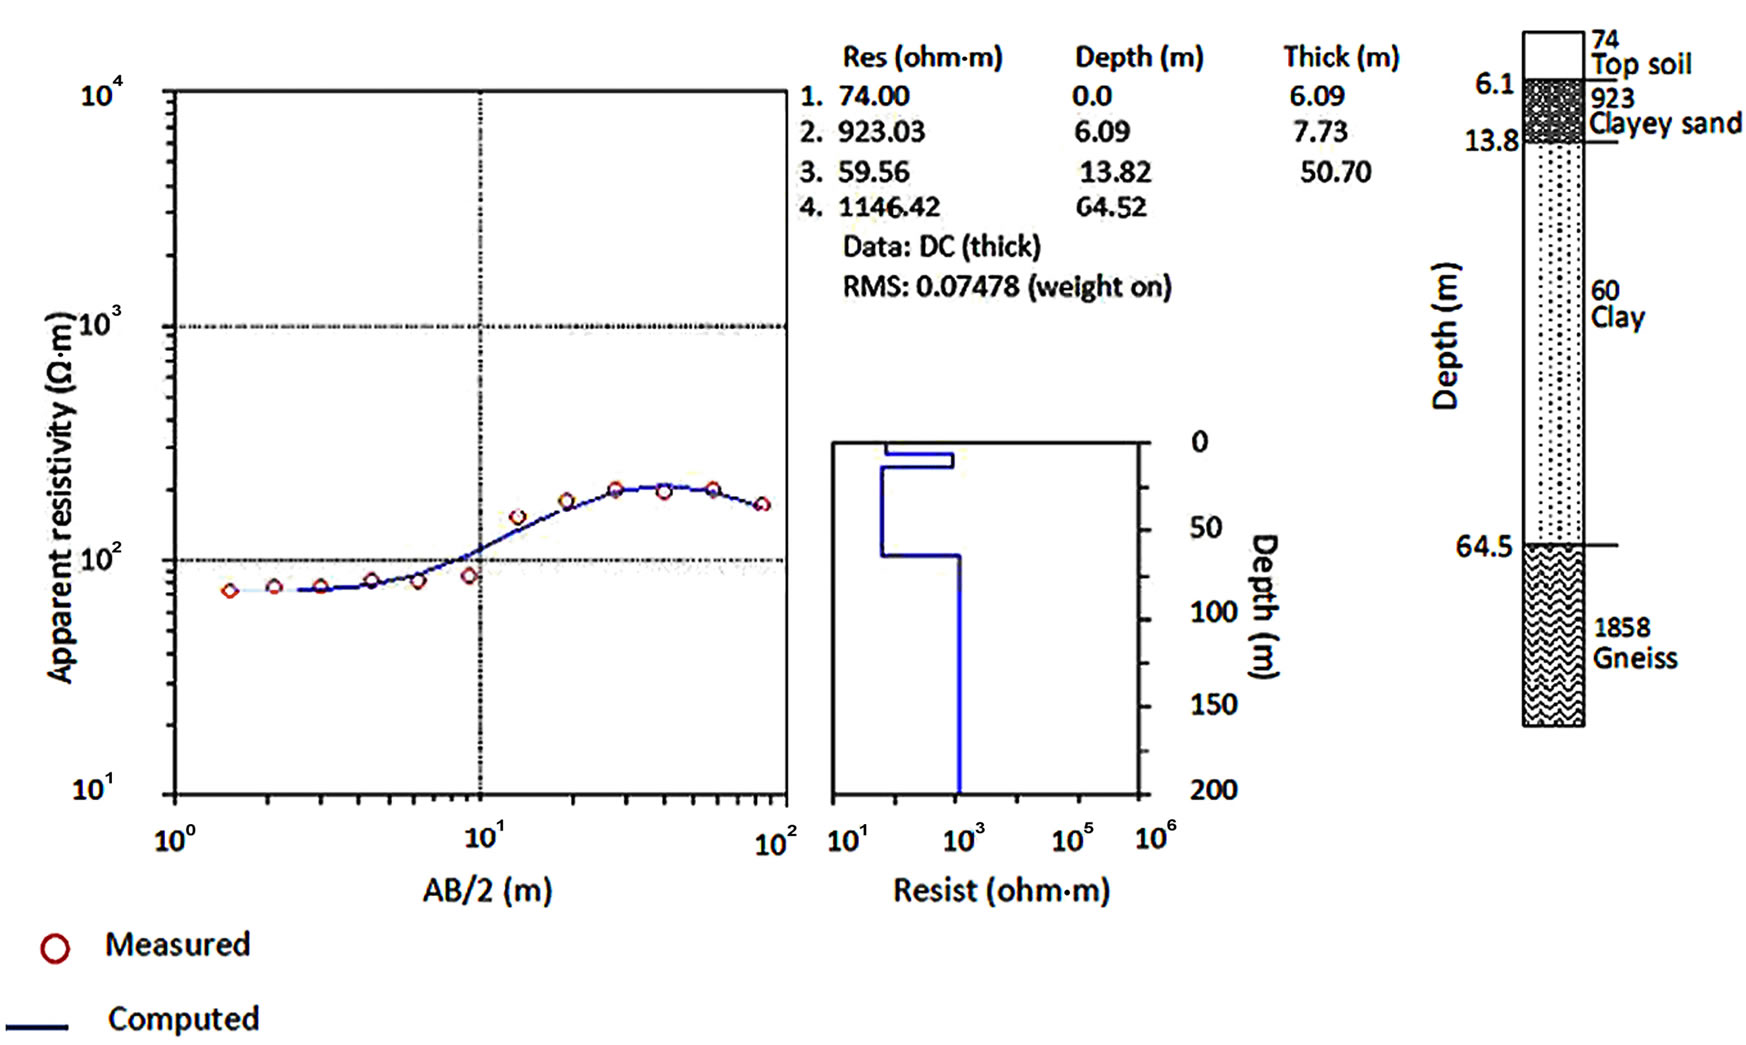
Figure 2. Sounding curves and relevant lithological sections in the study area.
3.1. Pumping Tests Data Collection and Interpretation
In carrying out a pumping test, groundwater was pumped from the borehole and the response of the aquifer was measured in the same or nearby observation boreholes. A model was then used to estimate transmissivity values from the aquifer response. The heterogeneity of the hard rock system has been modeled as an equivalent porous medium. Thus, the primary and secondary porosity and the transmissivity distribution are replaced with a continuous porous medium having equivalent hydraulic properties. The Jacob’s method has been used in conjunction with the [16] method for interpretation of the pumping tests. Aquifer bulk resistivity at pumping sites has been obtained from krigged estimates of aquifer resistivity data from VES stations (Figure 3). Aquifer layers have been taken as those overlying the basement layer. The tests consisted of two phases: the productive phase which lasted 1 h followed by a recovery phase, which was maintained until the water level in the borehole recovered or until three readings in succession were identical.
During the aquifer test, records of water levels before and after pumping, well discharge rate and the duration of the pumping test were made. The measurement of water levels was carried out in the pumped wells using an electric sounder, which is triggered when the tape is in contact with water surface.
3.2. Model Parameters
A unit square cross-section area cut out of a group of n layers of infinite lateral extent is taken into consideration in order to derive the model parameters.
The total transverse unit resistance R is given by
 (2)
(2)
where hi and ρi are respectively the layer thickness and the resistivity of i layer in the section.
The total longitudinal conductance S is
 (3)
(3)
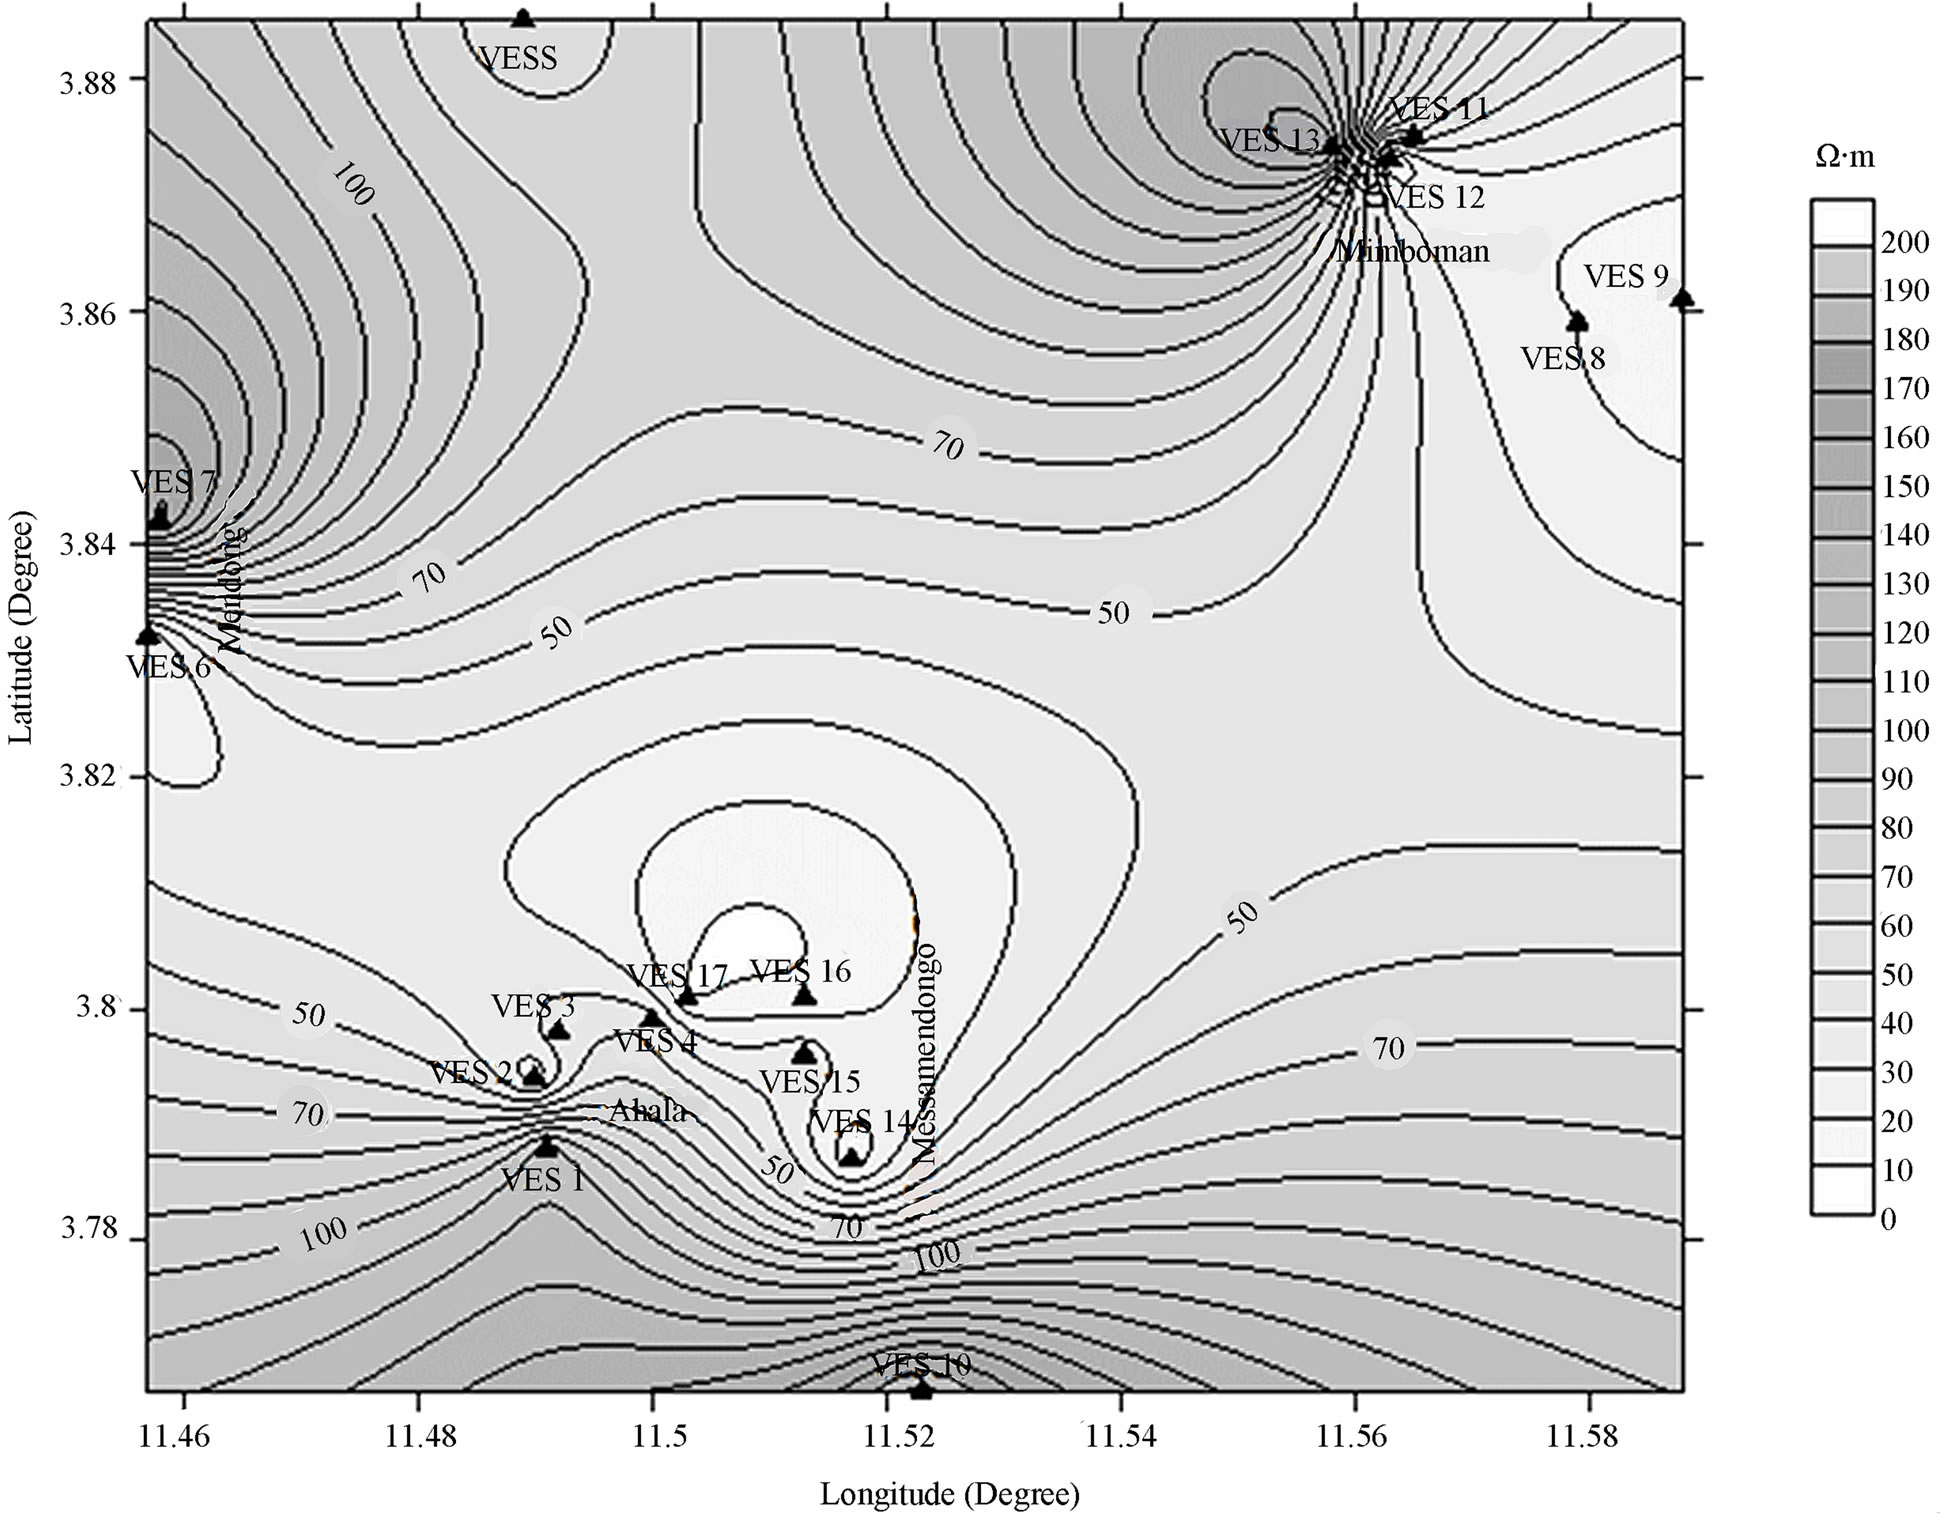
Figure 3. Iso-resistivity of the aquifer map.
The longitudinal layer conductance Si can also be represented by
 (4)
(4)
where σi the layer conductivity. Conductivity in this case is analogous to the layer transmissivity Ti used in groundwater hydrology, given by
 (5)
(5)
where Ki is the hydraulic conductivity of the i layer of thickness hi.
R and S in Equations (2) and (3) are called the DarZarrouk parameters, which have been shown to be a powerful tool during the interpretation of groundwater survey data [17]. The relationship between the transmissivity T and transverse resistance R can be explained as follows:
 (6)
(6)
A similar relationship can also be derived between the transmissivity T and aquifer longitudinal conductance S, such as
 (7)
(7)
In areas where the geological setting and water quality do not vary greatly, the product Kσ remains fairly constant [6]. Thus, knowing the values of K from the existing boreholes, and σ from the sounding interpretation around the boreholes, one can evaluate the transmissivity and its variation from one place to another through the determination of R or S related to the aquifer, according to Equations (5) and (6) [3]. The calculated values of the hydraulic parameters correspond to the mean values, as deduced from all the aforementioned methods. The values of field transmissivity from pumping tests of the alluvial aquifer were used for comparison with the computed transmissivity. The transmissivity values from pumping tests are shown in Table 1.
4. Results and Discussion
The application and interpretation of VES measurements carried out in the Yaounde area allow both thickness and resistivity of the aquifer to be obtained. Figure 3 shows the variation of the resistivity in the study area. Here the southern part of the study area has higher concentration of contour lines than the northern part.
The minimum resistivity of 4 ohm·m is observed in point VES 10, and a maximum resistivity of 196 ohm·m is obtained in point VES 8, with an average of 59.76 ohm·m and a standard deviation of 63.69 ohm·m.
This resistivity map indicates the presence of a lowresistivity zone, reflecting the direction of groundwater from east to west, and from southeast to northwest,
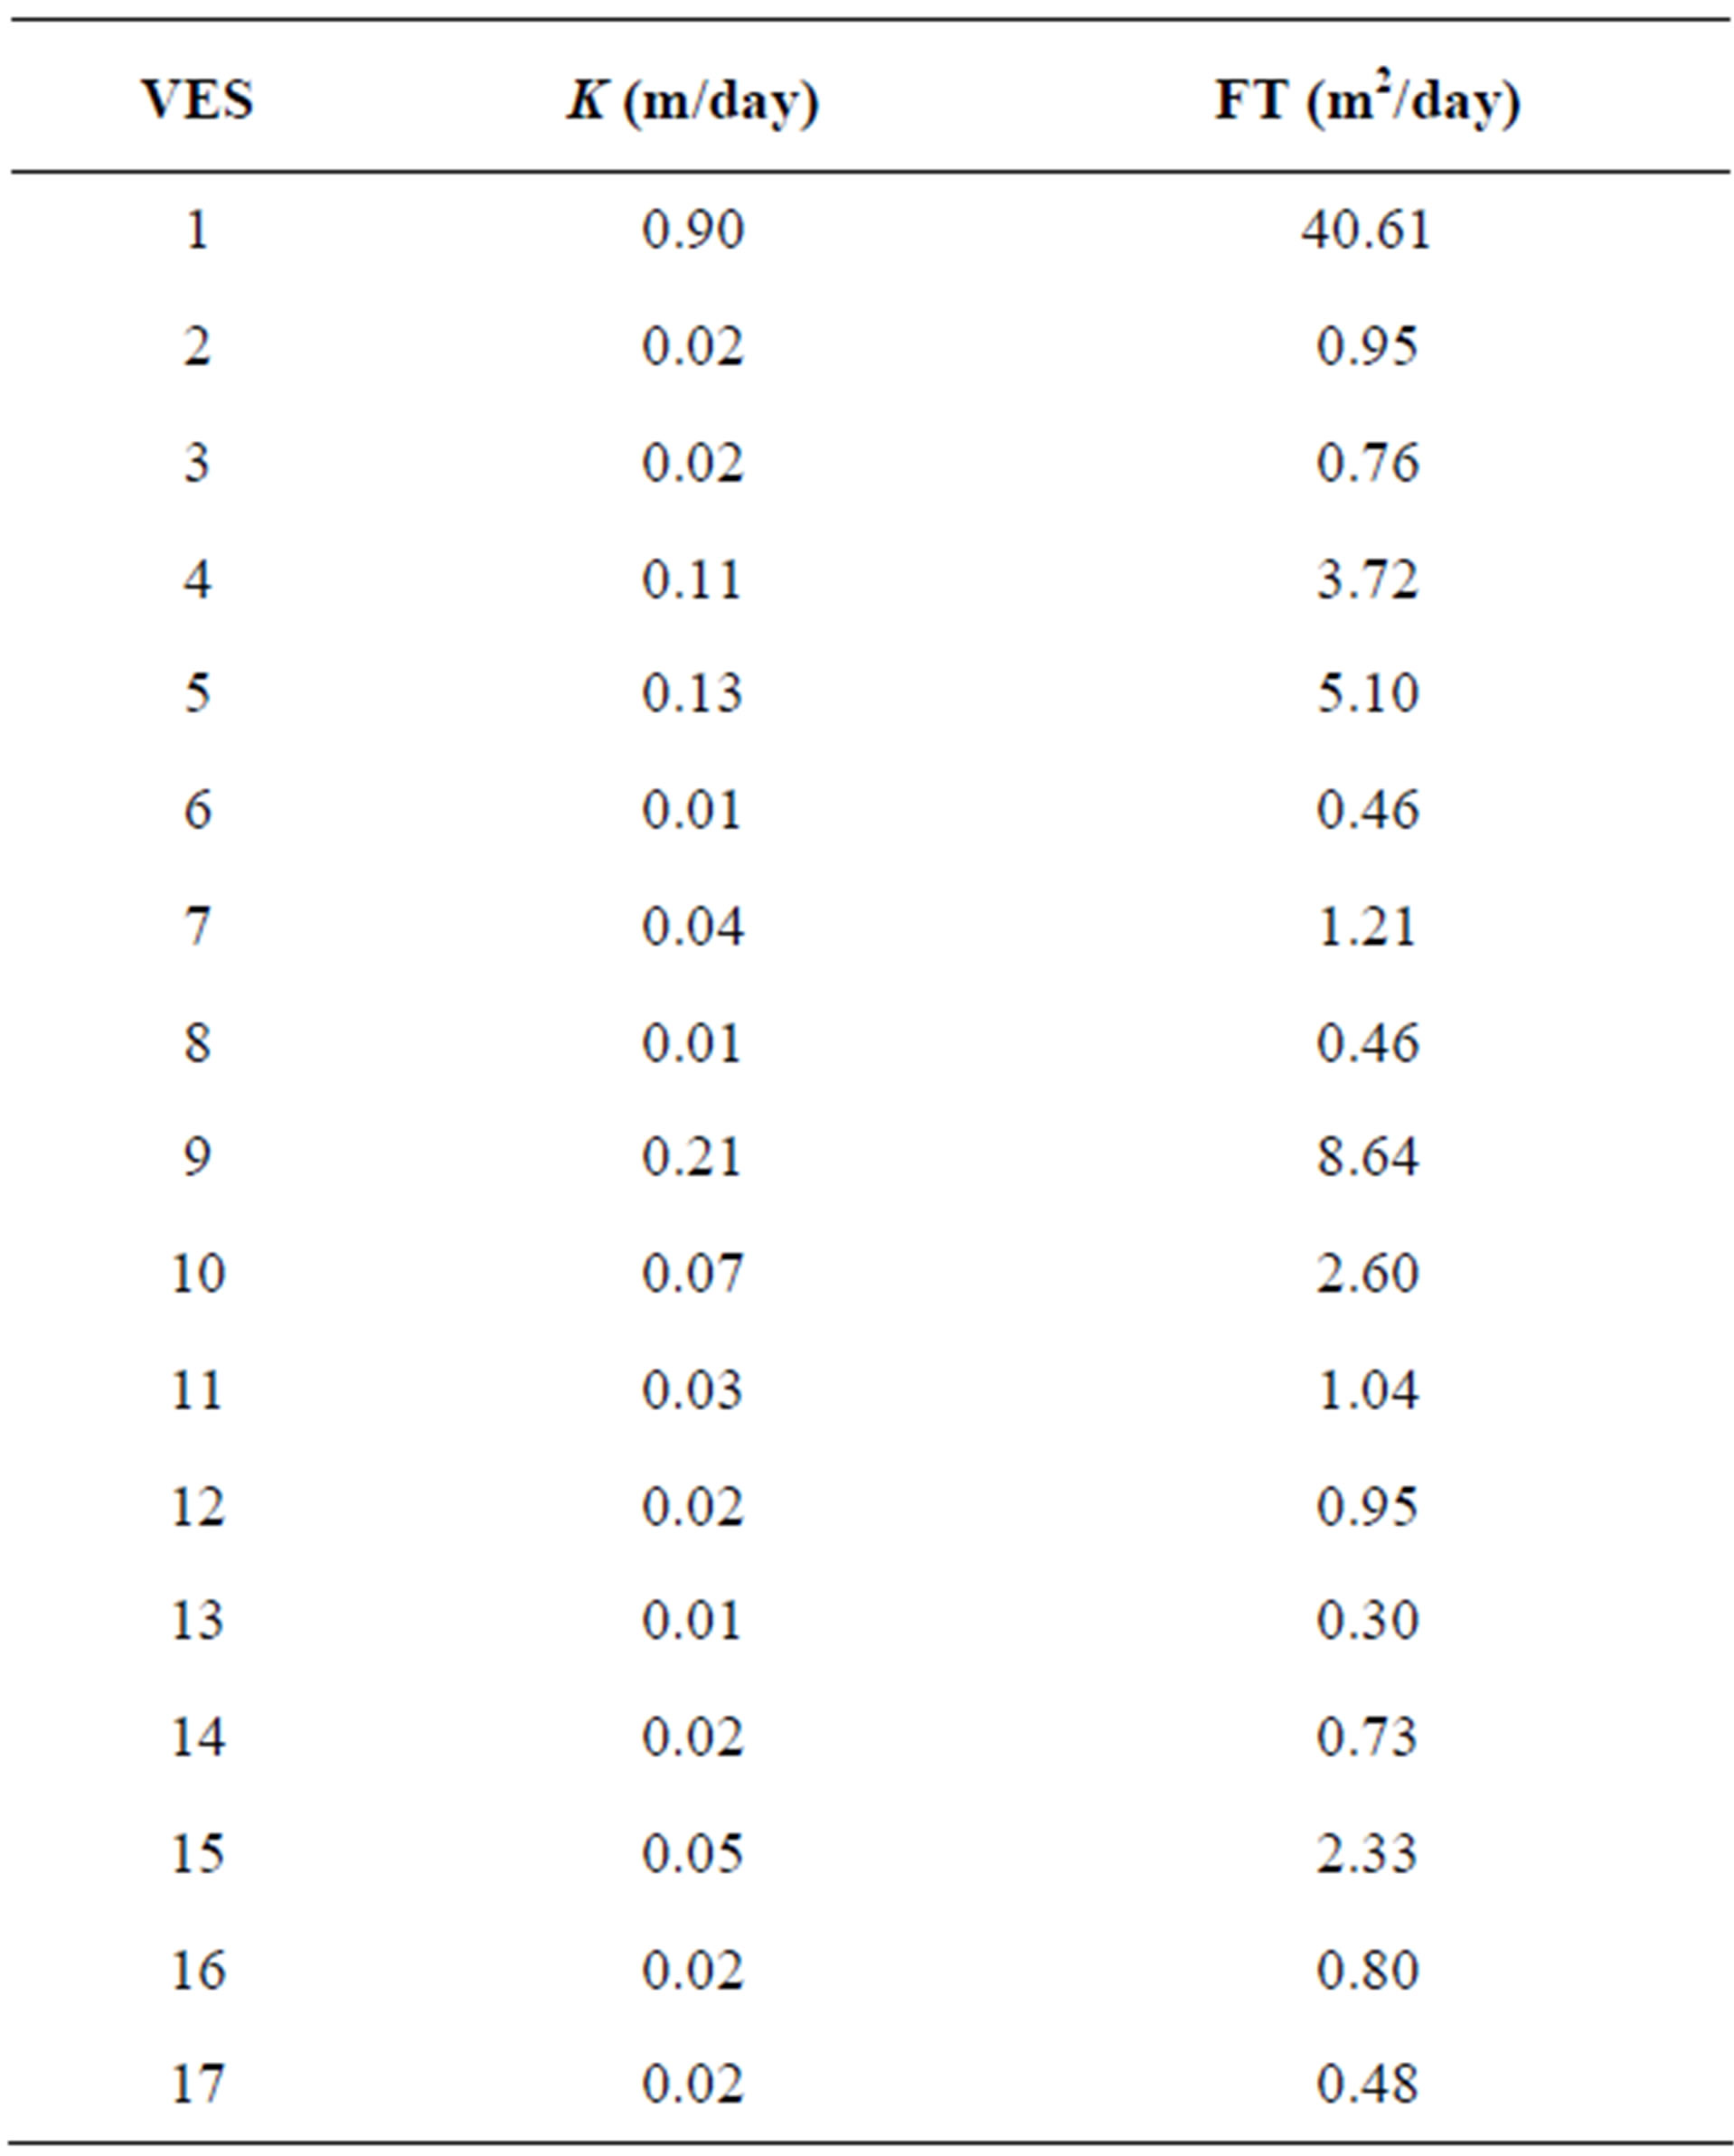
Table 1. Aquifer parameters from field test method.
where the recharge area is concentrated in the middle of the study area.
Figure 4 shows the distribution of the thickness in the Yaoundé zone, where a minimum thickness of 11.3 m is observed in point VES 7, and a maximum thickness of 63.3 m is obtained in point VES 2, with an average of 37.6 m and a standard deviation of 16.7 m. However, the resistivity of the layer depends more on the saturation of the layers and not necessarily on the thickness of the aquifer, hence higher resistivity may not correlate with areas of thicker aquifer.[12]
Table 2 gives a summary of the interpreted results of the VES, resistivities, hydraulic conductivities, and the computed transmissivity of the aquifer by means of the geoelectrical parameters. Therefore, knowing the hydraulic conductivity from the pumping tests from the boreholes and R or S from the geoelectrical data interpretation, it is easy to evaluate the transmissivity T and its variation from one place to another through establishing an empirical relationship between these parameters, as explained previously [3].
The transmissivity values determined from geoelectrical measurements according to the Equation (6), adopting an average K of 0.099 m/day, and shown in Figure 5" target="_self"> Figure 5 are generally low over the entire area due to the known water scarcity in the study region.
Transmissivity values vary between a minimum of 0.30 m2/day in point VES 13 and a maximum of 50.96
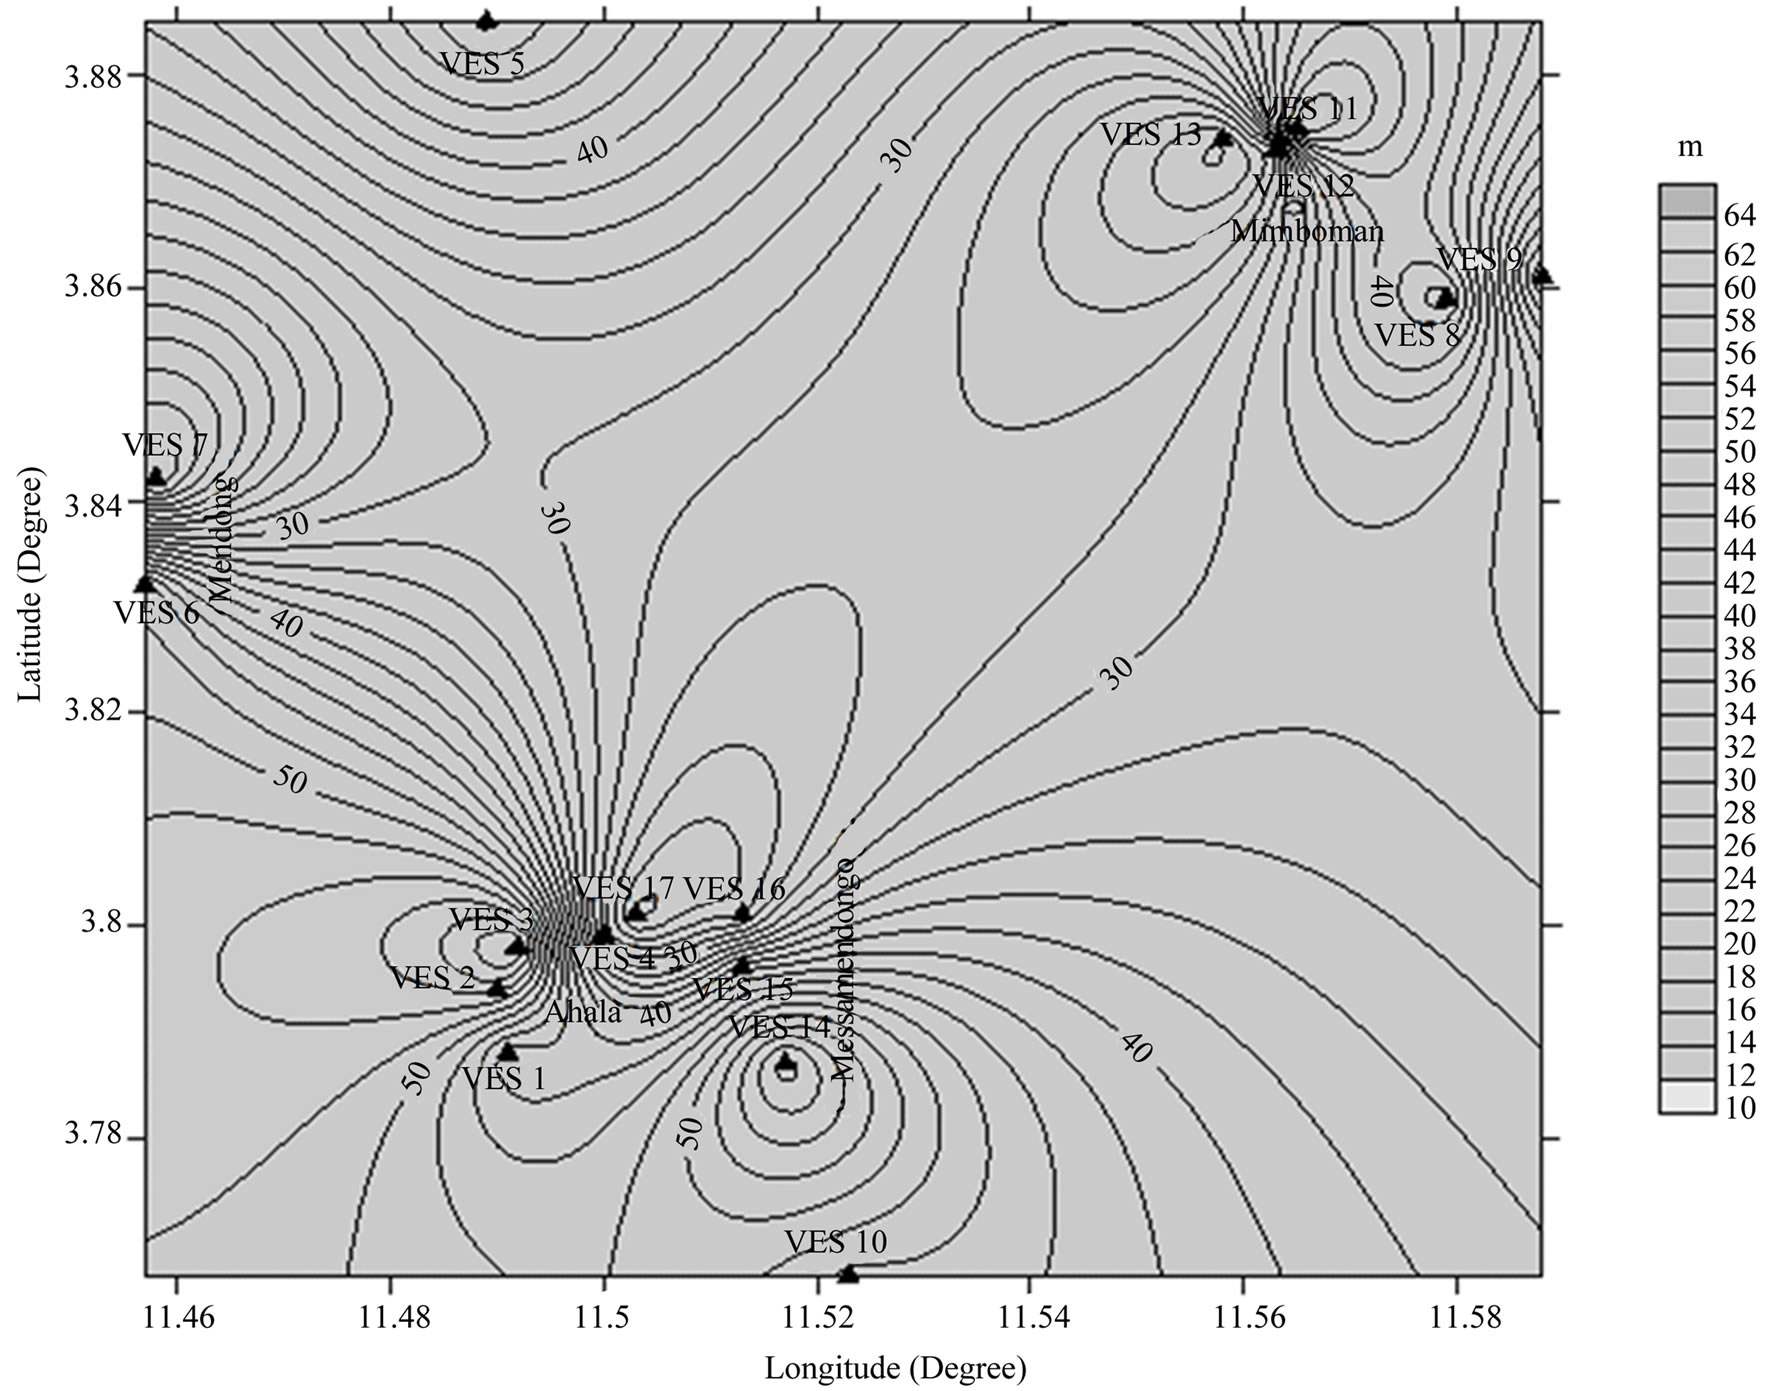
Figure 4. Iso-thickness map.
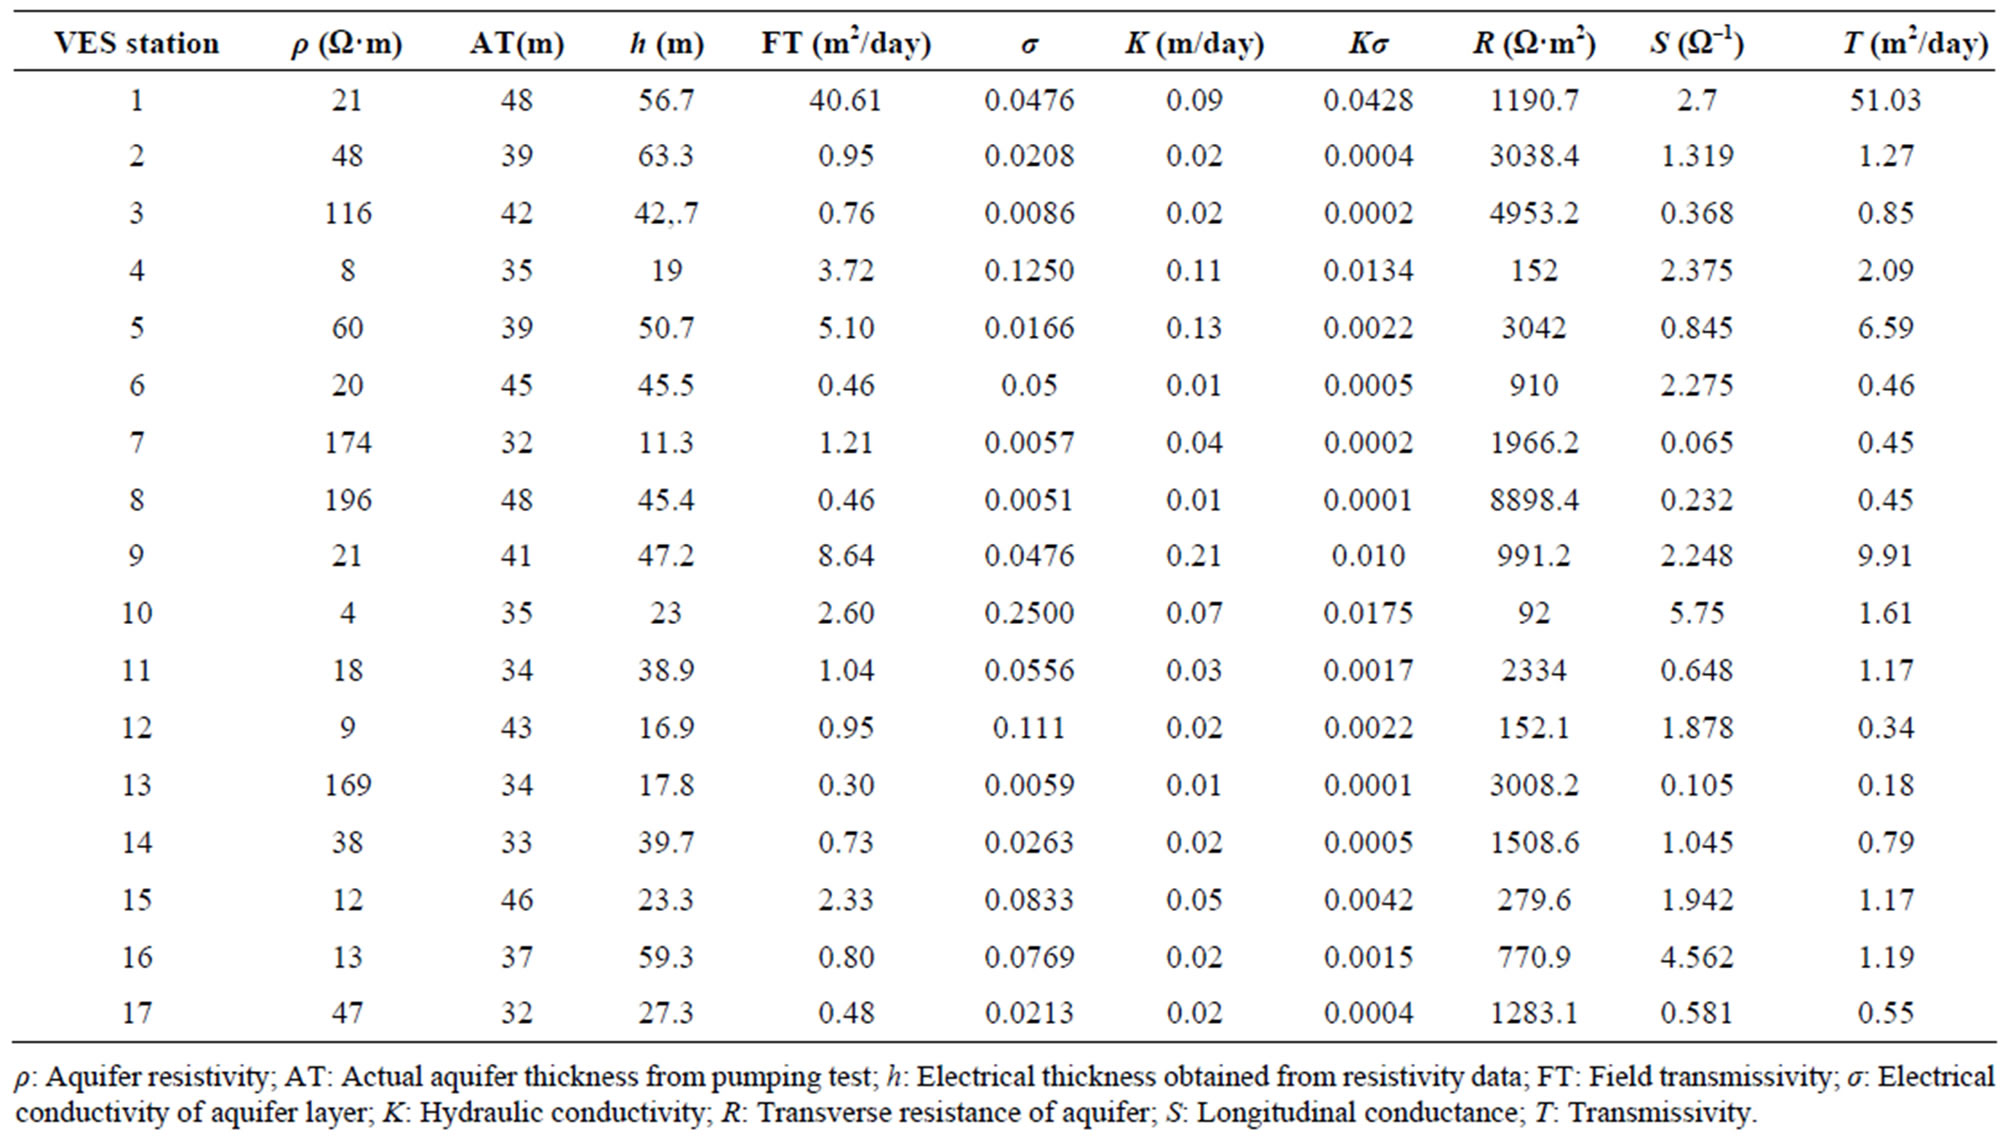
Table 2. Results of the electrical resistivity surveys in the study area.
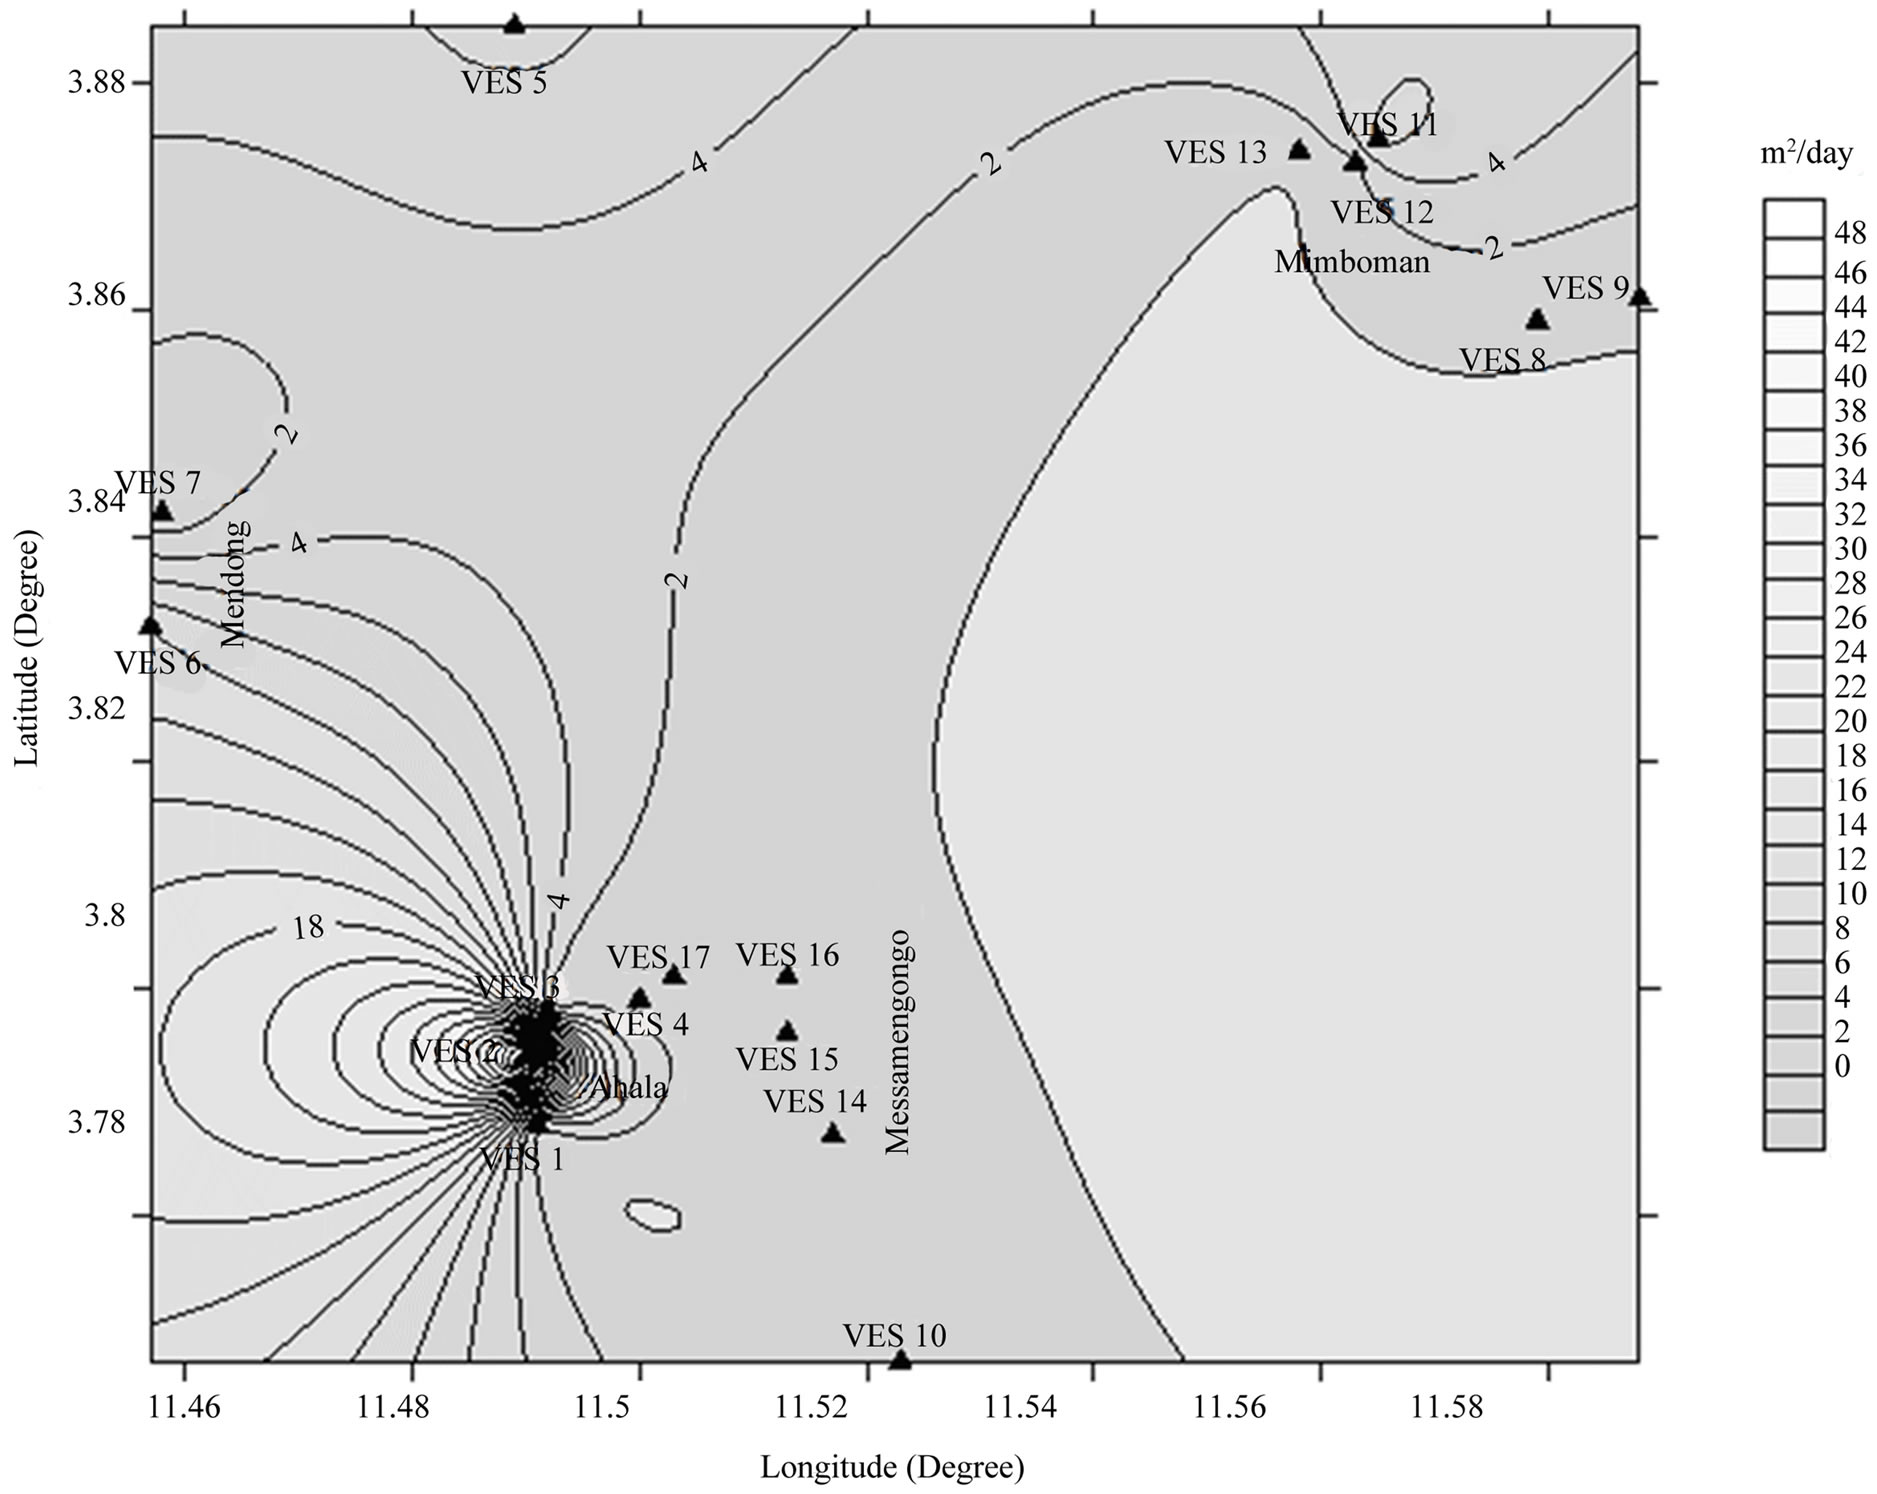
Figure 5. Iso-transmissivity map.
m2/day in point VES 1, with an average of 5.06 m2/day and a standard deviation of 12.15 m2/day summarized in Table 3" target="_self"> Table 3.
Figure 6 shows the variation map of the product Kσ of the study area, where the values of this parameter range between 1 × 10⁻⁴ and 428 × 10–4 with an average of 57 × 10–4 and standard deviation of 10 × 10–4.
Comparison of Figure 4 with Figure 5" target="_self"> Figure 5 shows that areas underlain by relatively thick aquifer materials have higher transmissivity values than areas underlain by relatively thin aquifer materials. This relationship is expected, because transmissivity is a function of aquifer thickness, since hydraulic conductivity is assumed constant.
The transverse resistance R, has also been computed for the interpreted seventeen VES using the following Equation (2). The transverse resistance is one of the DarZarrouk parameters, which has been shown to be a powerful tool in the interpretation of groundwater survey data [17]. The results of R are also shown in Table 2, and the distribution of this parameter in the study area is shown in Figure 7. Transverse resistance of any subsurface geological formation is given by the product of resistivity
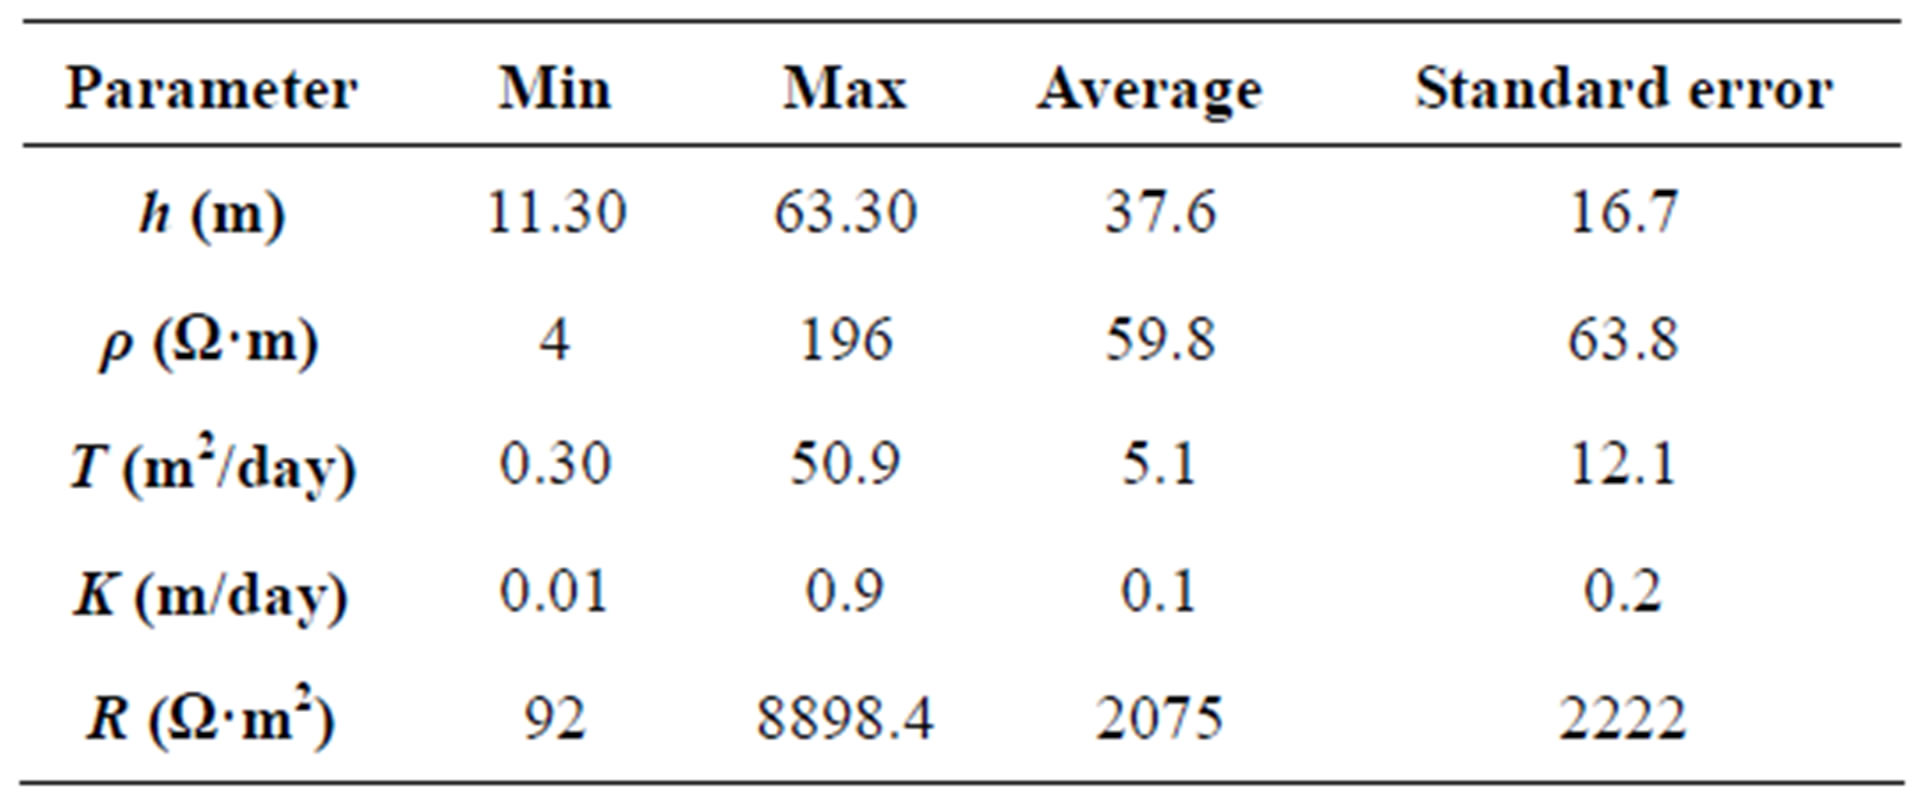
Table 3. Geophysical and hydraulic parameters of the aquifer in the Yaounde area.
and thickness. A geological formation reflecting a predominantly high transverse resistance value indicates that its resistivity is high or it has higher thickness with favorable aquifer conditions. The aquifer in the study area reflects higher transverse resistance, so it has high transmissivity with good groundwater potential. The transmissivity values obtained from electrical resistivity measurements depend upon the accuracy of hydraulic conductivity resulting from computation using the resistivity method.
Comparing the values of transmissivity calculated by
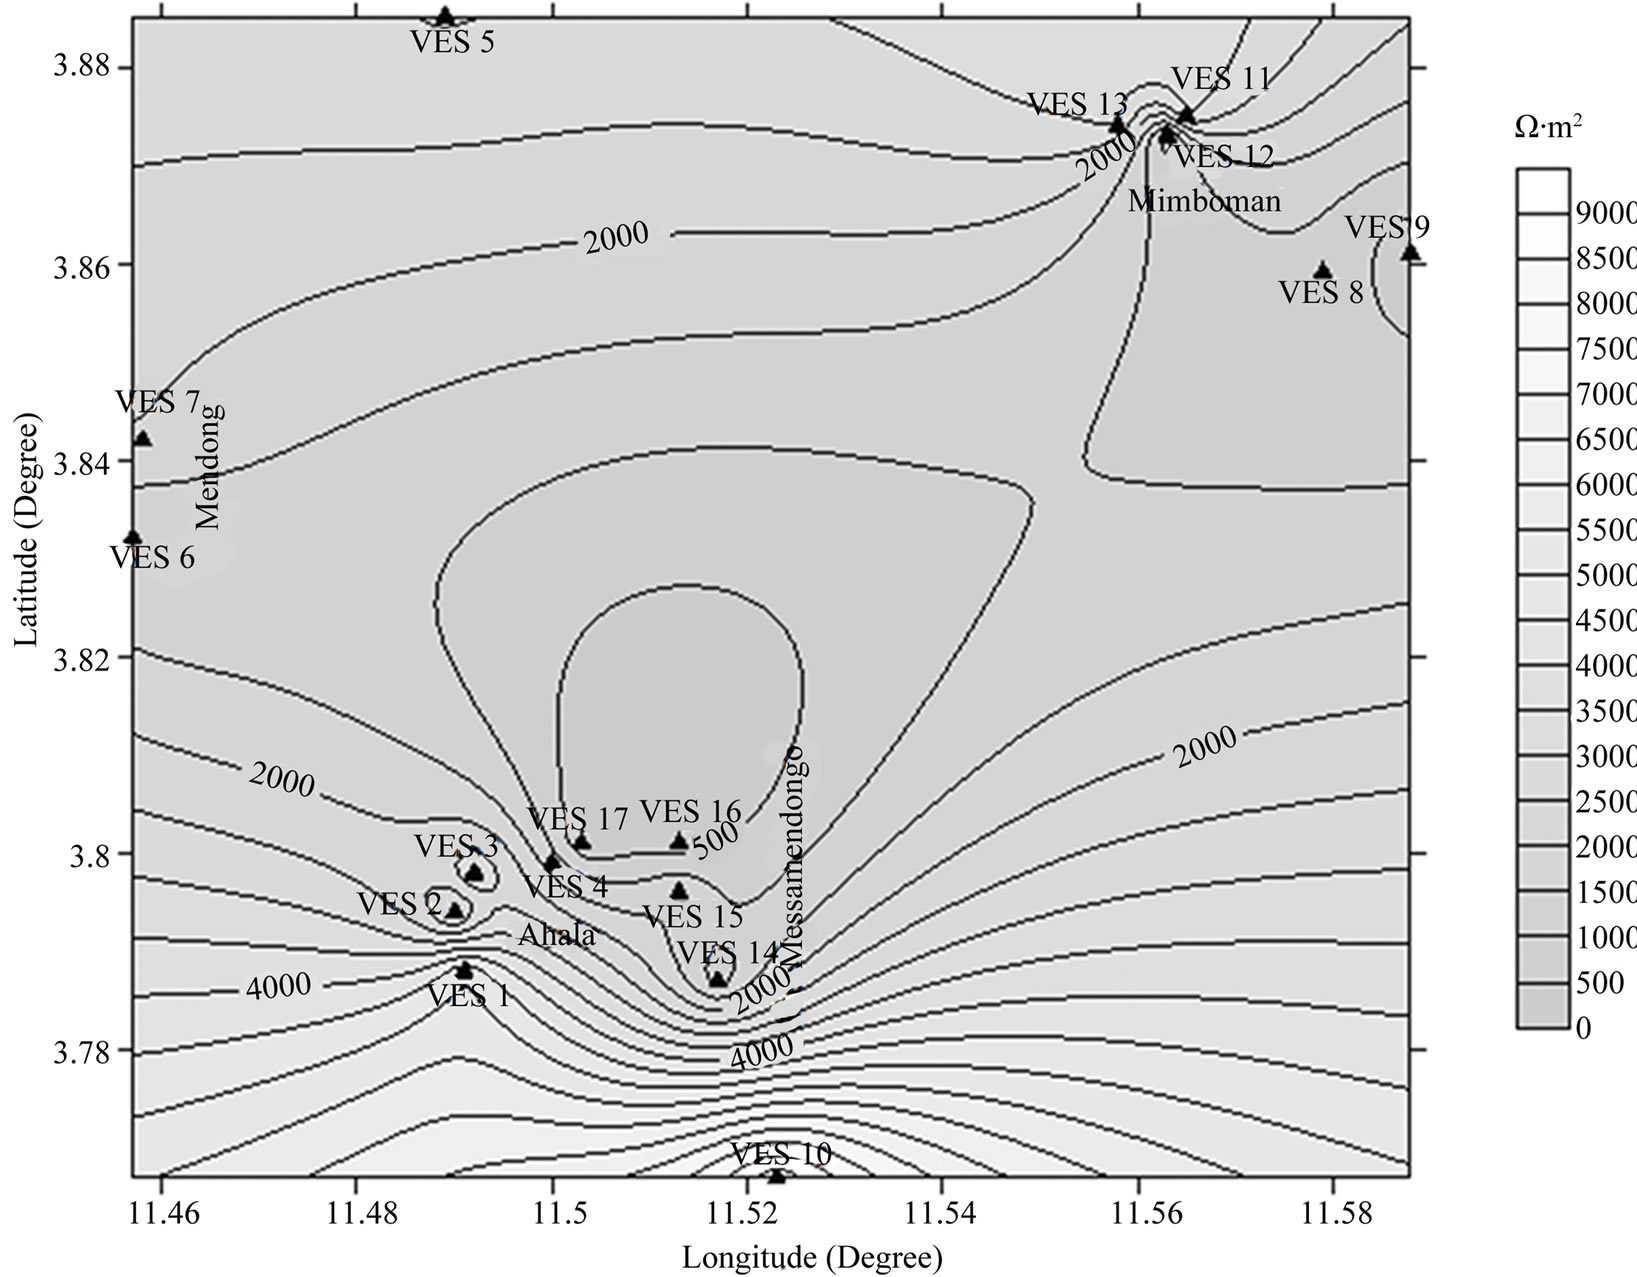
Figure 6. Iso-transverse resistance map.
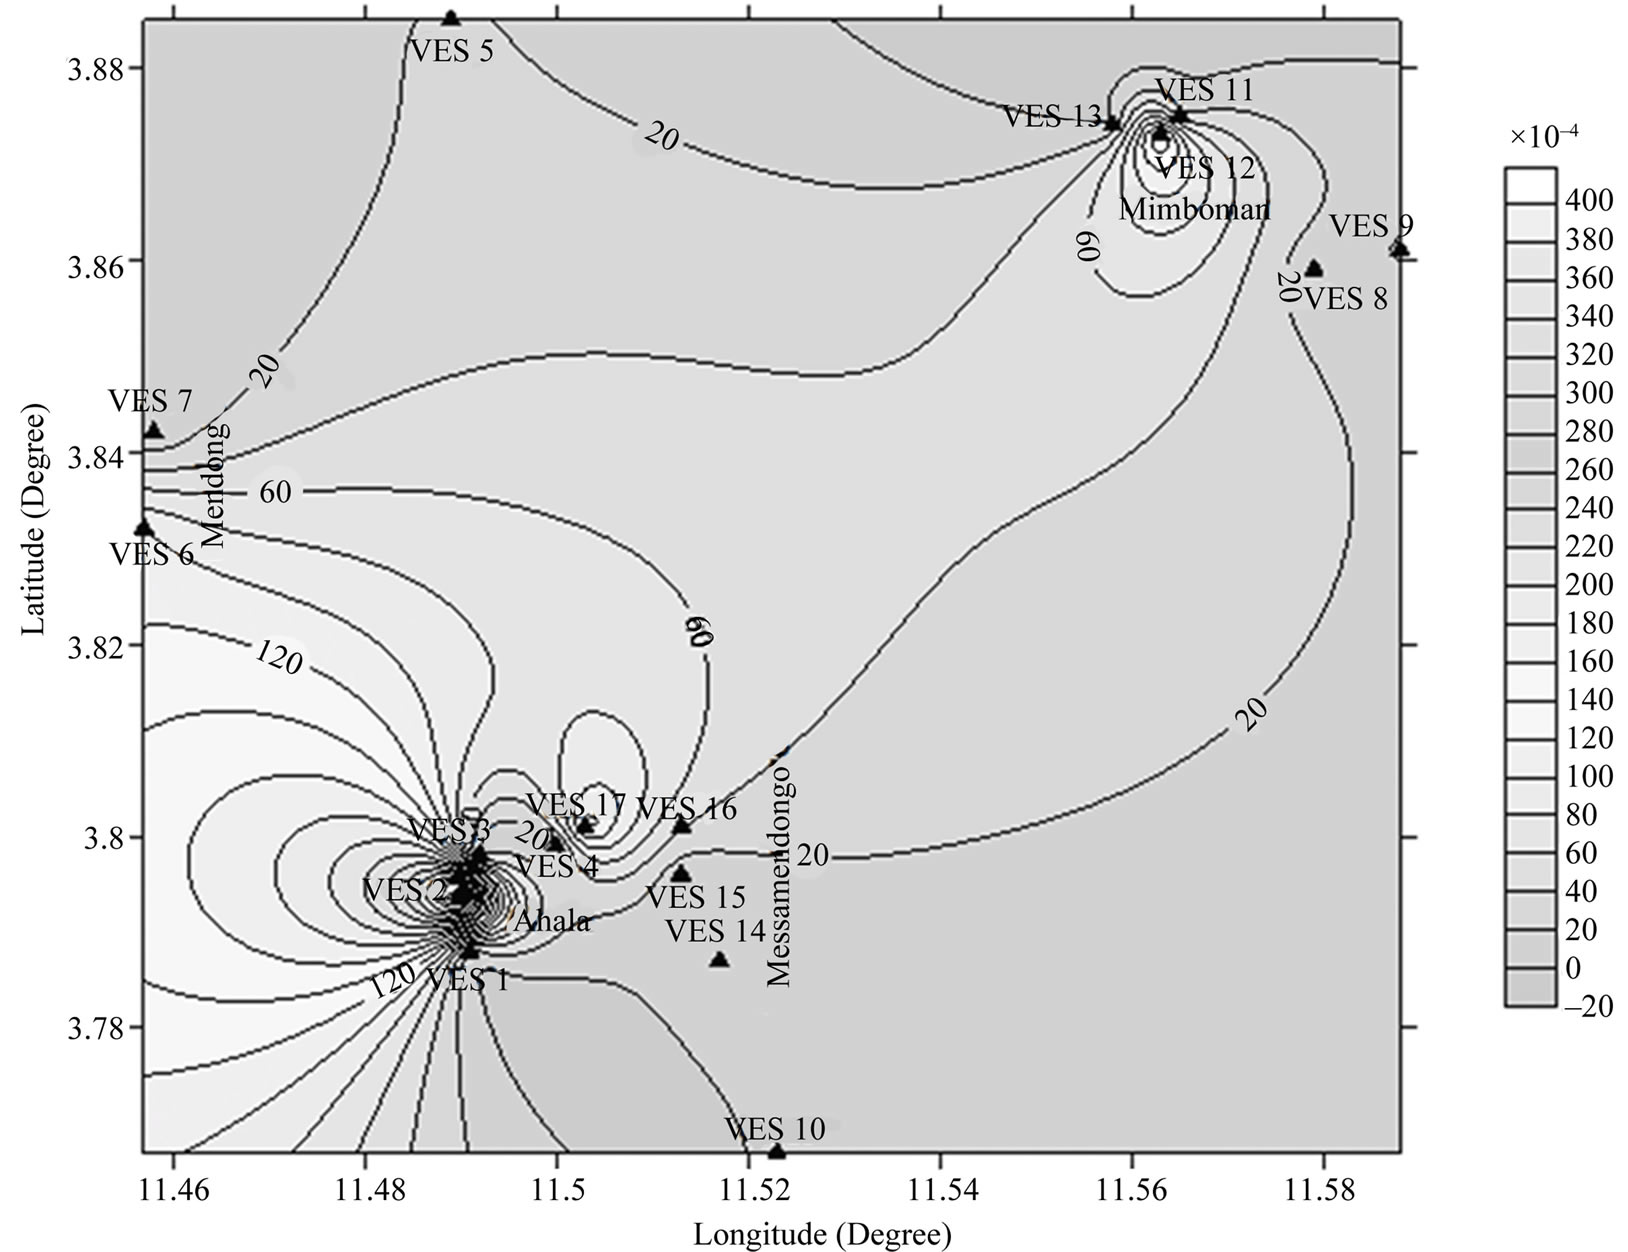
Figure 7. Variation map of the product Kσ.
electrical resistivity with field measured transmissivities, a good result is obtained (Table 2). These aforementioned relationships can be utilized to determine the transmissivity of the aquifer at other sites in the area. It can be concluded that equation 6 presents a viable analytical relation to estimate the aquifer transmissivity from transverse resistance in an area if hydraulic conductivity of the aquifer at any site is known [6]. From previous discussion, it may be concluded that, knowing the transverse resistance R at VES locations allows the determination of the transmissivity T and hydraulic conductivity parameter K, at points where no water resistivity samples are available. The VES technique has been very popular due to its simplicity. The weaknesses are the unsuitability of VES in areas with complex geology and topography.
The VES technique has been very popular due to its simplicity. The weaknesses are the unsuitability of VES in areas with complex geology and topography.[13] When an aquifer is anisotropic, empirical correlations between aquifer hydraulic conductivity and electrical resistivity will include a dependence on degree of anisotropy. Ignoring the anisotropy, scatter may be introduced into the field relationships [18]. The scale of the heterogeneity related to the sounding curves and pumping tests complicates the interpretation. It is pointed out that the reliability of the previously mentioned methods depends on the accuracy of the geoelectric parameters determined from the sounding curves, as well as the accuracy of the hydraulic parameters calculated from pumping tests. Estimated parameters in the study area show that the aquifer units indicate very poor to moderately permeability. It is however recommended that a hydro chemical study be carried out to determine the portability of the water for both industrial and domestic uses.
5. Conclusion
Application of vertical electrical sounding technique (VES) is developed and oriented towards computing of the aquifer hydraulic conductivity and the transmissivity of Yaoundé, Cameroon. The approach shows that evaluation of hydraulic conductivity K from surface resistivity measurements is possible, through developing relationships between the electrical Dar-Zarrouk parameters of R or S and hydraulic conductivity from available pumping tests. The transmissivity map derived by applying the proposed technique gives an idea about the potential distribution of the aquifer in the area, where a maximum transmissivity of 50.96 m2/day was obtained. The calibrated empirical relationship established between transverse resistance and transmissivity is a good tool for estimating hydraulic conductivity at the measured VES points even in the case when no water resistivity samples are available. The use of geoelectrical sounding provides an inexpensive technique for calculating the hydraulic parameters and characterizing the aquifer system of the area.
REFERENCES
- W. F. Schwartz and H. Zhang, “Fundamentals of Groundwater,” John Wiley Press, New York, 2003.
- L. Hamill and F. G. Bell, “Groundwater Resources Development,” Butterworths, London, 1986.
- J. Asfahani, “Neogene Aquifer Properties Specified through the Interpretation of Electrical Sounding Data, Salamiyeh Region, Central Syria,” Hydrological Processes, Vol. 21, No. 21, 2007, pp. 2934-2943. doi:10.1002/hyp.6510
- S. Scarascia, “Contributions of Geophysical Methods to the Management of Water Resources,” Geoexploration, Vol. 14, No. 3-4, 1976, pp. 265-266. doi:10.1016/0016-7142(76)90026-0
- E. W. Kelly, “Geoelectric Sounding for Estimating Aquifer Hydraulic Conductivity,” Ground Water, Vol. 15, No. 6, 1977, pp. 420-424. doi:10.1111/j.1745-6584.1977.tb03189.x
- S. Niwas and C. D. Singhal, “Estimation of Aquifer Transmissivity from Dar-Zarrouk Parameters in Porous Media,” Journal of Hydrology, Vol. 50, 1981, pp. 393- 399. doi:10.1016/0022-1694(81)90082-2
- S. Niwas and C. D. Singhal, “Aquifer Transmissivity of Porous Media from Resistivity Data,” Journal of Hydrology, Vol. 82, No. 1-2, 1985, pp. 143-153. doi:10.1016/0022-1694(85)90050-2
- O. Mazáč, E. W. Kelly and I. Landa, “A Hydrogeophysical Model for Relation between Electrical and Hydraulic Properties of Aquifers,” Journal of Hydrology, Vol. 79, No. 1-2, 1985, pp. 1-19. doi:10.1016/0022-1694(85)90178-7
- E. Y. Abdelhady, E. Morsy and M. S. Hanafy, “Geoelectric Resistivity Sounding for Groundwater Evaluation: Two Field Examples,” Egyptian Geophysicist Society Journal, Vol. 2, 2004, pp. 61-68.
- H. Mvondo, J. W. S. Den Brok and J. M. Ondoa, “Evidence for Symmetric Extension and Exhumation of Yaounde Nappe (Pan-African Fold Belt, Cameroon),” Journal of African Earth Sciences, Vol. 3, No. 6, 2003, pp. 215-231. doi:10.1016/S0899-5362(03)00017-4
- G. E. Ekodeck and B. V. K. Kabayene, “L’altérologie Normative et ses Applications: Une Expression Particulière de la Pétrologie des Roches Aluminosilicatées du Point de vue de Leur Evolution Supergène,” Presses Universitaires de Yaoundé, Tome 2, 2002, pp. 225-231.
- T. Ngnotué, J. P. Nzenti, P. Barbey and F. M. Tchoua, “The Ntui-Betamba High-Grade Gneisses: A Nordward Extension of the Pan-African Yaounde Gneisses in Cameroon,” Journal of African Earth Sciences, Vol. 3 No. 1, 2000, pp. 369-381. doi:10.1016/S0899-5362(00)00094-4
- W. A. Teikeu, P. N. Njandjock, T. Ndougsa-Mbarga and T. C. Tabod, “Geoelectric Investigation for Groundwater Exploration in Yaoundé Area, Cameroon,” International Journal of Geosciences, Vol. 3, No. 3, 2012, pp. 640-649. doi:10.4236/ijg.2012.33064
- H. B. D. Tchapnga, E. Tanawa, E. Temgoua, J. Siakeu and B. N. Massana, “Mode de Circulation, Mécanismes de Recharge et Temps Relatifs de Séjour des Eaux des Nappes Souterraines des Altérites du Milieu Cristallin: Cas du Bassin Versant de L’Anga’a, Yaoundé, Cameroun,” Presses Universitaires de Yaoundé, 1999, pp. 117- 126.
- M. Pirttijärvi, “Joint Interpretation of Electromagnetic and Geoelectrical Soundings Using 1-D Layered Earth Model, User’s Guide to Version 1.3,” Oulu, 2009, 48 p.
- P. S. Neumann, P. G. Walter, W. H. Bently, J. J. Ward and D. D. Gonzales, “Determination of Horizontal Anisotropy with Three Wells,” Groundwater, Vol. 22, No. 1, 1984, pp. 66-72. doi:10.1111/j.1745-6584.1984.tb01477.x
- A. A. R. Zohdy, P. G. Eaton and R. D. Mabey, “Application of Surface Geophysics to Groundwater Investigations,” US Geological Survey Technology and Water Resources Investigation, Book 2, 1974.
- E. W. Kelly and F. P. Reiter, “Influence of Anisotropy on Relation between Aquifer Hydraulic and Electrical Properties,” Journal of Hydrology, Vol. 74, No. 3-4, 1984, pp. 311-321. doi:10.1016/0022-1694(84)90021-0
- G. C. de Ribes and M. Aubague, “Carte Géologique de Réconnaissance au 1/500,000, Notice Explicative sur la Feuille Yaoundé-Est,” Direction des Mines et de la Géologie, Yaoundé, Cameroon, Imprimerie Rédon, Paris, 1956.
NOTES
*Corresponding author.