Natural Science
Vol.5 No.7(2013), Article ID:34112,11 pages DOI:10.4236/ns.2013.57097
The reaction of the iron thiosulfate-nitrosyl complex with adenosine triphosphoric acid
![]()
Institute of Problems of Chemical Physics, Russian Academy of Sciences, Chernogolovka, Russia; *Corresponding Author: easar@icp.ac.ru
Copyright © 2013 Elena A. Saratovskikh et al. This is an open access article distributed under the Creative Commons Attribution License, which permits unrestricted use, distribution, and reproduction in any medium, provided the original work is properly cited.
Received 6 April 2013; revised 7 May 2013; accepted 15 May 2013
Keywords: Adenosine Triphosphoric Acid; Thiosulfate-Nitrosyl Iron Complex; Nitrogen Monoxide Donors; Fluorescence; Kinetic model; Reaction Rate Constants; Iron(II) Complexes; Iron(III) Complexes
ABSTRACT
Iron tetranitrosyl complex bearing the thiosulfate ligand (TNIC) is an efficient nitrogen monoxide donor (NO). He shows antitumor properties and may be used as an original drug for the therapy of acute coronary syndrome. In this work, the reaction of the TNIC with adenosine triphosphoric acid (ATP) was studied. Formation of the products for the reaction of ATP with TNIC was shown by electronic microscopy. The kinetics of the reaction was controlled by spectrofluorometric method, and the complexation constant was measured. The mechanism of interaction of ATP with TNIC was proposed, and the relevant kinetic model satisfactorily described the experimental data, which permitted to calculate the rate constants for these process stages. NMR, IR, and Mössbauer studies were used for determination of the reaction product structure. NMR study showed TNIC interaction only with adenine part of ATP. The method of IR spectroscopy identified both the absence NO in the reaction products and the occurrence of new Fe-S and Fe-N bonds. Mössbauer study showed that iron in the reaction products was presented by two forms: Fe(II) and Fe(III). Thus, the structures for the [ATP-Fe2+S] and [ATP-Fe3+S] complexes were proposed.
1. INTRODUCTION
It is known that adenosine triphosphoric acid (ATP) is of vital importance in the energy and substance metabolism in organisms: the molecule of ATP contains two high energy bonds and serves as a universal energy source for a great number of energetically expensive biochemical and physiological processes [1].
Such an important role, ATP in an organism predetermines attention to this nucleotide from biologists and physicians. In recent years, the development of cellular and molecular biology favored deeper insight into the essence of myocardial trophic processes upon chronic cardiac insufficiency. These studies show that the mechanisms of cardiac dysfunction involve structural and functional remodeling not only of all compartments of the cardiovascular system (heart, arteries, and veins) but also of all tissue and cellular levels and elements (cardiomyocytes, smooth muscle cells, endothelium, extracellular matrix, membrane proteins, intracellular organelles, messenger systems, etc.) [2]. In particular, the study of the regulation mechanisms of energy metabolism and stabilization of the ATP level in cells upon different forms of cardiovascular, lung, and blood diseases, as well as the study of the ageing and other processes are of current interest for modern biology and medicine [3-7].
Interest in the iron complexes is caused by the fact that many of them (e.g., Fe(III) complexes with nicotinamide) are drugs [8] or potential drugs [9-11]. In the present work, we studied the nitrosyl iron complex with sodium thiosulfate Na2[Fe2(S2O3)2(NO)4]∙4H2O (TNIC) (1). This complex is an efficient donor of nitrogen monoxide [11, 12] and exhibits potential therapeutic activity [10,11]. For example, it has been shown ex vivo and in vivo for the models of the myocardial ischemic and reperfusion injury of the Wistar rats [10] that 1 possesses a vasodilating effect, which is manifested in an efficient recovery of coronary flow and a decrease in the systolic blood pressure. This complex improves recovery, metabolism (in this case, the ATP level is 1.7-fold higher than that in the control), and cardiac function after ischemia and decreases the size of myocardial infarction without arrythmogenic action, which can result in the death of experimental animals. The obtained data allow one to consider that this complex can be used as an original drug for the therapy of acute coronary syndrome.
It was established, in particular, that complex 1 has antitumor properties [11,13].
When energy metabolism is violated by newly formed oncological changes, ATP blocking should favor cancer cell decay. Thus, it is very important to know how the potential drug (complex 1 or its intermediates) interacts with ATP. The study of the complex formation of these substances makes it possible to obtain additional information about the ability of 1 to inhibit the energy component of uncontrolled oncological cell division and mechanisms of action of the nitrosyl iron complexes.
It is known [14] that the Fe(III) complexes are able to form stable chemical bonds with ATP. All these facts cause fundamental interest in the behavior of 1 towards the major macroergic compound, “key unit” of energy metabolism, viz., ATP, and in the study of intermediates produced.
The purpose of this work is to study the reaction of ATP with TNIC, which is promising nitrogen monoxide donor, to reveal the mechanism of this reaction, and to identify the reaction products.
2. MATERIAL AND METHODS
2.1. Used Substances, Concentrations and Replicates
The commercially available ATP, Na2S2O3∙5H2O, and FeSO4∙7H2O (99% purity, Sigma) were used as purchased.
Complex Na2[Fe2(S2O3)2(NO)4]∙4H2O (TNIC) (1) was synthesized according to a published procedure [15].
All experiments were carried out in a buffer with pH 6.8 (0.025 М), and the latter was prepared using Tris∙HCl (Sigma).
The reaction products of ATP with complex 1 provided for the subsequent physicochemical analyses were obtained by pouring together solutions of ATP and complex 1 ([ATP] = [1] = 0.96 × 10⁻⁴ mol∙L−1, T = 25˚C). The mother liquor was poured from the precipitate formed in the reaction. Then the precipitate was washed with water and dried at T ≤ 30˚C - 35˚C.
2.2. Investigation of the Kinetic Regularities
Spectrofluorometric measurements were carried out on a Perkin-Elmer LS-55 spectrofluorimeter. A known procedure [14] was used for the study of the reaction of ATP with the nitrosyl iron complex. The fluorescence excitation wavelength was λex = 290 nm, 3 - 3.5 mL quartz cells were used, the optical path length was 1 cm, and the temperature was 20˚C. The fluorescence emission maximum was at λ = 388 nm. The range of working concentrations of ATP was determined experimentally. The linear variation in the fluorescence emission intensity is in the range of ATP concentrations from 2.0 × 10⁻⁴ to 0.1 × 10⁻⁴ mol∙L−1.
The studied compounds Na2S2O3∙5H2O, FeSO4∙7H2O, and 1 have no intrinsic fluorescence.
The effects of Na2S2O3, 1, and FeSO4 on the change in the fluorescence of ATP were studied by continuous spectrofluorimetric titration. Titration of a solution (3 mL) of ATP with a solution of the compound under study was performed in a measuring cell, and the value of fluorescence emission was measured in the wavelength range of λ = 380 - 390 nm. A fluorescence spectrum was recorded after the addition of each subsequent portion of a quenching agent. The time from the addition of a quencher to spectrum recording was not longer than 10 - 15 s. The time of recording the fluorescence value in the emission wavelength range of λ = 380 - 390 nm was also not longer than 10 - 15 s. The starting concentration of ATP was 0.959 × 10⁻⁴ mol∙L−1. The starting concentration of Na2S2O3 was 0.887 × 10⁻² mol∙L−1. The starting concentration of FeSO4 was 0.953 × 10⁻² mol∙L−1. The starting concentration of 1 was 1.019 × 10⁻² mol∙L−1. A solution of a quencher was added by portions of 0.05 mL.
The change in the fluorescence intensity of ATP under the action of 1 was measured at each initial time point at different starting concentrations of 1. Eight cells containing a solution (3 mL) of ATP with a concentration of 0.901 × 10⁻⁴ mol∙L−1 were used in the experiments. Different volumes of a solution of 1 with the starting concentration 1.007 × 10⁻² mol∙L−1 were added successively to each cell. After the addition of 1, the fluorescence value was recorded at λ = 380 - 390 nm. Then, another portion of 1 was added to the next cell, the fluorescence intensity was recorded, etc. The time from the preparation of a working solution of 1 to its addition to a solution of ATP did not exceed 1 min. The time between the measurements in different cells did not exceed 40 - 60 s.
2.3. Spectrometric Measurements
2.3.1. Electronic Absorption Spectra
Electronic absorption spectra were recorded on a Perkin-Elmer UV-VIS Spectrometer Lambda EZ 210 spectrophotometer. Absorption spectra at different concentration of ATP were recorded with compensation, using the Tris∙HCl (pH 6.8) buffer for compensation.
2.3.2. NMR Spectra
1H, 13C, and 31P NMR spectra were recorded on a high-resolution AVANCE III 500 MHz spectrometer
(Bruker, Germany). Samples of ATP, complex 1, and complex [ATP-1] were studied. Deuterated water (D2O), DMSO, and CCl4 were used for the dissolution of the samples. 1D, 1H (working frequency 500 MHz), 13C (working frequency 126 MHz), and 31P NMR (working frequency 202 MHz) spectra were recorded at ambient temperature. The concentrations of solutions were 1.8 × 10⁻¹ (ATP) and 1.7 × 10⁻¹ mol∙L−1 (1).
1H NMR of ATP (D2O), δ: 8.48 (s, 1H, -N-CH = N), 8.33 (s, 1H, -N-CH = N), 6.00 (d, 1H, -N-CH-O-, J = 5.2 Hz), 4.57 (m, 1H, -CH-OH), 4.46 (m, 1H, -CH-OH), 4.35 (m, 1H, -CH-O-), 4.26 (m, 2H, -CH2-O-).
31P NMR of ATP (D2O), δ: −10.56 (1P, O = P-(OH)2), −11.13 (1P, O = P-(O)-OH), −22.57 (1P, O = P-(OH)2).
1H NMR of ATP + 1 (D2O), δ: 8.37 (br.s, 2H, -NCH = N), 5.97 (br.s, 1H, -N-CH-O-), 4.65 (br.s, 5H, -CH-, -CH2-).
31P NMR of ATP + 1 (D2O), δ: −10.72 (2P, O = P-(OH)2, O = P-(O)-OH)), −22.57 (1P, O = P-(OH)2).
2.3.3. Mössbauer Spectra
Mössbauer absorption spectra were recorded on a WissElsetup instrument (Germany) operating in the constant acceleration mode. The radiation source was 57Co in the Rh matrix at ambient temperature. Measurements at low temperatures were carried out using a temperature-controlled CF-506 flow-type helium cryostat (Oxford Instruments, Great Britain). The Mössbauer spectra were processed by the least-squares method under the assumption of the Lorentz shape of the absorption components.
2.3.4. Infrared Spectra
IR spectra in the range from 100 to 4000 cm−1 were recorded on a Nicolet Magna 750 FT-IR spectrophotometer (Nicolet, USA). Pellets with KBr were studied in the range from 4000 to 400 cm−1. Suspensions in Nujol were studied in the range from 600 to 100 cm−1. The spectrum of ATP and band assignment corresponded to the published data [16]. The absorption bands of complex 1 and the reaction products were assigned using the literature data [17-19].
The iron content was determined by atomic absorption spectrophotometry in the flame of an acetylene-air mixture using the deuterium corrector of the background on an AAS-3 atomic absorption spectrophotometer (Carl Zeiss Jena, Germany). A lamp with a hollow cathode was used. Iron was determined at the resonance line λ = 248.3 nm.
2.4. The Elemental Analysis
The contents of carbon, hydrogen, nitrogen, and sulfur were determined on a Vario MICRO cube CHNS/O elemental analyzer (Elementar GmbH, Germany). This analyzer makes it possible to simultaneously determine the contents of C, H, N, and S in substances by the combustion method at 1150˚C in the presence of neat oxygen followed by the reduction of oxides and their separation on a chromatographic column. The signal from each component was detected by a thermal conductivity detector. The oxygen content was determined with the same instrument by the pyrolysis method followed by CO determination.
Phosphorus in the form of a phosphorus-vanadiummolybdenum complex was determined spectrophotometrically after the sample was dissolved in a mixture of HCl, HNO3, and HClO4 acids. The light absorption of the complex was measured at λ = 400 nm on a LAMBDA 45 spectrophotometer (Perkin Elmer, USA).
3. KINETIC STUDY OF THE INTERACTION OF ATP WITH TNIC
3.1. Preliminary Measurements
Preliminary studies were carried out to prove that ATP is a single fluorescent compound in the system and to prove the purity of working solutions of the fluorescing agent. For this purpose, the absorption spectra and fluorescence excitation spectra of ATP were recorded (Figure 1). The absorption spectrum of ATP has a maximum at λ = 275 nm and its fluorescence excitation spectrum has a maximum at λ = 280 nm. Since these spectra are very close to each other, it is possible to claim that, under the experimental conditions, the change in the fluorescence intensity corresponds to that of the ATP fluorescence, and ATP is a single fluorescing compound present in the solution.
3.2. Interaction of TNIC with ATP
Figure 2 shows the typical fluorescence spectra of ATP. As can be seen, the position of the fluorescence maximum does not change with a decrease in the 1 concentration in a solution. In this case, the decrease in the fluorescence emission intensity is related to a decrease in the concentration of the luminous substance, viz., ATP.
The effects of 1, sodium thiosulfate (Na2S2O3), and iron (II) sulfate (FeSO4) (the starting compounds for the synthesis of the complex) on the fluorescence intensity of ATP were studied. It was shown that all compounds under study decrease the fluorescence intensity of ATP (Figure 3). It is obvious that, in all cases under consideration, due to low working concentrations of the compounds under study (~10−4 mol∙L−1), the decrease in the fluorescence intensity of ATP is a result of the chemical reaction of the compound with ATP. This leads to a decrease in the concentration of free ATP molecules in the
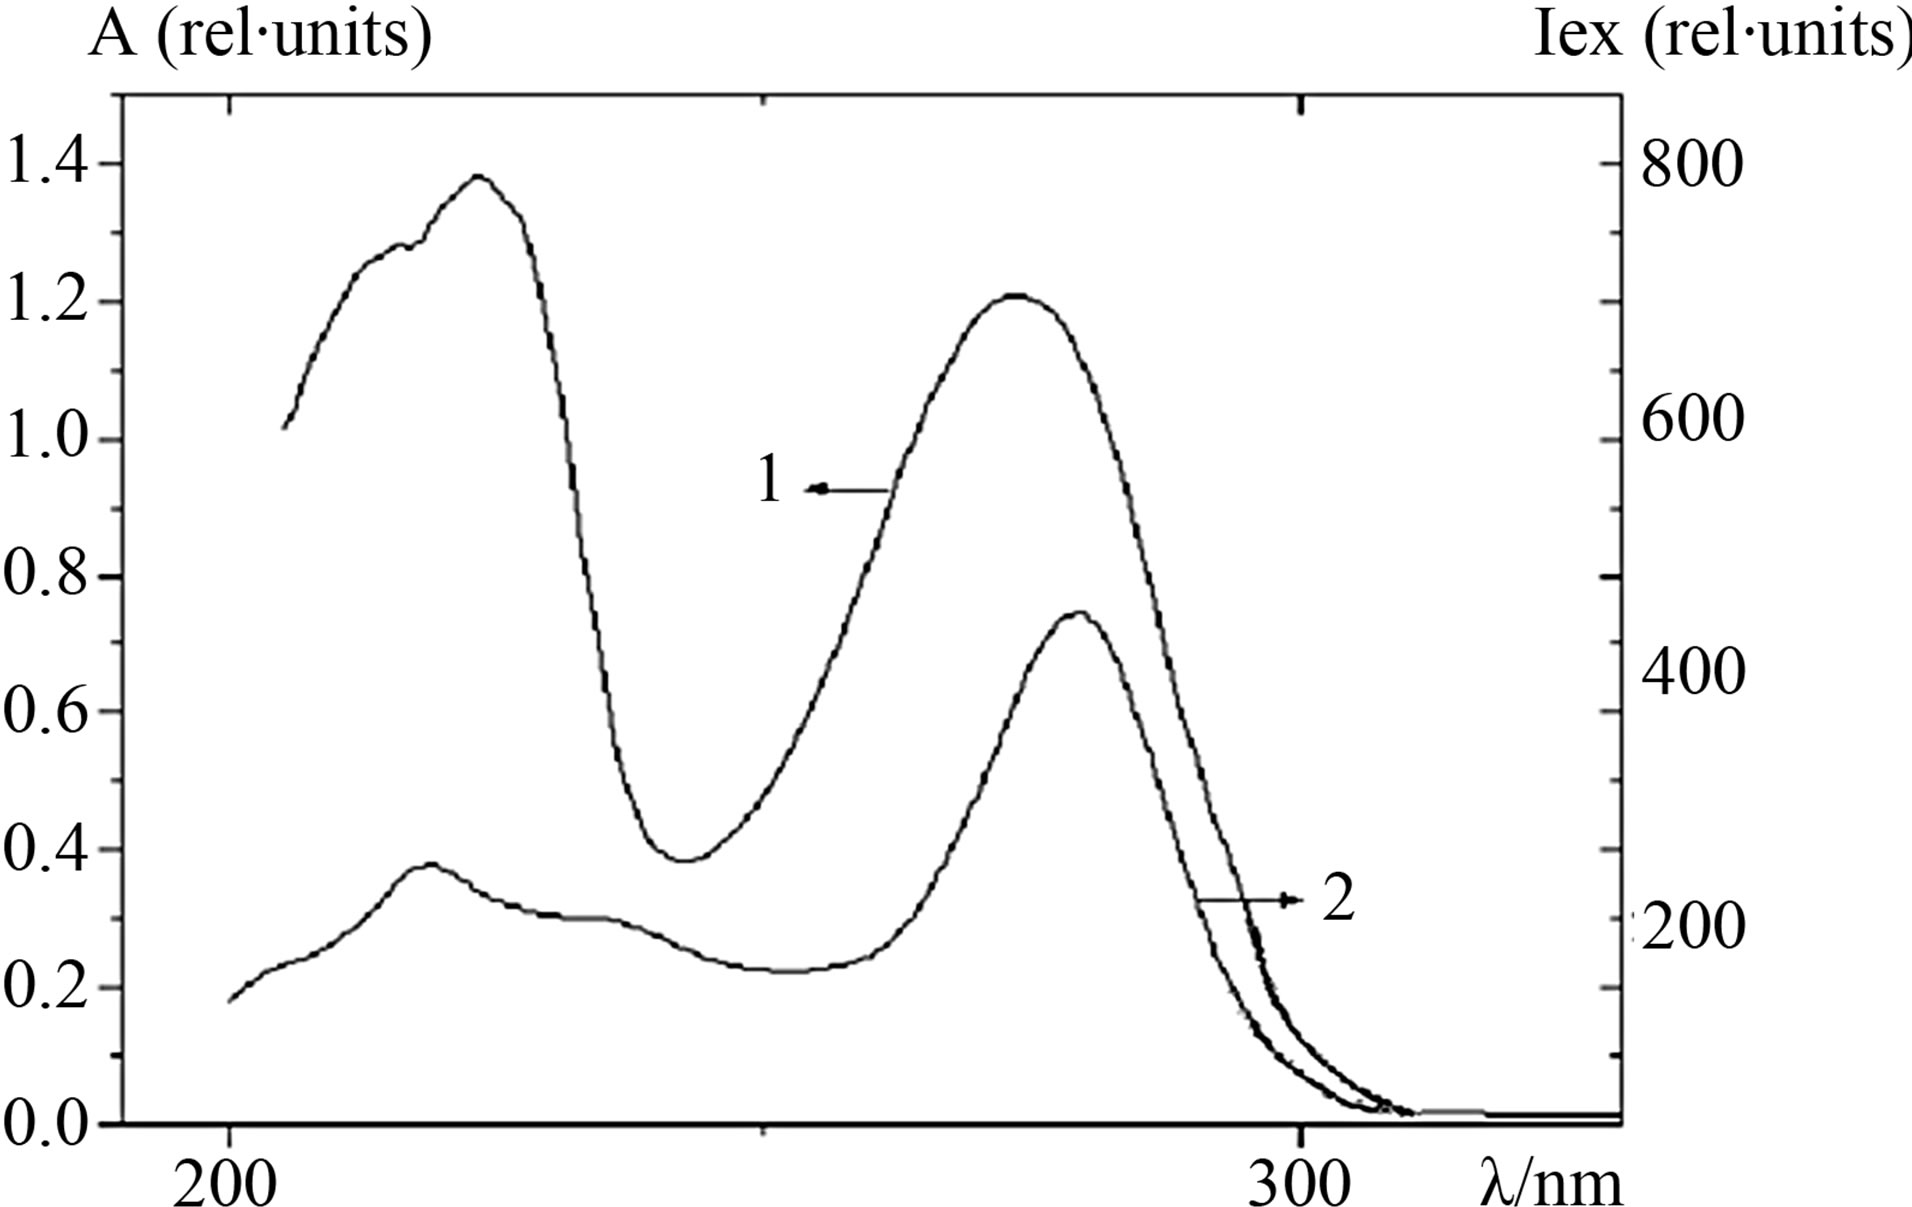
Figure 1. The absorption (1) and fluorescence excitation (2) spectra of ATP (c = 0.9014 × 10⁻⁴ mol∙L−1) in the Tris∙HCl buffer (pH 6.8).

Figure 2. The fluorescence spectra of ATP in the Tris∙HCl buffer (pH 6.8) at the excitation wavelength λex = 290 nm at the concentrations: 1.66 × 10⁻² (1), 8.33 × 10⁻³ (2), 1.52 × 10⁻⁴ (3), 7.61 × 10⁻⁵ (4), 6.84 × 10⁻⁵ (5), 6.08 × 10⁻⁵ (6), 5.067 × 10⁻⁵ (7), 3.55 × 10⁻⁵ (8), and 2.53 × 10⁻⁵ mol∙L−1 (9).
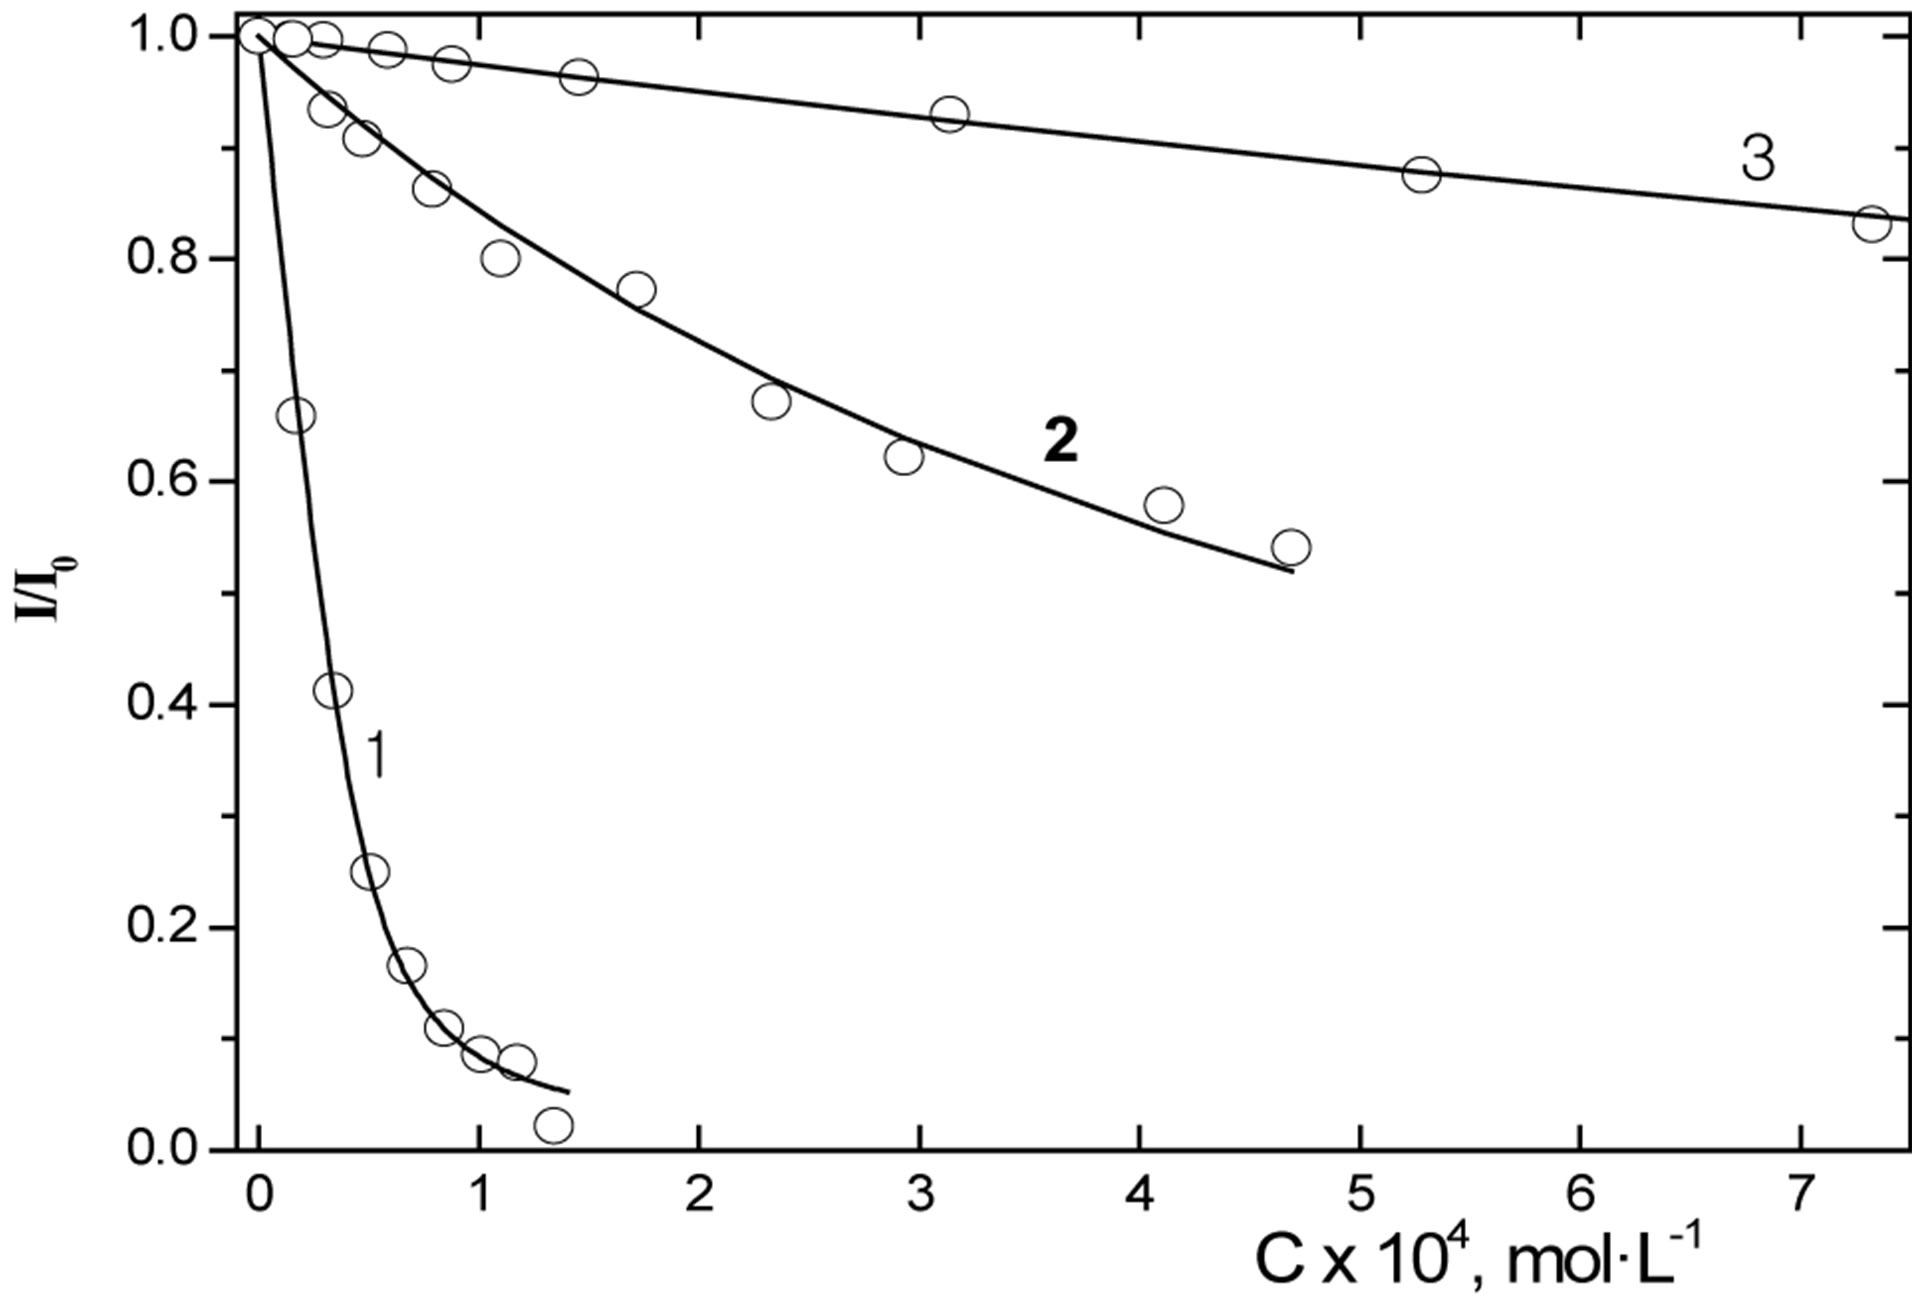
Figure 3. Changes in the fluorescence intensity of ATP depending on the concentrations of TNIC (1), FeSO4 (2), and Na2S2O3 (3). The points are experimental data and the curves are calculation data. The experimental conditions are given in Experimental.
excited state. The change in the fluorescence for the other reasons (for example, via the mechanism described by the Stern-Volmer equation [20]) is unlikely since requires higher concentrations of a quenching agent (1 - 0.1 mol∙L−1).
It follows from the experimental conditions that the reactions of the compounds under study with ATP occur more rapidly than within 10 s. A stable equilibrium is reached between the components of the system. It is seen from Figure 3, curves 2 and 3, that the starting compounds decrease the fluorescence intensity of ATP to a lesser extent than complex 1 does. Based on the data obtained, one can assume that ATP reacts with 1 and/or its dissociation products.
3.3. Electronic Spectra of the System
To confirm additionally the formation of new chemical compounds upon the reaction of ATP with 1, we studied the components of the system by electronic absorption spectroscopy. The absorption maximum of ATP (Figure 4, curve 1) is observed at 275 nm. The absorption spectrum of 1 has two well-defined separate maxima at 310 and 360 nm (Figure 4, curve 2).
The absorption spectrum of a mixture of ATP and 1 (see Figure 4, curve 3), similarly to the spectrum of pure 1, displays maxima at 310 and 360 nm. However, in contrast to the spectrum of ATP, the spectrum of the mixture exhibits a bathochromic shift of the maximum at 275 nm, which is typical of ATP, by about 20 nm. Thus, according to the changes in the electronic spectra, one can assume that 1 reacts with ATP.
3.4. Determination of Complexing Constants
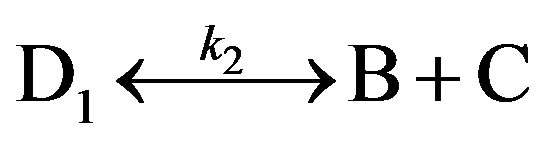
An analysis of the obtained experimental data was based on the available research data [11] indicating that the binuclear complex 1 undergoes the primary cleavage in protic media to form mononuclear dinitrosyl iron complexes [Fe(S2O3)NO2]− (DNICthio) (2). Then, 2 de-

Figure 4. Absorption spectra of the complex of ATP (1), TNIC (2), and a mixture of ATP and TNIC (3).
composes to the mononitrosyl complex and other hydrolysis products to evolve nitrogen monoxide into a solution. The structures of these intermediates were confirmed by mass spectroscopy [21] (Scheme 1).
The measurement of the decomplexation rate of 2 showed that its lifetime is significantly longer than the reaction time for the interaction of ATP with 2 found by spectrofluorimetry. Consequently, the reaction between ATP and 2 can be expressed as the kinetic equation:

where P is the reaction product, viz., complex [ATP-2], k1 and k−1 are the rate constants of the forward and reverse reactions, respectively, and K = k1/k−1 is the equilibrium constant or complexation constant of the complex [ATP-2].
The data from spectrofluorimetric titration allowed us to calculate the complexation constants (K) of 1, Na2S2O3, and FeSO4 with ATP, i.e., to determine the stability of their complexes with ATP presented in Table 1.
The highest K value was found for 1. The stability of its complex with ATP is by one order of magnitude higher than that for ferric sulfate and by four orders of magnitude higher than that for sodium thiosulfate. From the K values obtained, the theoretical curves given in Figure 2 were calculated. As it is seen, the calculated constant is in good agreement with the experimental results.
Obviously, the resulted difference in the K values reflects the chemical structures of the compounds. In the molecule of sodium thiosulfate, the sulfur and sodium atoms have no free valences for additional bonding. The dissociation of the S-S bond in a solution results in the formation of Na2S and (SO3)−. Probably, the former can form an ionic compound with the hydrogen atom of the terminal NH2 group of adenine. In a solution, FeSO4 dissociates also. Certainly, the degree of its dissociation is higher than that of Na2S2O3. The ability of iron to form coordination bonds is manifested in the reaction of ATP
 TNIC=сomplex 1; DNICthio= сomplex 2
Scheme 1. Dissociation of complex TNIC to DNICthio.

Table 1. Data on the complexation constants (K).
with 1. The three-order-of-magnitude difference in the K values for FeSO4 and 1 suggests the formation of a coordination compound.
3.5. Kinetic Measurements
The reaction kinetics was monitored by a change in the concentration of the starting substance ATP. The kinetic curves of ATP transformation at different initial concentrations of complex 1 are presented in Figure 5. At any initial concentration of complex 1, the shapes of the kinetic curves are identical: after the second reaction component (1) was introduced into the system, the fluorescence intensity decreased sharply. This indicates a rash decrease in the concentration of free ATP at the initial moment. The further behavior of the kinetic curves indicates a complicated mechanism of the interaction of ATP and complex 1.
As stated above, this is compound 2 that reacts with an ATP molecule. This interaction is reversible with a high rate, which is indicated by a sharp decrease in the ATP concentration at the initial moment (see Figure 5).
The formed complex [ATP-2] and the starting substances undergo further chemical transformations. As a result, a multicomponent system is formed in the solution.
3.6. Mathematical Model of the Process
Taking into account the qualitative behavior of the

Figure 5. Kinetic curves of ATP fluorescence changing at different initial concentrations of complex 1. Points are experiment, lines are the calculation from the found values of the reaction rate constants. Conditions: buffer 0.025 mol∙L−1 TrisHCl with pH 6.8; initial ATP concentration 0.90 × 10⁻⁴ mol∙L−1; initial concentrations of complex 1 in cells, mol∙L−1: 0.17 × 10⁻⁴ (1), 0.34 × 10⁻⁴ (2), 0.51 × 10⁻⁴ (3), 0.68 × 10⁻⁴ (4), 0.84 × 10⁻⁴ (5), 1.01 × 10⁻⁴ (6), 1.18 × 10⁻⁴ (7), and 1.34 × 10⁻⁴ (8).
experimental curves [ATP](t), the kinetic model for the interaction of complex 2 with ATP can be presented in the first approximation by the following reactions:
 (0)
(0)
 (1)
(1)
 (2)
(2)
 (3)
(3)
 (−3)
(−3)
 (4)
(4)
 (−4)
(−4)
where A is adenosine triphosphoric acid (ATP); D is mononuclear dinitrosyl iron complex 2; and D1, B, and C are the hydrolysis products of complex 1.
The kinetic model (0)-(−4) does not describe all details of the interaction of ATP with complex 2. In particular, the model ignores possible transformations of the product of the direct interaction of the starting substances (AD). A more detailed elaboration of the reaction mechanisms requires additional experimental data.
The main purpose of the consideration of the presented kinetic model is to explain the qualitative behavior of the experimental curves [ATP](t). Reactions (0)- (−4) are related to the shape of the experimental curves as follows:
1) an instantly established equilibrium in reaction (0) results in a sharp decrease in the initial ATP concentration at the initial moment;
2) a decrease in the concentration of mononuclear dinitrosyl iron complex D due to decomposition (reaction (1)) shifts the established equilibrium to the left, leading to an increase in the ATP concentration;
3) as a result of the reaction of ATP with the products of decomposition of complexes B and C (reactions (3) and (4)), the ATP concentration again begins to decrease in some time;
4) reactions (−3) and (−4) provide the non-zero value of the final, stationary ATP concentration.
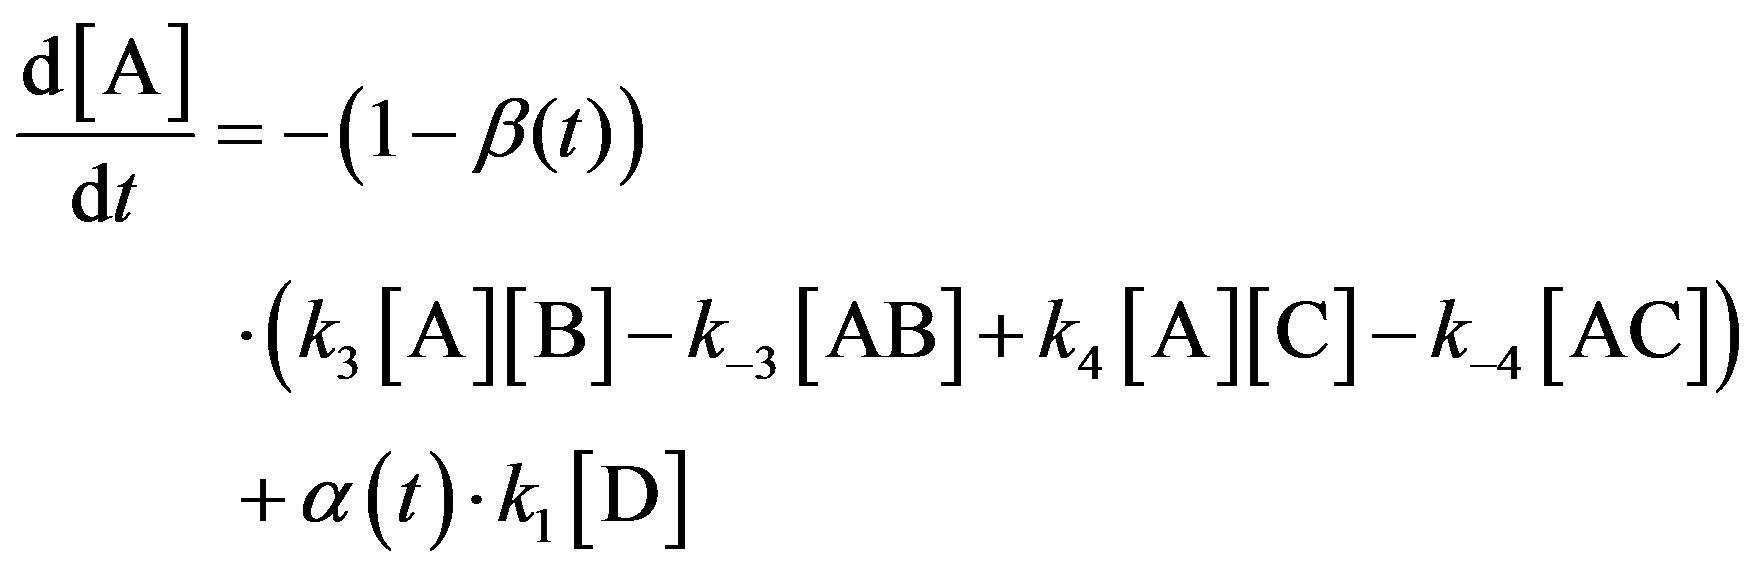
The system of equations corresponding to the scheme of reactions (0)-(−4) with allowance for the detailed equilibrium in reaction (0) takes the form of Eqs.5-12:
 (5)
(5)
 (6)
(6)
 (7)
(7)
 (8)
(8)
 (9)
(9)
 (10)
(10)
 (11)
(11)
 (12)
(12)
where ;
;
and .
.
The initial conditions are:
[D1](0) = [B](0) = [C](0) = [AB](0) = [AC](0) = 0, [A](0) = (−(1 + K0[D]0 − K0[A]0) + ((1 + K0[D]0 − K0[A]0)2 + 4K0[A]0)0.5)/(2K0), and [D](0) = [D]0/(1 + K0[A]0), where [A]0 is the initial ATP concentration, and [D]0 = 2[1]0 is the initial concentration of complex 2.
The values of reaction rate constants were estimated for each entry by the numerical solution of the system of Eqs.5-12. The calculations were performed at a specified value of equilibrium constant K0 = 9.2 × 10⁴ mol−1∙L.
The values of reaction rate constants (1)-(−4) calculated from the experimental data are given in Table 2. It

Table 2. Reaction rate constants in the kinetic model (0)-(−4) that describe the reaction of ATP with complex 1.
is seen that there is a small scatter of numerical values of constants found from different experiments, and inaccuracies of their average values do not exceed 10% - 20%. It follows from Figure 5 that the scheme of reactions (0)-(−4) satisfactorily describes the corresponding experimental kinetic curves with a change in the initial concentration of complex 1 in a range of (1.7 − 13.4) × 10−5 mol∙L−1.
The results obtained allow one to consider the scheme of reactions (0)-(−4) as a kinetic model of the reaction of ATP with complex 1, from which it follows, in particular, that this interaction affords several different products.
4. STUDY OF THE REACTION PRODUCTS
Based on the chemical structures of molecules of ATP and complex 2, we may assume that molecule 2 can potentially bind with either the triphosphoric acid residue or the adenine fragment in the component of ATP.
4.1. NMR Data
To answer this question, we studied ATP, complex 1, and the reaction products by NMR spectroscopy.
All obtained spectra of ATP correspond to its molecular formula.
The addition of complex 1 to a solution of ATP results in the strong broadening of the 1H signals of ATP, and three broad signals remain instead of nine resolved lines corresponding to the signals in the spectrum of pure ATP in the same regions of the 1H NMR spectrum as those for ATP. The strong broadening of signals is also observed in the 31P NMR spectra. Similarly to the 1H NMR spectra, the broad signals from the 31P nuclei in the NMR spectrum of a mixture of complex 1 and ATP lie in the same frequency range as for pure ATP. This indicates the absence of a chemical interaction between complex 1 and the -(PO2H)3 fragment.
All signals gradually broadened during next three days and nearly completely disappeared, and a precipitate was formed. The observed effects suggest the interaction of ATP with complex 1. The complete decoding of the molecular structures of the solid reaction products is impossible, because the precipitate is insoluble in accessible solvents, viz., D2O, DMSO, and CCl4.
Thus, an analysis of the 31P NMR spectra shows that no interaction occurs between complex 1 and the phosphorus “tail” of ATP. Therefore, complex 2 adds to the adenine part of the ATP molecule. A similar interaction with this nucleotide fragment has earlier [14] been decribed: the interaction occurred due to the 3d electrons of iron using the [FeL2] complex (L is 3,6-dichloropicalinic acid) as an example, as well as for pyridine, 2,2- bipyridine, and nicotinamide [8].
4.2. Iron States and Its Ligand Surrounding in the Reaction Products
The addition of complex 2 to an ATP molecule is due to the change in the environment and valent state of the iron atom. Gamma-resonance spectroscopy was used to determine the electron state of iron. The obtained Mössbauer spectrum shows that NO is completely absent from the reaction product. The character of the spectrum indicates the presence of two compounds. The former contains iron in the oxidation state +2 with the isomeric shift δFe2+ = 1.351(1) mm∙s−1 and quadrupole splitting ΔEFe2+ = 2.798(1) mm∙s−1. The latter contains iron in the oxidation state +2 with the isomeric shift δFe3+ = 0.537(2) mm∙s−1 and quadrupole splitting ΔEFe3+ = 0.457(2) mm∙s−1. The content of Fe2+ and Fe3+ in the mixture is 13 - 15 and 85% - 87%, respectively. The spectral shape indicates that the reaction product contains two complexes with the octahedral coordination of the iron atom.
We carried out spectroscopic studies in the IR region to reveal the ligand environment of the iron atom in the reaction product (complex 3). The IR spectra recorded in the wave number ranges from 4000 to 500− and from 600 to 100 cm−1 are shown in Figures 6 and 7, respectively.
The broadened stretching vibration bands at ν = 3340 cm−1 taking into account the bands at 1710, 1496, 1253, and 966 - 901 cm−1 in the spectrum of the initial ATP show that the triphosphoric part (“tail”) of the acid molecule exists in the form of dimers (Figure 6, curve 1). In the spectrum of complex 3 (Figure 6, curve 3), the stretching vibration bands ν = 3199 − 2993, 1403, and 911 cm−1 are also attributed to vibrations of coordinated ν(OH) and ν(P = O) groups. This indicates that ATP exists in the dimeric form due to hydrogen bonds of the phosphoric residues both after dissolution in a buffer solution and in the course of the reaction with complex 2.
An analysis of the IR spectra shows that bands indicating the formation of new nitrogen-iron and nitrogensulfur bonds appear in the spectrum of complex 3 (Figure 6, curve 3), unlike the spectra of the starting substances (Figure 6, curves 1 and 2).
The strong bands of stretching vibrations at 1790 and 1742 cm−1, observed in the spectrum of complex 1 (Figure 6, curve 2) and belonging to the ν(-NO) group, disappear in the spectrum of the reaction product. The following bands also disappear: ν 538 with a shoulder at 553 cm−1 belonging to νas(SO3) and (or) δ(O-S-O) and the band at 467 cm−1 (Figure 7, curve 3) attributed by us to vibrations of the Fe-N bond related to ν(N-O).
New bands appear in the spectrum of complex 3: ν = 598, 395, 277, and 245 cm−1, which are absent in the spectrum of complex 1 and can be assigned to vibrations of iron included in the ring. The bands at ν = 377 and 263 cm−1 simultaneously disappear in the initial spectrum of

Figure 6. IR spectra in the range from 4000 to 500 cm−1: 1, ATP; 2, DNICthio = complex 2; 3, complex 3.

Figure 7. IR spectra in the range from 500 to 100 cm−1: 1, ATP; 2, DNICthio = complex 2; 3, complex 3.
complex 1. This indicates that the new band, namely, Fe-N, is formed in the product.
Vibrations observed in the spectrum of complex 1 at ν = 377 cm−1 ν(M-S); ν = 263 cm−1 δ(N-M-N); ν = 196 cm−1 δ(M-S); ν = 165 cm−1 δ(M-S) cm−1 (Figure 7) were assigned to stretching and bending vibrations of the Fe-S bond. In the spectrum of complex 3, these bands of stretching vibrations of the Fe-S bond are strongly shifted: ν = 395 cm−1 ν(Fe-S); ν = 277 cm−1 δ(N-Fe-N); ν = 245 cm−1 δ(N-Fe-N); ν = 128 cm−1 δ(Fe-S); and ν = 96 cm−1 δ(Fe-S).
Therefore, the reaction product contains the Fe-S and Fe-N bands.
Thus, the IR spectroscopic data are consistent with the NMR results and indicate that the phosphoric residues of ATP in an aqueous solution are bound into a dimeric form both before and after the interaction with 2. The solid reaction product (complex 3) contains neither NO, nor SO3 groups. It follows from the IR spectra that the compound under study contains Fe-S and Fe-N bonds.
Therefore, the reaction occurs due to the sulfur and nitrogen atoms of the adenine ring of ATP and the iron atom of 2.
The solid reaction product contains neither NO, nor SO3 groups. The shape of the IR spectra indicates that the studied compound includes Fe-S and Fe-N bonds. Therefore, the reaction involves the nitrogen atoms of the adenine ring of ATP and the iron and sulfur atoms of complex 2.
5. DISCUSSION
Based on the obtained experimental data, we may propose the following sequence of the process. 1) Binuclear thiosulfate-nitrosyl iron complex 1 in a solution dissociates to two mononuclear dinitrosyl iron complexes 2 according to Scheme 1. The reaction occurs with a high rate; 2) Mononuclear complex 2 reacts with the adenine part of nucleotide of ATP. The iron atom coordinates the N(7) atom of the adenine heterocycle, and the sulfur atom coordinates the nitrogen atom of the terminal NH2 group of ATP. A stable six-membered ring is formed (Scheme 2). This reaction is fast and results in quenching of ATP fluorescence; 3) NO molecules are eliminated from molecules of complexes 2 and 3 within 20 - 40 min [13,21]; 4) The SO3 group can be eliminated. A reason can be the long S-S bond in thiosulfate, viz., 2.01 A, compared to an S-O bond length of 1.47 A.
As a result, complex [ATP-Fe2+S] (3) is formed containing the Fe2+ ion in the octahedral coordination. The intermediates formed during the reaction can interact with ATP.
The formation of complex [ATP-Fe3+S] (4) in which iron exists in the oxidation state +3 can be due to the fact that water of the solvent enters into the coordination sphere of iron (Scheme 3). This changes the coordination mode of the metal. The coordination mode of this type is characteristic of biological systems, porphyrins, and hemoglobin. The prolonged process is completed by precipitation. However, this is the sample that is used as a washed and dried precipitate for recording Mössbauer and IR spectra.
The results of determination of elements in the composition of complex 4 are given in Table 3. The divergences between the elemental analysis data and those calculated per ATP molecule with three phosphoric residues also suggest that the reaction product (complex 4) further (in vitro) continues to undergo chemical changes. In particular, the phosphorus-ester bonds of the phosphorus residues of the ATP residues are hydrolyzed during purification and drying of the sample, which corresponds to the described [22] mechanism. The calculations performed under the assumption that R has not three phosphoric residues but two residues as in ADP are satisfactorily consistent with the elemental analysis data and assumed structures of the reaction products.
| | + | | Û | complex 3 |


Scheme 2. Reaction of the ATP with DNICthio.
| 2 | R | + | | Û | complex 4 |


Scheme 3. Interaction of DNICthio with two ATP molecules.

Table 3. Elemental analysis data for the [ATP-1] complex.
6. CONCLUSIONS
Thus, in the present work, we establish that ATP reacts with thiosulfate-nitrosyl iron complex, which is a donor of nitrogen monoxide. The proposed kinetic model allows one to calculate the complexation constants.
Thus, the kinetic model of the process that takes into account the formation of several products of the reaction of ATP and complex TNIC and satisfactorily describes the kinetic curves of ATP consumption is presented. It is found on the basis of the data of fluorimetry and IR and NMR spectroscopy that complex TNIC interacts with the adenine part of the ATP molecule. An analysis of the Mössbauer spectra indicates that the reaction products contain two compounds: Fe2+ and Fe3+ complexes.
REFERENCES
- Lehninger, A. (1983) Principles of biochemistry. W. H. Freeman, London.
- Obrezan, A.G. and Raimuev, K.V. (2009) Chronic cardiac deficiency: The state of the problem at the modent stage. Vestn. St. Petersburg Post-Diploma Education Medical Academy, 1, 5. (in Russian)
- Bokeriya, L.A. and Chicherin, I.N. (2007) Nature and clinic significance of “new ischemic syndromes”. A.N. Bakulev NTsSSKh, Russian Academy of Medical Sciences, Moscow. (in Russian)
- Belovol, A.N. and Knyazґkova, I.I. (2009) Prospects of pharmacological correction of hypoxia in cardiology and neurology. Liki Ukraini plyus, 3, 4. (in Russian)
- Erickson, R.R., Yu-Drend, P. and Holtzman, J.L. (1982) The kinetics ethylmorpfine N-demethylase in isolated hepatocydes: The effect of drug transport and oxygen concentration. Journal of Pharmacology and Experimental Therapeutics, 220, 35.
- Weiss, J.M., Lamp, S.T. and Shine, K.I. (1989) Celular K+ loss and union efflux during myocardial ischemia and metabolic inhibition. American Journal of Physiology, 256, 1165.
- Todorov, I.N. (2007) Mitochondria: Oxidative stress and mitochondrial DNA mutations in the development of pathologies, the process of aging and apoptosis. Rossiiskii Khimicheskii Zhurnal, 51, 93.
- Grazhdan, K.V. (2009) Complexation of Fe(III) with nikotinamidom in aqueous solutions of ethanol and dimethylsulphoxide. Ph.D. Thesis, State Medicine Academy, Ivanovo. (in Russian).
- Dobrokhotova, O.V., Tatґyanenko, L.V., Kotelґnikov, A.I., Saratovskikh, E.A., Rudneva, T.N., Sanina, N.A. and Aldoshin, S.M. (2009) The impact of nitroxide iron-sulphur complexes on the activity of hydrolytic enzymes. Khimiko Farmatsevticheskii Zhurnal, 43, 45.
- Sanina, N.A. (2010) The study of cardioprotective properties nitrosyl iron complexes donor-NO, with the use of models of ischemic and reperfusion damage of myocardium in vitro and in vivo. 18th International Conference on Novel Informational Technologies in Medicine, Biology, Pharmacology, and Ecology, Yalta-Gurzuf, 31 May- 9 June 2010, 348.
- Sanina, N.A., Rudneva, T.N., Sulimenkov, I.V., Konovalova, N.P., Sashenkova, T.E. and Aldoshin, S.M. (2009) Antitumor activity of iron nitrosyl complexes: New donors of nitrogen monoxide. Rossiiskii Khimicheskii Zhurnal, 53, 164.
- Sanina, N.A., Serebryakova, L.I., Shul’zhenko, V.S., Pisarenko, O.I., Rudneva, T.N. and Aldoshin, S.M. (2011) Application of the binuclear anionic sulfur nitrosyl iron complex as a vasodilatory drug. RF Patent No. 2437667.
- Sanina, N.A. (2011) A new class of donors carbon monoxide nitrogen: Structure and properties of nitrosyl iron complexes with functional sulfur ligands. Ph.D. Thesis, Institute of Problems of Chemical Physics Russian Academy of Sciences, Chernogolovka. (in Russian)
- Saratovskikh, E.A., Kondratґeva, T.A., Psikha, B.L., Gvozdev, R.I. and Kartsev, V.G. (1988) Complex-formation of some pesticides with adenosine triphosphoric acide. Akademiia nauk SSSR. Izvestiia. Seriia khimicheskaia, 37, 2501.
- Sanina, N.A., Aldoshin, S.M., Rudneva, T.N., Golovina, N.I., Shilov, G.N., Shulґga, Yu. M., Martynenko, V.M. and Ovanesyan, N.S. (2005) Synthesis, structure, and solidphase transformations of the nitrosyl iron complex Na2[Fe2(S2O3)2(NO)4] 4H2O. Koordinatsionnaya Khimiya, 31, 323.
- Dibbern, H.W., Muller, R.M. and Wirbitzki, E. (2002) UVand IR spectra of some important drugs. Publ. Editio Cantor VERLAG (ECV), Berlin.
- Nakanishi, K. (1962) Infrared adsorption spectroscopy. Holden Day, San Francisco.
- Nakamoto, K. (1963) Infrared spectra of inorganic and coordination compounds. Marquette University, Milwaukee.
- Sverdlov, L.M., Kovner, M.A. and Krainov, E.P. (1970) Kolebatel’nye spektry mnogoatomnykh molekul [Vibrational Spectra of Polyatomic Molecules], Nauka, Moscow. (in Russian)
- Burshtein E.A. (1977) Own luminescence of proteins: The nature and application. Science and Technics in Review, Ser. Biophysics, VINITI, Moscow, 7, 139. (in Russian)
- Vasilґeva, S.V., Moshkovskaya, E. Yu., Sanina, N.A., Rudneva, T.N., Kulikov, A.V. and Aldoshin, S.M. (2005) Formation of the dinitrosyl iron complex as a necessary stage in the accomplishment of genetic activity. Doklady Akademii Nauk, 402, 705.
- Williams, V.R. (1973) Basic physical chemistry for the life. Sciences, San Francisco.