Journal of Environmental Protection
Vol. 3 No. 10 (2012) , Article ID: 23844 , 8 pages DOI:10.4236/jep.2012.310149
Examination of Diurnal Variation at a Non-Sewage Impacted Beach via qPCR and Culture Based Methods
![]()
1The City of Racine Health Department Laboratory, Racine, USA; 2Marian University, Fond du Lac, USA; 3US Environmental Protection Agency, Office of Water, Washington DC, USA.
Email: julie.kinzelman@cityofracine.org
Received July 25th, 2012; revised August 26th, 2012; accepted September 20th, 2012
Keywords: Diurnal Variation; Beaches; qPCR; Fecal Indicator Bacteria
ABSTRACT
Fecal indicator bacteria concentrations, a measure of water pollution, do not remain static in the environment and can fluctuate both temporally and spatially. Diurnal variation, partially resulting from the effects of UV light, may decrease the density of E. coli, resulting in lower concentrations in the afternoon. Previous studies conducted at 63rd Street Beach in Chicago, IL [1] and North Beach in Racine, WI [2] demonstrated significant diurnal variation using an E. coli standard and culture-based assays. Subsequent studies conducted at sewage-impacted Great Lakes beaches employing molecular assays (qPCR) found that the signal remained stable; it is unknown whether a similar scenario exists at non-sewage impacted beaches. During the summer of 2011, surface water samples were collected in the morning and afternoon (0700 and 1200) and analyzed by both IDEXX/Colilert and qPCR/BioGx SmartBeads/OmniMix HS to determine if temporal variation in E. coli was occurring (n = 29/23, culture/qPCR). Analysis of log-converted data (independent t-test/one-way ANOVA) indicated no significant difference in mean E. coli concentration as determined by morning and afternoon sampling via either method (Colilert/qPCR, p = 0.49/0.09, α = 0.05). Although not statistically significant (p = 0.09) there were 5 of 23 (22%) instances where afternoon qPCR values exceeded morning counterparts; two (10%) when culture-based assays did not show a similar response. The utility of rapid assays lies in their ability to generate results prior to beach opening; temporal or event-based fluctuations should be considered when using molecular assays at non-sewage impacted beaches for regulatory purposes.
1. Introduction
High levels of fecal indicator bacteria (FIB), a measure of water pollution and surrogates for waterborne pathogens, have been monitored for decades to ensure the public health and safety of those participating in recreational water activities [3,4]. In order to reduce human health risk, the United States Environmental Protection Agency (US EPA) has published guidelines based on FIB criteria, typically E. coli for fresh water and enterococci for marine waters [5]. Exceedance of single sample limits, or 5-day rolling geometric mean values, indicate that the risk to human health may be elevated. During these periods, beach managers are required to either prohibit swimming or issue a water quality advisory, thus allowing the public to make an informed decision on whether or not to swim [5,6]. A recent report by the National Resources Defense Council (NRDC) cited a total of 24,901 beach advisories or closings in 2010 alone [7]. Furthermore, not only were water quality advisories more frequent during the last reporting period, they remain untimely due to the 18 - 24 hours necessary to generate a culture-based laboratory result with the currently approved methods [8]. Recognizing this, several iterations of proposed BEACH Act (Beaches Environment and Coastal Health Act of 2000) language have called upon the US EPA to conduct new health effects studies, revise its ambient water quality criteria and develop more rapid testing analytical methods [6,9,10]. Failure to meet the initial 2007 deadline resulted in a class action lawsuit by several plaintiffs, including the NRDC. In a settlement agreement, the US EPA agreed to complete critical research related to human health effects and rapid analyticcal assays for the enumeration of FIB in recreational waters by December 2010 and publish revised water quality criteria in October 2012. The implementation of more rapid analytical methods will result in greater protection of public health in the context of full body contact water-related recreational activities [7].
The US EPA has moved forward, conducting several studies on the utility of qPCR (quantitative real-time PCR, a rapid molecular method) alone or in conjunction with several external partner laboratories. In 2004, a study by Haugland et al. (2005) compared quantification of enterococci by qPCR and a comparable culture-based assay (US EPA Method 1600, Online: http://nepis.epa.gov/EPA/html/DLwait.htm?url=/Exe/ZyPDF.cgi?Dockey=P10099DH.PDF). A significant, positive correlation was found between the two methods, as well as good correlation between human health effects and enterococci as enumerated by qPCR [8]. The results were promising with respect to the utility of using rapid molecular assays for the determination of FIB in recreational waters [8]. Subsequent studies have also investigated the performance of qPCR and other rapid analytical methods [transcription-mediated amplification (TMA) and immuno-magnetic separation/adenosine triphosphate or IMS-ATP] against culture-based assays for E. coli and enterococci (IDEXX Colilert™ or US EPA Method 1603 and IDEXX Enterolert™ and US EPA Method 1600 respectively) for their ability to meet state performance standards [11-15].
Not only did the these rapid analytical assays meet state performance standards with respect to monitoring recreational water quality, they also frequently produced nearly identical regulatory action agreement, and, in some cases, numerical values, as their culture-based comparable assays. This provides justification for the site-specific adoption of these rapid methodologies for determining FIB concentrations at recreational water sites [11]. Rapid molecular assays, such as qPCR, have been further modified based on input from internal US EPA and external researchers, striving to improve method performance (i.e. accuracy and precision) [12]. In December 2010 the US EPA released proposed revisions to the national recreational water quality criteria [16]. These revisions included guideline values for enterococci in fresh and marine waters as quantified by qPCR based on the results of human exposure studies conducted at sewage impacted marine and Great Lakes coastal beaches [16]. Guideline values for E. coli were not proposed due to a lack of available data at the time of publication. However, the combination of E. coli/qPCR as an indicator/analytical method combination will be allowed if scientific defensibility can be demonstrated on a site-by-site basis [16].
Although comparability has been demonstrated, outstanding questions remain which must be addressed prior to wide-scale implementation of qPCR for monitoring bathing beaches. For one, an E. coli standard is typically used for monitoring freshwater coastal recreational beaches [7]. Previous research has indicated that the use of enterococci, for monitoring those same beaches, may result in an increase in advisories or closures in the absence of any identifiable increase in human health risk based on a survey of potential pollution sources impacting those beaches [17]. Therefore, E. coli and enterococci may not be interchangeable as indicators of recreational water quality at all sites. Another consideration for implementation is the inherent temporal variability in FIB concentrations [1,18]. While rapid molecular assays have the ability to provide same day notification, an advantage over the current 18 - 24 lag between sample collection and result generation, this would necessitate an early morning sample collection. While the US EPA NEEAR (National Environmental Exposure and Research) studies indicated that the qPCR signal remained constant throughout the day [8] other studies have indicated that FIB concentrations, especially E. coli, can fluctuate based upon the effects of UV light [2,19]. The disparity in these findings may lie in the fact that the NEEAR studies were conducted solely at recreational beaches impacted by wastewater treatment plant effluent. While the wastewater treatment plant process greatly reduces viable (i.e. culturable) FIB concentrations, the DNA released from those cells may persist for some time thus resulting in a constant signal throughout any given day. Conversely, at beaches impacted by non-point pollution the influx of FIB may be sporadic across several days or within any given day [14]. Within day variation, or diurnal variation, may account for significant reductions in FIB in the afternoon over early morning samples [19]. Significant diurnal variation was seen in some study years at Great Lakes coastal beaches when using culture-based assays [1,2].
Implications for implementation of rapid molecular methods must be considered. For example whether or not early morning sample collection, necessary for the generation of same day results, will result in significantly more beach postings. While shortening the testing period would be desirable for the prevention of disease, an increase in Type I errors (erroneously making the decision to prohibit swimming in the absence of increased health risk) would be detrimental from an economic standpoint. Therefore, the purpose of this study was: 1) to determine if significant diurnal variation was occurring at a nonsewage impacted beach (North Beach, Racine WI); 2) whether the detection of diurnal variation varied significantly based on the analytical method (culture or qPCR); and 3) what impact early morning (0700 vs. 1200) sample collection would have on regulatory decisions. Interest in rapid molecular techniques is high and, therefore, it is vital to examine the advantages and disadvantages of these methods prior to wide scale implementation in order to maximize utility while protecting public health.
2. Materials and Methods
Study Site. Lake Michigan surface water samples were collected from North Beach (Racine, WI) located at 89 Kewaunee Street (N42˚44.3595', W087˚46.8838'). North Beach is a non-sewage impacted beach, with predominant sources of pollution being conveyed and direct stormwater discharge and gulls [20].
Sample Collection. For the purpose of routine compliance monitoring, fresh water samples (total volume = 500 ml) were collected twice daily, five days per week (Monday-Thursday, 0700 and 1200), from North Beach at previously designated fixed points (N1 - N4) in sterile Whirl-Pak™ bags (Nasco, Ft. Atkinson, WI). The sampling points were fixed locations (transects equidistantly spaced approximately 200 m apart) previously designated by the City of Racine Health Department and employed annually as monitoring stations for the past 20 years (historical records, City of Racine Health Department, Division of Laboratory Services). The duration of the sampling period was from July 1-August 11, 2011. A single sample, one from each location, was obtained in the morning (0700) and afternoon (1200) by carefully wading (with minimal disruption of submerged sediments) out to a one-meter depth, and taking a 500 mL sample from 0.3 m below the surface of the water by reaching out at arm’s length and plunging the sampling bag away from the collector’s body [21]. The time between sample collection at each transect was between five and ten minutes. Routine, on-site, sanitary survey data was collected each time that sampling occurred in conformance with the US EPA sanitary survey tool for the Great Lakes (Online: http://water.epa.gov/type/oceb/beaches/sanitarysurvey_index.cfm). Samples were transported in a cooler on ice packs, maintained at 4˚C, to the laboratory and analyzed within less than one hour of collection.
Formation of the composite sample. Upon receipt by the laboratory, individual samples collected from each of the monitoring transects (N1 - N4) were composited into a pre-sterilized two liter Thermo Fisher Scientific Nalgene™ container. By taking 300 mL sub-samples of each well mixed individual sample a comprehensive, composite sample was obtained. The use of composite sampling as representative of water quality across North Beach, without the introduction of sampling bias, has been previously demonstrated [22]. This procedure was performed once for the morning collection (0700) and once for the afternoon collection (1200).
Quantification of E. coli using Colilert. E. coli was detected in surface water samples using IDEXX Colilert- 18® (0700 samples) or Colilert® (1200 samples) and Quanti-Tray/2000® (IDEXX Inc., Westbrook, ME). Fluorescence at 365 nm results when E. coli metabolizes the nutrient indicator 4-methyl-umbelliferyl β-D-glucuronide (MUG) using β-glucuronidase. Sample analysis was performed according manufacturer’s instructions using 100 mL of well-mixed composite sample (Colilert-18® and Colilert® product inserts, IDEXX Laboratories, Westbrook, ME) [Online: http://www.idexx.com/water/colilert24/ and http://www.idexx.com/water/colilert18/]. Positive (E. coli ATCC 25922) and negative (P. aeruginosa ATCC 27853) quality control organisms were run once per reagent lot number to validate test performance. Samples were incubated for 18 hours at 35˚C ± 0.5˚C. Results were read by placing the Quanti-Tray/2000 in an UV light box. The number of wells producing both a yellow color and blue fluorescence is analogous to the number of E. coli present as determined by the manufacturer provided most probable number (MPN) table. Results were expressed as MPN/100 mL. When no wells producing characteristic yellow color/blue fluorescence at 365 nm were present, the count was expressed as one half of the reciprocal of the dilution factor, i.e. no fluorescing wells noted on a 1:10 dilution was expressed a 5 MPN/100 mL.
Quantification of E. coli using US EPA Method 1603 [23]. Surface water samples were processed undiluted (total volume = 100 mL) or diluted 1:10 to a 100 mL total volume using sterile, deionized water (10 mL of sample +90 mL of sterile, distilled water) and filtered through sterile, 0.45-micron, 47 mm nitrocellulose filters (Millipore Corporation, Billerica, MA). The decision to dilute was based on historical water quality data which indicated a necessity for dilution to achieve a countable result within the confines of this method. Filters were placed onto modified m-TEC agar and dry incubated at 35˚C (+/–0.5˚C) for two hours to resuscitate stressed organisms, then transferred to a 44.5˚C (+/–0.2˚C) degree water bath for 22 (+/–2) hours. Quality control, including preand post-analysis, a sterile agar plate, and negative and positive performance plates (Enterococcus faecalis ATCC 29212 and Escherichia coli ATCC 25922, respecttively) was performed on each day that sample analysis occurred. After incubation, red/magenta colonies were enumerated using a Leica Quebec® colony counter under 10× magnification, multiplied by the dilution factor employed, and expressed as colony forming units per 100 mL (cfu/100 mL). When no bacterial colonies were detected the count was expressed as one half of the reciprocal of the dilution factor, i.e. no discernible red/magenta colonies, or colony count of zero, on a 1:10 dilution was expressed a 5 cfu/100 mL.
DNA Extraction. For both the 0700 and 1200 samples, 100 mL of the composite was filtered through a 47 mm, 0.45 µm polycarbonate filter (GE Osmonics, Minnetonka, MN) using a six-place Millipore® stainless steel manifold and UV-sterilized, reusable glass funnels as described in Kinzelman et al. (2011). Each time that samples were processed, a negative extraction control was prepared by filtering 100 mL of sterile, DNA-free, 1× PBS Buffer (Fisher Scientific, catalog #BP2438-4) in the same manner as the sample in order to test for sterility of the reagents, consumables, and the efficacy of the UV sterilization process. These filters were folded in half four times and placed apex up in 2.0 mL semi-conical, screw cap siliconized, micro-centrifuge tube (PGC Scientific, Palm Desert, CA) containing 0.33 g of sterile glass, acid washed beads (Sigma, St. Louis, MO). Tubes were then labeled with the collection site, technician’s initials, collection time [AM (0700) or PM (1200)], date, and tube number i.e. NB-AM080911-01. One tube containing a morning sample filter and one containing an afternoon sample filter, along with their respective controls, underwent DNA extraction using crude bead-beating as described in Lavender and Kinzelman (2009). Briefly, DNA extraction buffer was prepared by dissolving salmon testes DNA (#D-1626, Sigma, St. Louis, MO) in AE Buffer (#19077, Qiagen, Hilden, Germany) to a working concentration of approximately 10 µm/mL confirmed by reading at A260. This working solution was diluted to make 0.2 µm/mL salmon DNA/extraction buffer with AE buffer. The introduction of non-target DNA (salmon testes DNA, aka specimen processing control or SPC) to both the calibrator and experimental samples normalizes the relative recovery of DNA through comparison of recovered reference DNA which was equally added to both samples. After preparation of the extraction buffer, 590 µm of 0.2 µm/mL salmon DNA extraction buffer was added to the micro-centrifuge tube containing the filter, bead beaten for two minutes at the maximum speed (BioSpec Mini-BeadBeater-8, Bartlesville, OK), and then centrifuged at 12,000 rpm for one minute. Once completed, 250 µL of supernatant was transferred to a 1.7 mL low-retention micro-centrifuge tube (#C-3228-1, GeneMate, Kaysville, UT) and centrifuged again for 5 minutes. The final supernatant was placed into a new micro-centrifuge tube, labeled as 1x DNA extract and stored at 4˚C until the onset of qPCR analysis. Under certain environmental conditions, such as heavy rainfall or turbidity greater than 20 NTU, the 1x DNA extract was diluted 1:5 with AE buffer prior to analysis.
Quantification of E. coli using qPCR. Replicate aliquots of 5 μL of extracted sample/calibrator/control DNA was added to 20 μL of PCR mixture containing lyophilized reagents: Omnimix HS beads (2 beads/4 reactions) (Cepheid; Sunnyvale, CA), and E. coli (target) or Salmon testes DNA (SPC control) Smartbeads™ (1 bead/4 reactions) (BioGx; Birmingham, AL). Each run also included quality control samples: 1) a no template control (NTC); 2) a negative extraction control (NEC); and 3) a calibrator (CAL). These single samples were prepared by combining 20 µL PCR master mix with 1) 5 µL AE buffer; 2) 5 µL negative extraction control DNA extract (sterile PBS carried through the DNA extraction phase); and 3) 5 µL laboratory-prepared whole cell calibrator DNA extract (10 µL of E. coli at a concentration of 3.0 × 10⁹ cells/mL spotted onto a blank filter and extracted) respectively. Quantification was performed on the SmartCycler II (Sunnyvale, CA) using the following cycling parameters: hold at 95˚C for 120 seconds (optics off) (Stage 1), followed by 45 cycles of 95˚C for 5 seconds (optics off) (Stage 2), and 62˚C for 43 seconds (optics on).
Statistical analysis. The SmartCycler software automatically calculates cycle threshold (CT) values for each sample by the second derivative method. Replicate DNA extracts not agreeing within one CT were reanalyzed prior to performing further calculations. Once agreement was achieved, replicate CT values were averaged and calibrator cell equivalent (CCE) values determined using the ddCT method [8]. If the difference between the sample and SPC CT was greater than 3.0 the sample was considered inhibited and was excluded from the dataset.
Statistical analysis of data (ANOVA and correlation) was performed using WINKS SDA 6.0 Software (Texasoft, Cedar Hill, TX). Values for viable cell counts (CFU or MPN) and CCE were log-normalized prior to analysis. A test for equality of variance indicated the necessity of using a two-sample t-test. Statistical decisions were made at p = 0.05 unless otherwise stated.
3. Results
A survey of morning (0700) and afternoon (1200) surface water samples collected from North Beach (Racine, WI) was conducted in order to determine if diurnal variation existed prior to implementation of qPCR assays.
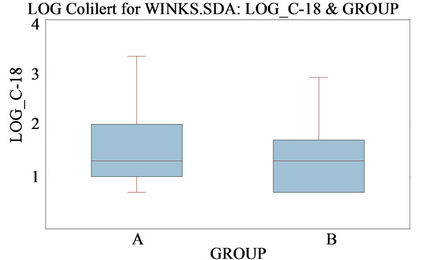
Culture-based assays. Two culture-based assays were used, Colilert/Colilert-18® and US EPA Method 1603 (modified m-TEC agar, membrane filtration). There was no significant difference in mean E. coli values between the two culture-based methods of enumeration; US EPA Method 1603 and IDEXX Colilert/Colilert-18®, for either the AM (0700) or PM (1200) sampling period (pAM = 0.539, pPM = 0.245) (Tables 1 and 2). The mean values of 0700 and 1200 E. coli values as determined by the IDEXX methods did not differ significantly [ANOVA, t (56) = 0.7, p = 0.486] suggesting diurnal variation, on average, was not present at the study site (Figure 1(a)). Samples enumerated using modified m-TEC agar (US EPA Method 1603) also demonstrated no significant difference in E. coli concentrations in morning versus afternoon samples (p = 0.959). However, there were four instances out of 22 sample collection dates (18%) where the cfu/100 mL differed between AM and PM samples; three occasions in which the AM sample had higher counts than the afternoon and one where the PM sample had the higher count.

Table 1. ANOVA: Single factor, AM.

Table 2. ANOVA: Single factor, PM.
 (a)
(a) (b)
(b)
Figure 1. Comparison of log converted E. coli densities from early morning (0700) vs. afternoon (1200) sample collection by Colilert/Colilert-18® (a) and qPCR (b).
qPCR assay. A test for equality of variance indicated that the variances of the two groups (0700 and 1200 sample collection times) were significantly different (Table 3). Because the variances of the two groups were significantly different (1.469 AM vs. 4.343 PM), a twosample t-test was performed. This analysis indicated that the means of the two groups were not significantly different (2.418 AM and 3.171 PM) and no significant diurnal variation was present (unequal variances t-test, t (35.9) = 1.72; p = 0.094) (Figure 1(b), Table 3).
Regulatory agreement. During the course of this study there were only two out of 22 instances where there was regulatory decision disagreement between culture-based assays (Colilert/Colilert-18® or US EPA Method 1603) and qPCR (data not shown). Although significant diurnal variation was not observed, differences in daily regulatory action, based on the time of sample collection (0700 or 1200) were noted on several occasions (Figure 2). There were five of 22 (22%) instances where 1200 (PM) CCE/100 mL values exceeded their 0700 counterparts when qPCR was employed as the analytical assay. Of these, there were two instances (10%) when the culturebased assays did not reflect the same relationship. Sanitary survey data (ambient environmental conditions, bather density, presence of wildlife, etc.) indicated that changes in weather frequently occurred between AM and PM sample collection events, e.g. measurable precipitation and/or increases in wave height leading to increased

Table 3. ANOVA: Single factor, qPCR.

Figure 2. E. coli CCE/100 mL, AM (dark gray) vs. PM (light gray), North Beach (2011).
turbidity. These differences could explain the variability in E. coli densities as enumerated by the culture-based and qPCR assays. Culture-based assays detect only cells possessing the ability to grow on selective media under optimal conditions, whereas qPCR detects these cells in addition to: viable but not culturable (VBNC), DNA contributed from dead cells, and free environmental DNA.
4. Discussion
The determination of diurnal variation in surface waters is essential for both beach management and assurance of public safety in the context of recreational water exposure. The most efficient method vetted to date for the determination of same day water quality management decisions is qPCR. Development of qPCR assays as effective and reliable methods for the determination of FIB, with demonstrable relationships to human health effects, has been presented [8,24]. These advancements will allow for the replacement of slower, culture-based methods. Due to the rapid nature of qPCR assays, the time from sample collection to public notification can be reduced from 18 to 24 hours down to less than two hours [25]. In order to facilitate the generation of results prior to the opening of public bathing beaches, sample collection would need to occur in the early morning hours. Previous studies, employing culture-based assays, have demonstrated significant diurnal variation at Great Lakes beaches, including the study site, where samples collected in the early morning would have resulted in more frequent water quality advisories [1,2]. In these instances, UV light may play a role in the decrease of FIB concentrations on sunny days as night gives way to day. In contrast, the US EPA NEEAR epidemiological studies, performed at sewageimpacted beaches, indicated that the qPCR signal remained flat through the day [26,27]. Therefore, when considering the implementation of qPCR on non-sewage impacted beaches, it is important to determine if time of day would introduce bias with respect to the posting of water quality advisories. While the protection of public should be of primary concern, public officials would be reluctant to implement qPCR if the necessity of early morning sample collection resulted in an increase in Type I errors, i.e. posting additional advisories in the absence of credible human health risk elevations.
This study indicated that significant diurnal variation was not detected at North Beach during the summer of 2011. However, different management decisions would have been made based on the time of sample collection on five instances; two of which when there existed a disparity between culture-based assays and qPCR. Notwithstanding, there were only two instances out of 22 paired sampling events (10%) in which the use of qPCR would have resulted in a different beach management decision.
Changes in ambient conditions were one possible explanation for these differences and the use of sanitary surveys may aid those considering the implementation of rapid molecular methods for the assessment of recreational surface waters (by predicting when changes to the aquatic environment occur). When changes in ambient water quality are likely to result in an increased risk to public health, the use of qPCR assays, by virtue of their rapid turnaround time (approximately three hours), will allow beach managers to re-assess the beach environment within a single day. Combined with other non-analytical rapid estimations of FIB, such as predictive models, future decisions concerning management and public safety can be made more quickly and economically, i.e. model derived estimations of FIB elevations may be confirmed in near real-time via qPCR [28,29].
In areas where significant diurnal variation is noted in conjunction with consistently low bather densities, the use of early AM E. coli analyses as determined by qPCR, may not be the best beach management choice. In these instances, sampling during periods of peak bather density (typically during the afternoon hours) and employing culture-based assays such as Colilert® or predictive models may be the best management decision for the protection of public health. Future work should continue at this, and other sewage and non-sewage impacted coastal beaches, to determine whether or not diurnal variation impacts the implementation and effectiveness of rapid molecular analytical methods such as qPCR for the determination of recreational water quality.
5. Conclusions
An assessment of diurnal variation was conducted during the summer of 2011 at North Beach (Racine, WI) to determine implications, if any, surrounding the necessity of early morning sample collection as part of qPCR implementation. Through the analysis of study results it was demonstrated that:
• No significant diurnal variation was present at North Beach in Racine, WI by either culture-based or qPCR assays;
• Early morning samples were representative of daily water quality in the absence of significant changes in ambient environmental conditions as determined by the routine on-site sanitary survey data;
• Employing a single, rapid analytical method would contain costs as well as ensure public safety, however the use of models in conjunction with rapid lab-based methods may provide an additional line of evidence when making beach management decisions.
6. Acknowledgements
Research and monitoring was funded by US EPA contract #EP115000072, Federal BEACH Act dollars administered by the WI Department of Natural Resources, and the city of Racine, WI. The authors wish to thank Joseph Granite and Jennifer Creekmur for their assistance with sample collection and processing. Finally this opportunity would not have been possible without the assistance of the McNair Scholars and TRiO Programs at Marian University (Fond du Lac, WI).
REFERENCES
- R. Whitman and M. Nevers, “Escherichia coli Sampling Reliability at a Frequently Closed Chicago Beach: Monitoring and Management Implications,” Environmental Science & Technology, Vol. 38, No. 16, 2004, pp. 4241- 4246. doi:10.1021/es034978i
- J. Kinzelman, “Investigating Bathing Water Quality Failures and Initiating Remediation for the Protection of Public Health,” Ph.D. Dissertation, University of Surrey, Guildford, 2005.
- National Technical Advisory Committee (NTAC), “Water Quality Criteria, Washington, DC,” Federal Water Pollution Control Administration, 1968.
- United States Environmental Protection Agency (US EPA), “Clean Water Act,” United States Environmental Protection Agency, Washington DC, 1977.
- US EPA, “Ambient Water Quality Criteria for Bacteria, Office of Water Regulation and Standards, Criteria and Standards Division,” United States Environmental Protection Agency, Washington DC, 1986.
- US EPA, “Beaches Environmental Assessment and Coastal Health (BEACH) Act of 2000,” United States Environmental Protection Agency, Washington DC, 2000.
- National Resources Defense Council (NRDC), “Testing the Waters: A Guide to Water Quality at Vacation Beaches,” 2011. http://www.nrdc.org/water/oceans/ttw/titinx.asp
- R. Haugland, S. Siefring, L. Wymer, K. Brenner and A. Dufour, “Comparison of Enterococcus Measurements in Freshwater at Two Recreational Beaches by Quantitative Polymerase Chain Reaction and Membrane Culture Analysis,” Water Research, Vol. 39, 2005, pp. 559-568. doi:10.1016/j.watres.2004.11.011
- United States House of Representatives, “H.R. 2537, Beach Protection Act of 2007,” 110th United States Congress, Washington DC, 2007, pp. 1-20. http://www.gpo.gov/fdsys/pkg/CRPT-110hrpt491/pdf/CRPT-110hrpt491.pdf
- United States House of Representatives, “H.R. 2093, Clean Coastal Environment and Public Health Act of 2009,” 111th United States Congress, Washington DC, 2009, pp. 1-16. http://www.gpo.gov/fdsys/pkg/BILLS-111hr2093rh/pdf/BILLS-111hr2093rh.pdf
- J. Griffith, D. Moore, C. McGee and S. Weisberg, “Technical Report 506,” Southern California Coastal Water Research Project, Costa Mesa, 2007. ftp://ftp.sccwrp.org/pub/download/DOCUMENTS/TechnicalReports/506_beta_testing.pdf
- S. Siefring, M. Varma, E. Atikovic, L. Wymer and R. Haugland, “Improved Real-Time PCR Assays for the Detection of Fecal Indicator Bacteria in Surface Waters with Different Instrument and Reagent Systems,” Journal of Water and Health, Vol. 6, 2008, pp. 225-237. doi:10.2166/wh.2008.022
- R. Bushon, C. Likirdopulos and A. Brady, “Comparison of Immunomagnetic Separation/Adenosine Triphosphate Rapid Method to Traditional Culture-Based Method for E. coli and Enterococci Enumeration in Wastewater,” Water Research, Vol. 43, No. 19, 2009, pp. 4940-4946. doi:10.1016/j.watres.2009.06.047
- J. Lavender and J. Kinzelman, “A Cross Comparison of qPCR to Agar-based or Defined Substrate Test Methods for the Determination of Escherichia coli and Enterococci in Municipal Water Quality Monitoring Programs,” Water Research, Vol. 43, No. 19, 2009, pp. 4967-4979. doi:10.1016/j.watres.2009.08.010
- J. Kinzelman, R. Bushon, S. Dorevitch and R. T. Noble, “Comparative Evaluation of Molecular and Culture Methods for Fecal Indicator Bacteria for Use in Inland Recreational Waters,” Water Environment Research Foundation, IWA Publishing, London, 2011, 360 p.
- US EPA, “Recreational Water Quality,” United States Environmental Protection Agency, Washington DC, 2011.
- J. Kinzelman, C. Ng, E. Jackson, S. Gradus and R. Bagley, “Enterococci as Indicators of Lake Michigan Recreational Water Quality: Comparison of Two Methodologies and Their Impacts on Public Health Regulatory Events,” Applied and Environmental Microbiology, Vol. 69, No. 1, 2003, pp. 92-96. doi:10.1128/AEM.69.1.92-96.2003
- R. Converse, J. Griffith, R. T. Noble, R. Haugland, K. Schiff and S. Weisberg, “Correlation between Quantitative PCR and Culture-Based Methods for Measuring Enterococcus spp. over Various Temporal Scales at Three California Marine Beaches,” Applied and Environmental Microbiology, Vol. 78, No. 4, 2012, pp. 1237-1242. doi:10.1128/AEM.07136-11
- M. Gregory and E. Frick, “Indicator Bacteria Concentrations in Streams of the Chattahoochee River National Recreation Area, March 1999-April 2000,” Proceedings 2001 GWRC Conference, Athens, 26-27 March 2001, pp. 510-513.
- J. Kinzelman and S. McLellan, “Success of ScienceBased Best Management Practices in Reducing Swimming Bans—A Case Study from Racine, Wisconsin, USA,” Aquatic Ecosystem Health Manage, Vol. 12, No. 2, 2009, pp. 187-196. doi:10.1080/14634980902907466
- Wisconsin Department of Natural Resources (WI DNR), “Beach Monitoring Program Requirements,” 2011. http://dnr.wi.gov/org/water/wm/wqs/beaches/BeachMonitoringRequirements.pdf
- J. Kinzelman, A. Dufour, L. Wymer, G. Rees, K. Pond and R. Bagley, “Comparison of Multiple Point and Composite Sampling for Monitoring Bathing Water Quality,” Lake and Reservoir Management, Vol. 22, No. 2, 2006, pp. 95- 102. doi:10.1080/07438140609353887
- US EPA, “Method 1603: Escherichia coli (E. coli) in Water by Membrane Filtration Using Modified Membrane-Thermotolerant Escherichia coli Agar (Modified mTEC),” US EPA Office of Water, Washington DC, 2002.
- A. Blackwood, S. Yu, J. Gregory and R. T. Noble, “Rapid qPCR Assays for Escherichia coli and Enterococcus in Recreational Waters: Equivalent to Existing Methods?” Proceedings ASM National Meeting, Orlando, 21-26 May 2006. http://ieg.ou.edu/ASM2006/data/papers/Q_494.htm
- R. T. Noble, A. Blackwood, J. Griffith, C. McGee and S. Weisberg, “Comparison of Rapid Quantitative PCR-Based and Conventional Culture-Based Methods for Enumeration of Enterococcus spp. and Escherichia coli in Recreational Waters,” Applied and Environmental Microbiology, Vol. 76, No. 22, 2010, pp. 7437-7443. doi:10.1128/AEM.00651-10
- T. Wade, R. Calderon, E. Sams, M. Beach, K. Brenner, A. Williams and A. Dufour, “Rapidly Measured Indicators of Recreational Water Quality are Predictive of Swimming-Associated Gastrointestinal Illness,” Environmental Health Perspectives, Vol. 114, No. 1, 2006, pp. 24-28. doi:10.1289/ehp.8273
- T. Wade, et al., “Rapidly Measured Indicators of Recreational Water Quality and Swimming-Associated Illness at Marine Beaches: A Prospective Cohort Study,” Environmental Health, Vol. 9, No. 66, 2010.
- A. Mednick and D. Watermolen, “Beach Pathogen Forecasting Tools: Pilot Testing, Outreach, and Technical Assistance,” Wisconsin Department of Natural Resources, Bureau of Science Services, Miscellaneous Publication, 2009.
- J. Telech, K. Brenner, R. Haugland, E. Sams, A. Dufour, L. Wymer and T. J. Wade, “Modeling Enterococcus Densities Measured by Quantitative Polymerase Chain Reaction and Membrane Filtration Using Environmental Conditions at Four Great Lakes Beaches,” Water Research, Vol. 43, No. 19, 2009, pp. 4947-4955. doi:10.1016/j.watres.2009.07.002