International Journal of Geosciences
Vol.07 No.02(2016), Article ID:63978,19 pages
10.4236/ijg.2016.72013
Hypsometric Analysis of Wadi Mujib-Wala Watershed (Southern Jordan) Using Remote Sensing and GIS Techniques
Yahya Farhan, Adel Elgaziri, Ibtisam Elmaji, Intisar Ali
Department of Geography, University of Jordan, Amman, Jordan

Copyright © 2016 by authors and Scientific Research Publishing Inc.
This work is licensed under the Creative Commons Attribution International License (CC BY).
http://creativecommons.org/licenses/by/4.0/


Received 10 January 2016; accepted 26 February 2016; published 29 February 2016
ABSTRACT
Hypsometric analysis is considered an effective tool for understanding the stages of geomorphic evolution and geological development of river catchment, and for the delineation of erosional proneness of watershed. In the present study, twenty eight fourth order sub-basins of W. Mujib- Wala (Southern Jordan) were selected, and hypsometric analysis was carried out using 30 m ASTER DEM. Elevation-relief ratio method was employed to calculate the hypsometric integral values within GIS environment. The hypsometric integral values range from 0.71 to 0.88, whereas, the hypsometric curves exhibit remarkably upward convex shapes which indicate that all sub-ba- sins and the W. Mujib-Wala watershed are at the youth-age stage of geomorphic development. Thus, they are of high susceptibility to erosion, incised channel erosion and mass movement activity. Marginal differences exist in mass removal from the watershed and the 28 sub-basins are attributed to variation in tectonic effect, lithology and rejuvenation processes. The relation between basin area and hypsometric integral was examined using regression analysis. Results reveal that negative and weak relationships dominate, where r2 ranges from 0.05 to 0.478 which confirm with other results reported elsewhere. Indirect assessment of erosion status based on hypsometric integral values was validated using estimated sediment yield information related to wadi Mujib and wadi Wala watersheds separately. The recorded sediment yields were in affirmation with high hypsometric integrals values, where higher values of hypsometric integrals and sediment yields occurred in the western part of the W. Mujib-Wala watershed. These findings would help in the construction of appropriate soil and water conservation measures across the watershed and its sub-basins to control soil erosion, to conserve water, and to reduce sediment discharge into the W. Mujib and W. Wala reservoirs.
Keywords:
Hypsometric Analysis, Geomorphic Evolution, RS, GIS, Hypsometric Integral, Projected Profiles

1. Introduction
Hypsometry refers to the relative proportion of an area at different elevations within a region, and the hypsometric curve is an area-elevation relationship curve which depicts distribution of the area with respect to elevation [1] . The hypsometric curve (HC) and hypsometric integral (Hi) are crucial indicators of watershed conditions [2] . Differences in the shape of the curve and the hypsometric integral value are attributed to the degree of disequilibria in the balance of erosive and tectonic forces [3] . Comparison of the shape of the hypsometric curve for different watersheds developed under similar geologic and geomorphic conditions provides a relative insight into the history of hillslope processes.
The hypsometry of a drainage basin is exemplified either graphically as a “hypsometric curve” (HC), or quantitatively as an integral called “hypsometric integral” (Hi). The hypsometric curve expresses the volume of rock mass in the watershed and the amount of erosion that has taken place in the watershed against the remaining mass [4] [5] . The hypsometric integral is calculated from the area under a hypsometric curve and is expressed as percentage.
Hypsometric analysis has been developed in its modern dimensionless form by Langebein [6] to represent the overall slope and forms of large drainage basins. At a later stage, Strahler [2] [7] - [9] , Miller [10] , and Schumm [11] have extended the methodology to investigate small drainage basins of lower order. The hypsometric integral is employed as an estimator of the erosion status of a drainage basin, and subsequent prioritization for taking up soil and water conservation activities [4] [12] [13] ; [5] [14] . Further, it illustrates the interaction between tectonic uplift and erosion [3] . The hypsometric curve and hypsometric integrals are significant indicators of stages of geomorphic evolution [2] with respect to the cycle of erosion, or the total time needed to reduce the topographic elevation to the base level.
Strahler [1] evaluated different shapers of hypsometric curves through the comparison of different drainage basins, and classified basins according to their stages of geomorphic evolution (Figure 1) as: youth stage (convex upward curves, where Hi ≥ 0.60), where the watershed is highly susceptible to erosion and landsliding;
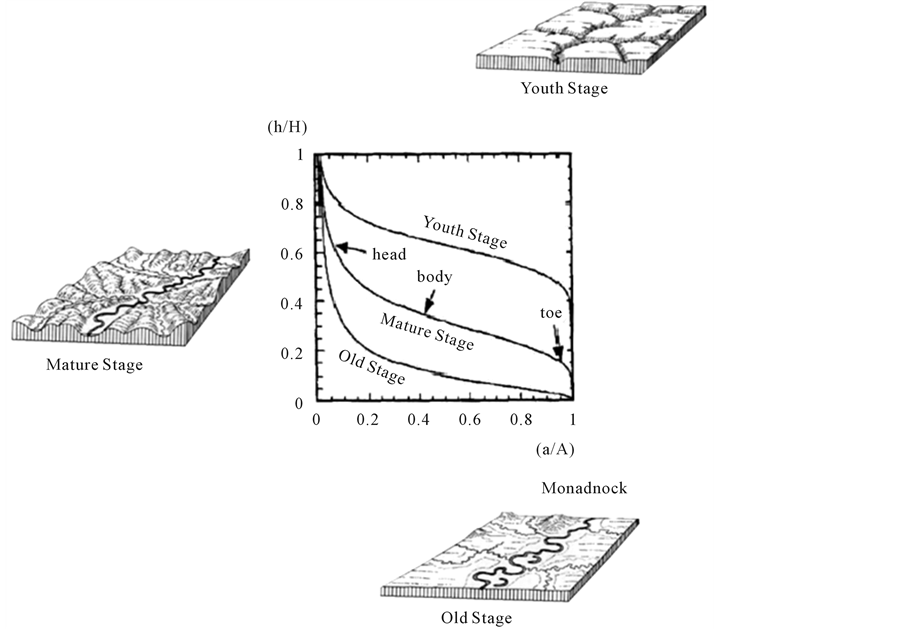
Figure 1. The types of hypsometric curves (youth, mature and old stages of geomorphic development) as elaborated by Strahler [8] [9] .
equilibrium or mature stage (S-shaped hypsometric curve which concave upward at high elevations and convex downward at low elevations, where 0.30 ≤ Hi ≤ 0.60); and pereplain (old) or monadnock stage (concave upward curve, where Hi ≤ 0.30). Variation in the shape of hypsometric curves exists during the early stages of geomorphic evolution, but followed by minimal variation after the drainage basins achieved equilibrium or mature stage. Both hypsometric parameters (HC and Hi) have a great bearing on the erosional characteristics of watershed, thus, it is an indicator of the “fluvial cycle of erosion” [1] . Hypsometric curves plotted for homogenous landforms related to hundreds of small drainage basins (third and fourth order) from different regions show stable (mature) hypsometric curve properties which resemble the model of hypsometric function [1] . However, there is still a marginal but distinct difference in the shapes of HC for different watershed regions [15] .
Strahler [1] stated earlier that hypsometric integral (Hi) was negatively correlated with drainage basin height, slope steepness, stream channel gradients and drainage density. No correlation exists between hypsometric integrals, and either bifurcation ratios or length ratios. By contrast a positive correlation is evident between the average length of stream segments of any given order in each area, and the corresponding mean hypsometric integrals, where progressive decline in stream length in the same order is evident as the integrals diminish. Recently, important relationships were explored between the hypsometric integral and the area of watersheds in an active tectonic setting where other factors such as lithology, climate, and geologic structure are the same [14] . A strong relationship has been revealed for hypsometric integral classes and area classes with the number of watersheds in respective classes and the total area occupied by respective hypsometric and area classes. Willgoose and Hancock [16] employed the SIBERIA catchment evolution model to explore linkages between catchment pro- cess and hypsometry. The results show that the SIBERIA model is characterized by a high ability to predict the form of the hypsometric curve from a simple model of geomorphic processes.
Singh [12] employed hypsometric analysis to assess the erosion status of watersheds as an essential prerequisite for integrated watershed management and prioritization. He concluded that such procedures are vital to reduce soil erosion and to implement better land management practices. Kusre [17] also used the Hi values as an indicator for high surface runoff and thus, for prioritizing sub-watersheds for consideration. He argued that once the watersheds are identified, suitable measures can be planned on the basis of available finances. Sarangi and Bhattacharya [18] employed the Hi values as a morphological index to predict surface runoff and sediment yields from different watersheds.
Hypsometric integral (Hi) values were examined for two groups of watersheds draining into the Tyrrhenian Sea and the Adriatic Sea, Italy [19] . Low integral values of the Adriatic drainage basins are attributed to the spreading and effectiveness of denudational processes more than to an old stage of geomorphic cycle. Thus, hypsometric integrals/curves were explained in terms of tectonic history of the two sides of the Italian Peninsula. A hypsometric analysis was carried out by Markose and Jayappa [20] to evaluate hypsometric integrals and curves for 20 sub-basins of the Kali River, India. They succeeded to differentiate between sub-basins of younger geomorphic stages and subjected to recent tectonic activities (of high Hi values) and sub-basins approaching mature stage (low Hi values), and exposed to more erosion and less impacted by recent tectonic activities. Hypsometric analysis was employed by Lou [21] to explore the origin of valley network systems in the Margaritifer Sinus region of Mars in order to infer the underlying processes. He concluded that a number of basins are of sapping origin, while other basins are more fluvial like, suggesting a warm and wet climate of early Mars.
Hypsometric analysis, longitudinal and projected profiles description, and geomorphic investigation were conducted in the present research to extract valuable information on morphoevolution of the W. Mujib-Wala watershed in relation to tectonics and rejuvenation processes. Inspection of hypsometric curve shape and hypsometric integral values, provide information for determining the stages of geomorphic development, which in turn afford an indicator of watershed susceptibility to erosion, hillslope and wadi channel processes. Estimated sediment yield information [22] [23] were employed to verify the indirect assessment of erosion status based on hypsometric value. Consequently, previous information make it possible to distinguish erosion proneness as a first step to construct an appropriate soil and water conservation measures in the future to reduce, soil erosion rates and sediment yield in the watershed.
2. Study Area
Hypsometric analysis was carried out in W. Mujib-Wala watershed, Central Jordan. It is the second largest catchment draining to the Jordan Rift where it, flows westward and discharges directly into the Dead Sea. The study area extends between latitudes 30˚39' and 36˚33' north and longitudes 35˚30' and 30˚39' east (Figure 2). The watershed consists of two major tributaries: the W. Mujib (4507.8 km2) and W. Wala (2063.6 km2), and both tributaries merged 3 km before the Wadi discharge into the Dead Sea. Therefore, the entire watershed covers an area of 6571.4 km2.
Terrain elevation varies from −431 m (below sea level) to 1277 m (above sea level) east of Mazar town. The climate of the high plateau is classified as dry Mediterranean, with relatively cold winters and hot summers, while the canyons and lower reaches of the watershed close to the Dead Sea are arid. Mean annual rainfall ranges from 346 mm at Madaba (several kilometers to the northwest of the catchment), W. Wala weather station (266 mm), W. Mujib weather station (164 mm), Qasr (331 mm) and Rabba (335 mm). The average annual rainfall for the entire W. Mujib-Wala watershed is 184 mm [24] . Rainfall is concentrated in winter (October to March). Temperatures exhibit large seasonal and diurnal variations, with daily temperatures ranging from a maximum of >40˚C in August to a minimum of −5˚C in January.
The watershed is covered by a wide range of rock types, ranging from Cambrian sandstones to Quaternary fluvial and lacustrine deposits. The Kurnub sandstones (Lower Cretaceous) are exposed along parts of deeply incised courses to the western part of the catchment. It consists mainly of white, multi-coloured and grey sandstone, mostly medium to coarse-grained with beds of grey and brownish siltstone. The sandstones are overlain by the Turonian-Cenomanian Ajlune group, which consists of the Nodular limestone unit (or the marly clay unit), and the Echinodial limestone unit (or the limestone marl unit). The Eocene-Senonian rock unit (mainly chert, limestone, chalk and marl) dominates the eastern and southern parts of the watershed [25] [26] . The “soft rocks” (the Kurnub sandstone, Nodular limestone, and Echinoidal limestone units) of low shearing resistance represent a major factor influencing slope instability and soil erosion loss. Several faults across the watershed are occasionally obscured under the displaced materials of old landslide complexes. The weathered Shihan plateau basalt, W. Wala, and W. Balue basalts at the lower reaches of the watershed are of late Miocene/Early Pliocene age. Quaternary materials in the catchment are restricted to three fluvial terrace levels which exist in the central Mujib canyons. The terrace accumulations are of early Holocene, Early and Middle Pleistocene age [27] .
Five dams were constructed across the W. Mujib-Wala catchment. The most important are: the W. Mujib dam and W. Wala dam. The yield of W. Mujib dam is 16.8 MCM, and it is intended to provide water to the southern Ghor irrigation project, the Arab Potash Company, the Dead Sea chemical complex, and to the development of the eastern shore of the Dead Sea. By contrast, the yield of W. Wala dam is ≈10 MCM. It is aimed for groundwater recharge, and to provide water to the springs and pumping wells in the lower reaches of the wadi [26] .
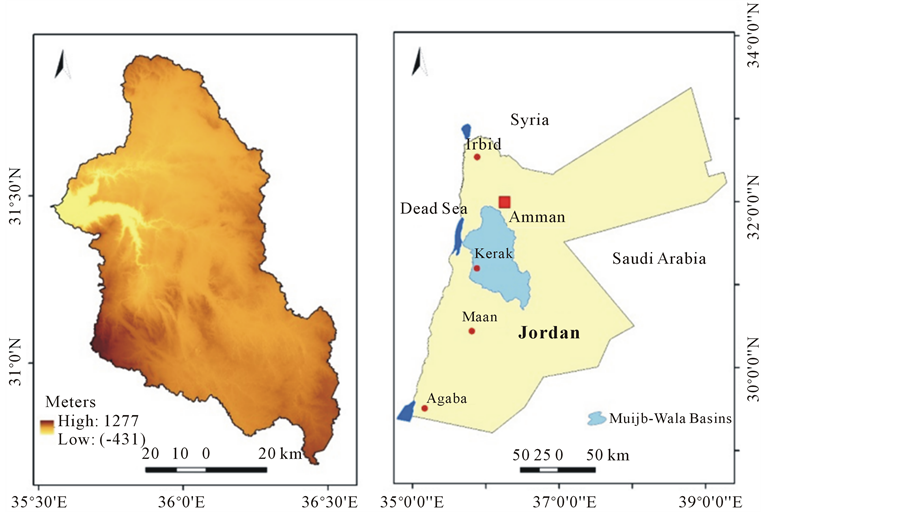
Figure 2. Location of wadi Mujib-Wala watershed (the study area).
Agriculture in the watershed is restricted to rainfed farming (wheat and barely), irrigated vegetable farming, olive and orchard farming, green house farming, and chicken farms. Agricultural land use constitutes about 7% of the total watershed. The western sector of the catchment is part of the Mujib Natural Reserve. It contains hundreds of plants and carnivorous species, and numerous species of resident and migratory birds. Wadi beds accommodate palm trees, wild fig, tamarisk trees and oleander shrubs.
3. Materials and Methods
Topographic maps with a scale 1:50,000 (20 m contour interval) were acquired from the Royal Jordanian National Geographic Centre (RJNGC). Topographic information was digitized and geo-referenced with Universal Transverse Mercator projection (WGS 1984, Zone 36˚N) using Arc GIS tools. The contours were also digitized to generate the line feature class in Arc GIS, then by using the Spatial Analyst Module an ASTER DEM (30 m resolution) was established. Then the drainage networks for W. Mujib-Wala and the 28 fourth order sub-basins were generated and digitized using the Arc GIS 10.1 software package. Stream order was assigned to each stream following the stream ordering system developed by Strahler [7] - [9] . The entire W. Mujib-Wala was found of seventh order. The main watershed and sub-watershed areas, perimeters, and length of watersheds were measured using GIS software. The hypsometric curve and hypsometric integral, maximum elevation, minimum elevation, and mean elevation and slope of watershed were calculated using DEM and GIS software. The attribute feature classes that accommodate these values were utilized to plot the hypsometric curves for the watersheds studied, from which the Hi values were estimated. Although different methods were elaborated to estimate the hypsometric integral [15] , the hypsometric integral values (Hi) in the present investigation were calculated using the elevation-relief ratio method proposed by Pike and Wilson [28] . Using the elevation-relief ratio method is found to be more accurate and easy to calculate within the GIS environment.
The relationship is expressed as:

where, E is the elevation relief ratio equivalent to the hypsometric integral Hi; Elevmean is the weighted mean elevation of the watershed estimation from the identifiable contours of the delineated watersheds, Elevmin and Elevmax are the minimum and maximum elevations within the watershed. Indirect assessment of erosion status across the W. Mujib-Wala watershed based on hypsometric integral values was validated using the estimated sediment yield results achieved through the application of Soil and Water Assessment Tool (SWAT) for the W. Mujib catchment, and W. Wala basin separately [22] [23] . Verification of the accuracy of fieldwork observations was accomplished based on hypsometric curves, hypsometric integral values, projected profiles established across W. Mujib-Wala, and longitudinal profiles for several wad is in the area under consideration.
4. Results and Discussions
Results of the present investigation are discussed in terms of the following sub-headings: hypsometric curve shape; hypsometric integrals; hypsometric integral and watershed area; tectonic control, geomorphic evolution and rejuvenation; incised meanders, longitudinal and projected profiles.
4.1. Hypsometric Curve Shape
Previous studies demonstrate that in small watersheds, the hypsometric curves are normally convex, indicating the dominance of hillslope processes. Whereas, large watersheds exhibit concave curves denoting the dominance of fluvial processes [4] [29] . The hypsometric curves of the entire W. Mujib-Wala, W. Mujib, and W. Wala watersheds, and the 28 sub-basins exhibit remarkably convex upward curves (Figure 3). This type of hypsometric curves shape is also characteristic of the Jordan Rift watersheds, and the catchments of Ras En Naqb escarpment, southern Jordan [30] - [32] . Hypsometric parameters were calculated for the W. Mujib-Wala watershed and sub-basins, and hypsometric curves have been plotted and prepared. Graphical inspection of the HC and examining of Hi values revealed that 1) all the curves indicate that the watershed and sub-basins are at the youth-age stage of geomorphic development, and 2) marginal differences exist in mass removal from the watershed and the 28 sub-basins, due to variation in tectonic effect, lithology and rejuvenation processes.
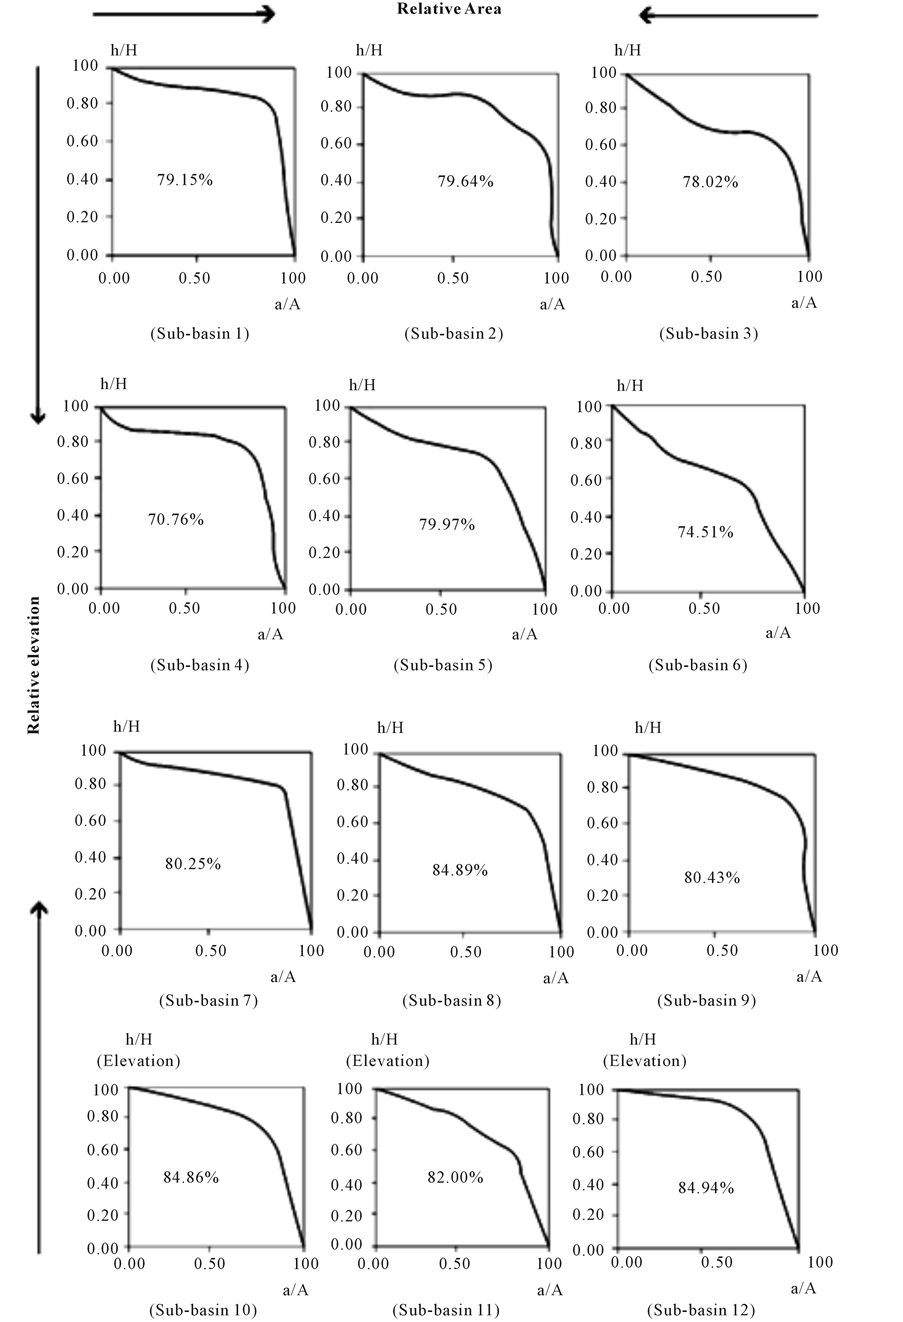
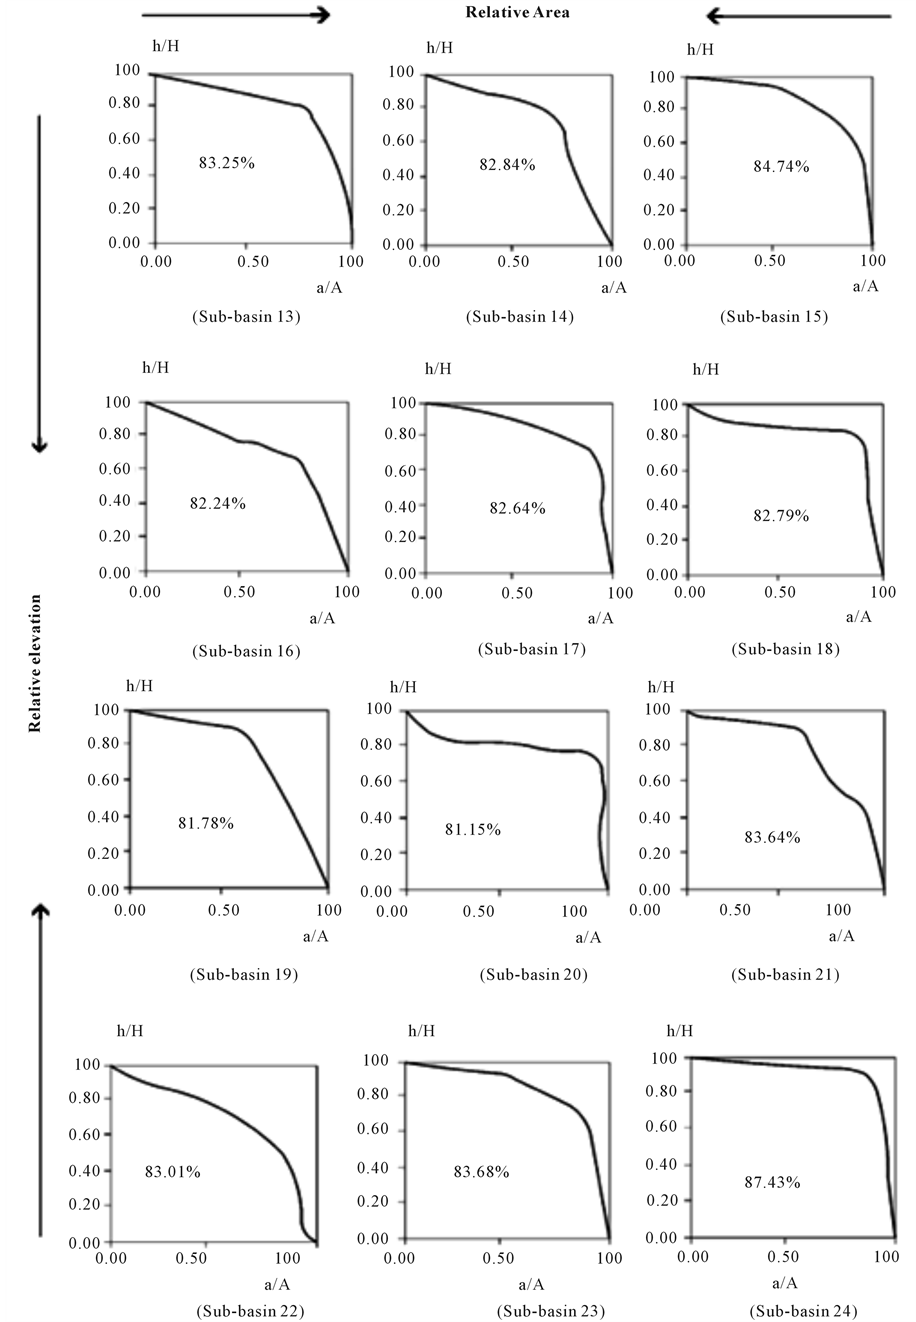
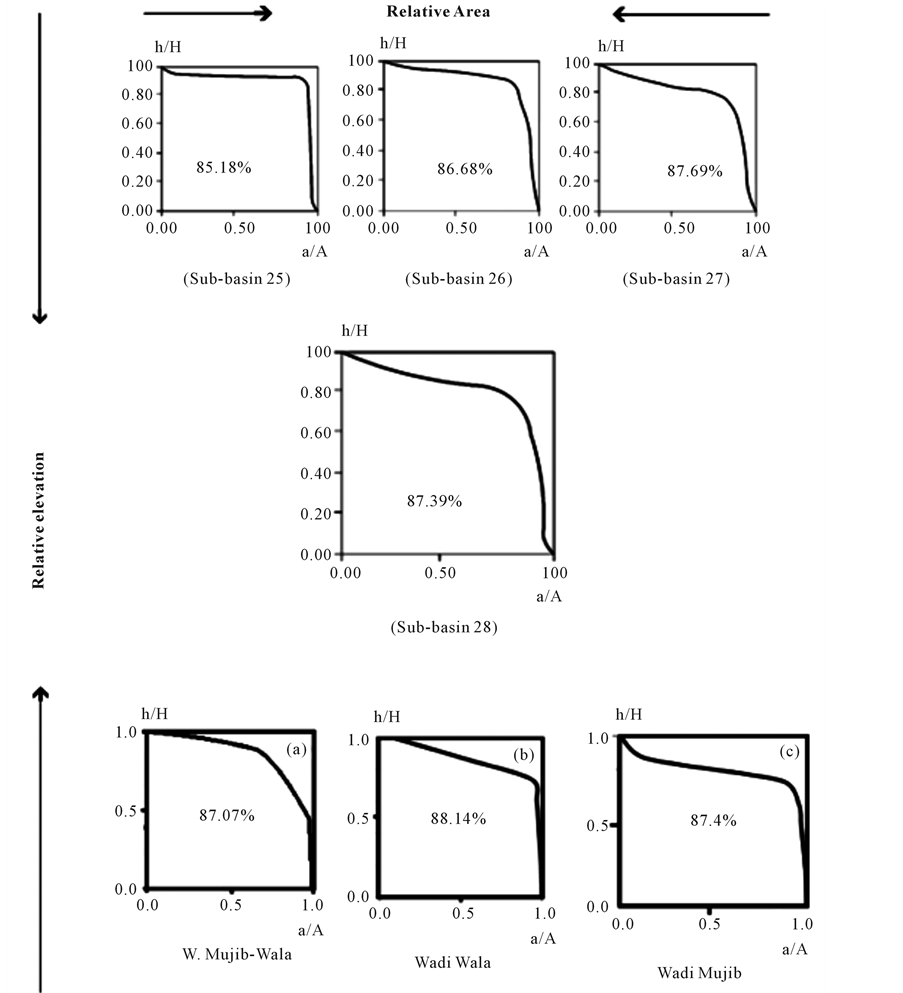
Figure 3. Hypsometric curves of twenty eight sub-basins (sub-basin 1 to sub-basin 28). Hypsometric curves (a), (b) and (c) represent wadi Mujib-Wala, wadi Wala and wadi Mujib respectively.
Although all present hypsometric curves are of convex upward shapes, it was possible to distinguish three groups of curves. The first group is characterized by a smooth convex shape, with an average Hi value of 0.70 (sub-basins 1 - 6). This group represents the sub-basins of a late youth stage of evolution, and relatively older than other sub-basins. They are located close to the remnants of the Arabia Surface to the northeast and south east shoulders of the watershed. The second group of curves is characterized by a slightly sharp convex upward shape with an average of Hi value of 0.83 (sub-basins 4 - 20), demonstrating significant influence of rejuvenation associated with severe incised erosion and active slope processes. The third group of curves is characterized by a very sharp convex upward shape with an average of Hi value 0.87 (sub-basins 21 - 25). This group of sub-basins represents the early youth stage of geomorphic development. Sub-basins 21 - 25 occupy the western parts (lower reaches) of the W. Mujib-Wala watershed which are affected by successive stages of rejuvenation processes as a result of base level changes along the Dead Sea (the lowest base level in the Jordan Rift). Opposite to the mouth of W. Mujib-Wala, the Dead Sea attains a maximum depth of some −401 m below its surface, at a point near its eastern coast midway between the mouths of W. Hasa and W. Zerqa Ma’in to the south and north of W. Mujib-Wala respectively. At this point, the bottom of the Dead Sea is at-815 below sea level. Beneath much of this northern area the sea is more than 300 m in depth [25] . In light of successive subsidence of the Dead Sea, and the resultant sea level changes, a high-magnitude rejuvenation phase affects the entire watershed and the sub-basins. Therefore, rejuvenation resulted in deeply dissected topography, dense incised drainage, and over steepened and interrupted slopes. Moreover, the entire catchment suffers from serious geomorphic hazards, such as slope instability, high sediment yield [22] [23] , floods and severe soil erosion. Deforestation, land use/landcover changes, overgrazing, and poor conservation measures maximize soil erosion. Soil erosion from the entire watershed and its sub-basins were attributed essentially from the incision of channel beds, landslide movement of regolith and bedrock materials, washout of top soil, and undercut erosion of stream banks.
4.2. Hypsometric Integrals
Recently, Markose and Jayappa [20] postulated that hypsometric integral controls the shape of a hypsometric curve and thereby provides indicators for geomorphic evolution of drainage basins. In the present case study, hypsometric integrals vary from 0.71 to 0.88. Other morphometric characteristics are slightly or highly varied among the twenty eight sub-basins also (Table 1). The W. Mujib and W. Wala watersheds display a high Hi value of 0.87 and 0.88 respectively. Although noticeable variation is present in Hi values among the 28 sub-ba- sins, two important categories of Hi are dominant. The first category ranges from 0.80 to 0.85, and dictates the eastern and southern parts of the watershed (Figure 4). The second category (Hi > 0.85) characterizes the western part of the watershed, or what Burdon [25] has termed the “rejuvenation belt” (Figure 5). A third category of Hi values (0.70 - 0.80) is restricted to six sub-basins located adjacent to the eastern and southern margins of W. Mujib-Wala watershed. High values of Hi indicate that the watershed and the sub-basins are attaining the youth-age stage of geomorphic evolution. High Hi values also indicate high total runoff with subsurface pro- cesses as the major geomorphic processes [33] . Without exception, all the 28 sub-basins are considered to be
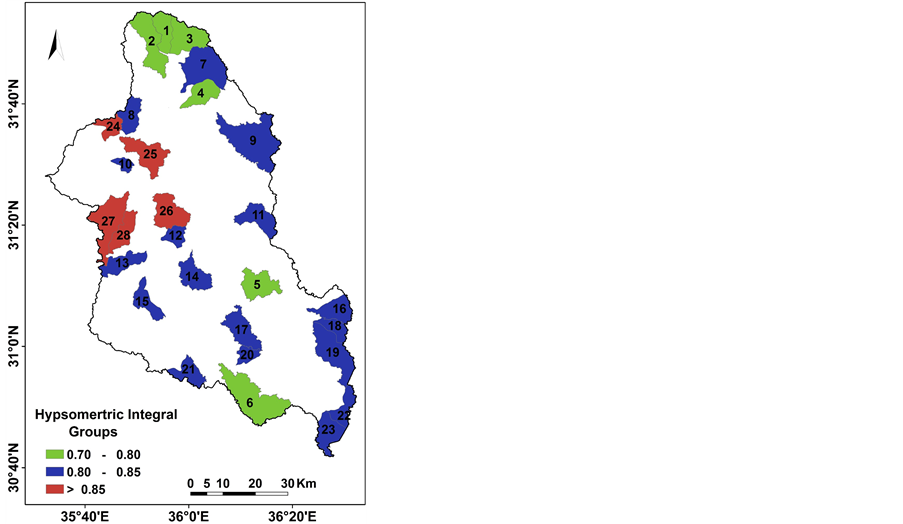
Figure 4. The distribution of the twenty eight sub-basins and the hypsometric and the hypsometric integral groups.

Table 1. Hypsometric integral values and sub-basin parameters of W. Mujib-Wala.

Figure 5. The rejuvenation belt, eastern sector, and the structure across W. Mujib-Wala watershed.
of high susceptibility to erosion, incised channel erosion and mass movement. This conclusion is verified by the high soil erosion loss estimated for W. Kerak using RUSLE approach [34] , and for the W. Wala catchment, and W. Mujib watershed using the SWAT model [22] [23] . It has been reported that lower and middle reaches of W. Kerak suffer from high, severe, and extreme soil erosion loss, and the presence of large old landslide complexes, while the most activated shallow landslides are limited to the middle and upper catchment. Similarly, predicted average sediment yield for W. Wala was 143,780 ton/year and 123,100 ton/year for the prediction periods November 2002-December 2007 and 2008-2020 respectively. Furthermore, the predicted average annual sediment yield for W. Mujib is about 341,887 tons/year for the period 2007 to 2020. Such high figures represent a serious threat to the Wala and Mujib reservoirs through reducing the operational life of the dams by decreasing their active storage. The sub-basins which show greater susceptibility to soil erosion are located in the western and northern parts of the W. Mujib-Wala catchment. Consequently, management and conservation practices must be applied urgently especially for the western and northern sub-basins of the watershed [22] . Variation in geomorphic, topographic, rainfall, soil, and land use, and cover conditions has caused variation in spatial soil erosion loss rates. Here Hi values are probably attributed to young active tectonics (uplifting, downfaulting and subsidence, and recurrent lowering of the base level and continuous rejuvenation). Relatively low Hi values pertained to sub-basins located at the eastern and southern parts of W. Mujib-Wala watershed indicating that these sub-basins are less impacted by recent tectonic activity and head-ward erosion, where remnants of the Arabia Surface still stand adjacent to the southern and northern shoulders of the catchment. The sudden changes in the directions of streams are correspond well with apparent directions of the faults, structural joints and river capture [27] denoting that fluvial incision is concentrated along tectonic lines characterized by rock weakness and discontinuity.
4.3. Hypsometric Integral and Watershed Area
It has been stated recently that in small catchments, the hypsometric curve is convex and the value of the hypsometric integral approaches unity, denoting the dominance of hillslope processes. By contrast, large watersheds exhibit concave curves, and the integral approaches zero with fluvial processes dominate [4] [16] . However, Markose and Jayappa [20] employed regression analysis to examine the scale dependency, i.e. the relation between basin area and hypsometric integral, although the area (parameter) within their case study varies remarkably, along with the existence of asymmetric distribution of the area of sub-basins across the watershed. Regression analysis reveals that Hi and area have a positive relation in small basins, whereas when the area increases, the relationship becomes negative and weak (r2 ranges from 0.01 to 0.34). This confirms that the hypsometric integral is controlled by the basin area in small sub-basins rather than large ones. In the present study, the relationship between area and the hypsometric integral was evaluated. Area variations between the 28 mini-water- sheds are not large; therefore, regression analysis was conducted on three Hi value classes (0.70 - 0.80; 0.80 - 0.85; and >0.85) and the entire set of data (the 28 mini-watersheds). Again analysis reveals that negative and weak relationships dominate, where r2 ranges from 0.05 for the highest Hi value class to 0.478 for all mini- watersheds (Figure 6), which confirms the results reported earlier [20] .
4.4. Tectonic Control, Rejuvenation, and Geomorphic Evolution
The geomorphic evolution of the W. Mujib-Wala drainage system was achieved largely as a response to tectonic
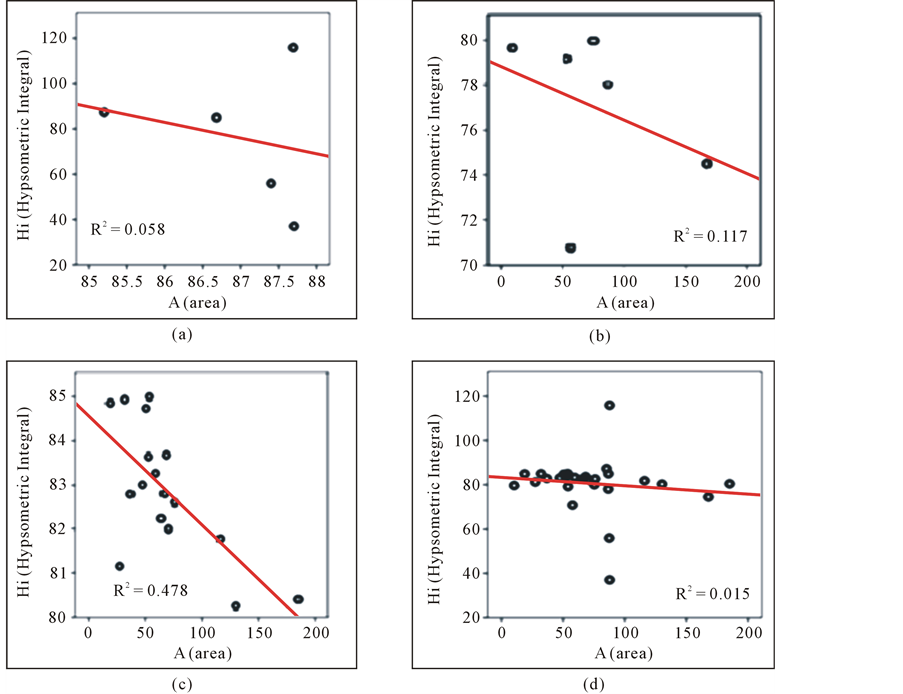
Figure 6. Statistical relationship between the area and the hypsometric integral groups of the twenty eight mini-watersheds. Note that negative relations exist between the area and Hi.
activity along the Dead Sea Rift and its eastern shoulder, and tectonic lineaments across the watershed. Remnants of the erosional peneplain (the Arabia Surface) which formed during the Upper Oligocene [35] provide a datum plane for reconstructing subsequent development including the role of tectonics and tectonic lineaments in this regard. Extensive degradation that took place during the Upper Miocene-Pliocene, stripped the Arabia Surface (900 m a.s.l) from the greater part of the watershed. Remnants of the Arabia Surface are exposed 10 km northeast of W. Mujib-Wala shoulder at cuesta el Falij-el Mudeisisat, and 20 km from the southern part of the watershed at cuesta Um Rijam. Intense erosion can be found in the Upper Miocene-Pliocene planation surface east of the uplifted shoulder. The rejuvenated canyons during the lower Pleistocene destroyed this surface which is preserved partially at the south western part of the W. Mujib-Wala watershed adjacent to W. Kerak.
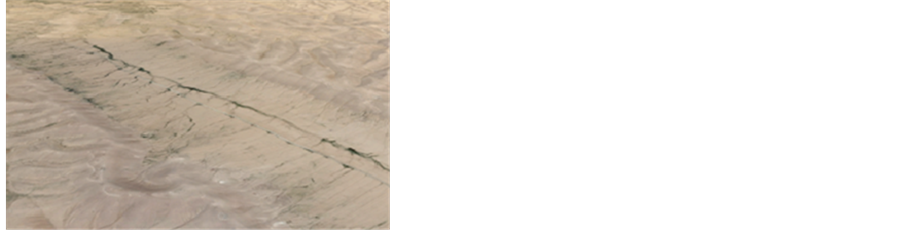
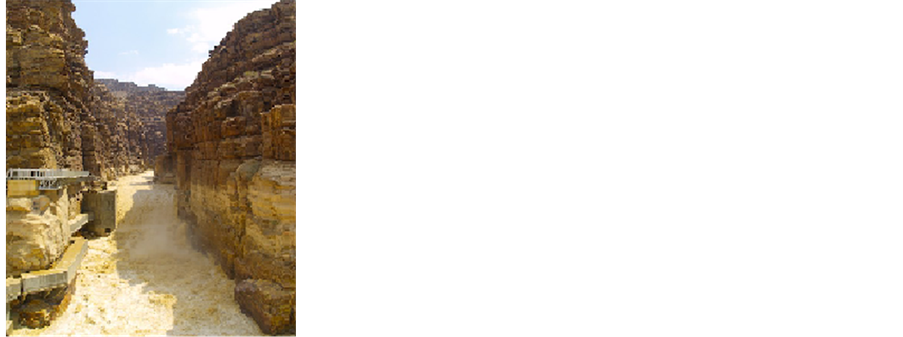
High tectonic uplift of the eastern rift shoulder over a range of 1000 - 1500 m, formed the plateau which dominates the western part of the watershed. Intense subsidence of the base level at the Dead Sea is also the main cause for the extensive, high rate of Pliocene-Pleistocene fluvial incision along the deep canyons and major tributaries. The development of drainage networks was encouraged by tectonic lineaments and the presence of soft rock units. The direction of major streams occasionally corresponds well with apparent directions of faults and structural joints, indicating that fluvial incision is concentrated along tectonic lines characterized by rock weakness [27] . In this context, the W. Mujib-Wala canyons are situated between the Shihan-Siwaqa fault system (E- W direction), and the Zerqa-Ma’in fault system (E-W direction) northwest of the watershed. The NW-SE Kerak Al-fiha fault system is another major tectonic belt affecting W. Mujib-Wala, and runs along the south-eastern shoulder of the watershed (Figure 5). The normal graben-faults in the SE of W. Mujib-Wala canyons zone, seem to form a northern offshoot of the Kerak Al-fiah fault system, especially in the Faj el Useiker-W. Hafira area. There is an E-W broad asymmetrical anticline bounded by the Shihan-Siwaqa fault system, and to the north by the Dhiban E-W synclinal axis. Furthermore, the deep canyon of W. Nukheila runs generally NNW-SSE crossing the Lajjun syncline [25] [27] [35] . Moreover, the W. Mujib-Wala has cut through some 1750 m of rocks ranging in age from Eocene chert limestone and Cambrian sandstone, thus producing spectacular incised deep canyons [25] . The dimensions of W. Mujib canyon adjacent to the bridge is 7000 m width, and 700 - 800 m depth (Figure 7(a)). Such a huge range of downcutting indicates that W. Mujib-Wala and other streams draining to the rift have persisted at least since the upper Miocene. Furthermore, the Dead Sea base level can be described as unique in terms of elevation (depth), tectonic instability, recurrent lowering of its base level due to intense subsidence, and the accumulation of thick sediments deposited through geological time. As a result, the Dead Sea level dropped from −392 m in the early 1930s to - 414 m in 1998―a total sea level drop of 22 m, averaging about 32 cm per year. The rate at which the Dead Sea level dropped is exceeding 0.50 m annually [36] . Therefore, rapid decline in the Dead Sea level is an ongoing process at present, and rapid changes in base level have resulted in upstream progressing incision. The slope of the newly exposed foreshore is often steeper than the wadis, leading to prominent downcutting of the main wadi channels and upstream migration of the knickpoints. Based on the results of headward incision rates obtained by Hassan and Klien [36] for the main channel of the Jordan River, it is postulated that head-ward incision by main channels of W. Mujib-Wala is in progress, especially in soft rocks. Adding to that, the sinking floor of the Jordan Rift retained progressive downcutting and incision in channels bedrock (Figure 7(b)) as verified by field observations, but grade (i.e. the start of forming a flood plain) was never attained from early Pleistocene tectonics.
The rejuvenated canyons during Lower and Middle Pleistocene have partially destroyed the Miocene-Pli- ocene surface to the north of W. Kerak, and the pre-existing drainage system was also disturbed. Therefore, Wadi Kerak and other major streams/tributaries draining to the rift were beheaded, thus, W. Mujib captured the truncated drainage part of W. Kerak [26] . Field observations demonstrate that the present dimension of the large gorge of the Wadi is out of proportion when compared with its present small and misfit watershed. The only explanation for this situation is that W. Kerak was beheaded at one time due to uplifting, and was never be able to recover its former drainage basin. The graben created by the NW-SE Kerak Al-Fiha fault system, and which W. Kerak follows, continues a few kilometers south east of Kerak city in Faj el Useiker [37] , which is separated from the present catchment due to uplifting of the land block east of Kerak probably during lower Pleistocene tectonics. As a result the upper part of the canyon has been blocked, while the lower course now forming the wadi, remained open towards the rift. Then, at a later stage the Faj el Useiker (Figure 7(c)) was captured by an active tributary of W. Mujib. Similarly, the normal graben-faults in the southern part of W. Mujib canyon facilitate active head-ward erosion of W. Mujib tributaries, so as to reach a number of depressions and divert their drainage towards W. Mujib catchment. The tributaries of W. Bu Weija, W. el Musheimish, and W. el Hafira are
 (a) (c)
 (b) (d)
Figure 7. Heavy and deep bedrock incision in the W. Mujib-Wala ((a), (b) and (d)), and Faj el Useiker (c) small graben.
representative examples (Figure 5). During a still-stand period in the Middle Pleistocene, Wadi Dabba a tributary of W. Mujib, also captured and drained el Lajjun lacustrine lake which occupied a synclinal depression 18 km east of Kerak city. Continued degradation in the lower reaches of the watershed resulted in deep incision of the canyon complex.
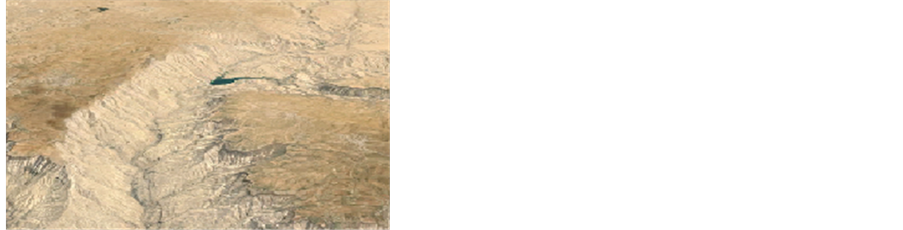
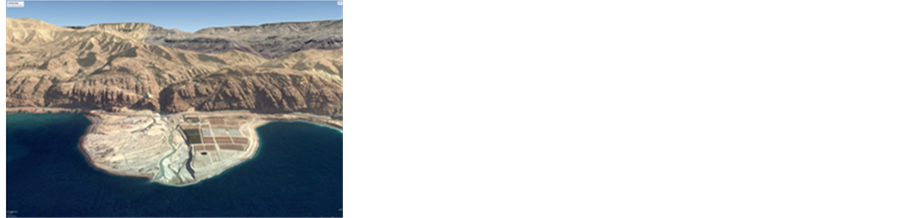
Vertical cliffs of Cambrian sandstone are characteristic of the mouth area (Figure 7(d)), where W. Mujib- Wala discharges directly into the Dead Sea, but no large, active delta exists (Figure 8(a)), considering large estimated sediments (113 km3) eroded during the development of the watershed canyons [25] . Irrespective of the enormous volume of the Dead Sea (135 km3), the absence of subaerial delta sediments is attributed to the Upper Pleistocene and Holocene down faulting along the eastern rift fault. Khalil [38] suggests that several 100 m post-Lisan down faulting have commenced. Also, a zone of breccias was identified just to the south of W. Mujib-Wala fandelta, and considered a remnant of the post-Miocene fandelta. Recent gravimetric surveys indicate the Dead Sea basin covers a sediment sequence reaching 1000 m [39] . The pressure exerted by thick sediment deposits, neotectonic activity, and seismic shock are possibly causing a gradual sinking of the eastern margins of the rift floor at a rate equal to, or even exceeding that of continuous sedimentation at the mouth of W. Mujib- Wala.
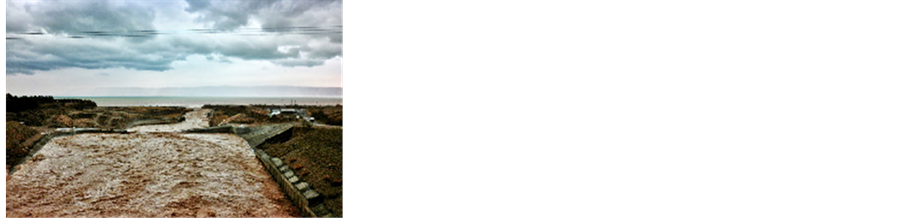
The Holocene fluvial terrace has been incised, renewed bedrock incision, and active head-ward erosion by major and minor tributaries has been observed recently [27] . It is believed that geomorphic evolution, rejuvenation pattern, and intense incision are responsible for the presence of sharp convex upward hypsometric curves and high values of Hi, an indication that the watershed and the 28 sub-basins are of high susceptibility to erosion, mass movement and flooding (Figure 8(b)) especially in the lower reaches of the watershed.
4.5. Incised Meanders, Longitudinal, and Projected Profiles
Different types of incised meanders were formed along W. Mujib-Wala tributaries. They were inherited from former drainage which existed on the senile plateau surface before, rejuvenation took place, and some of them
 (a) (b)
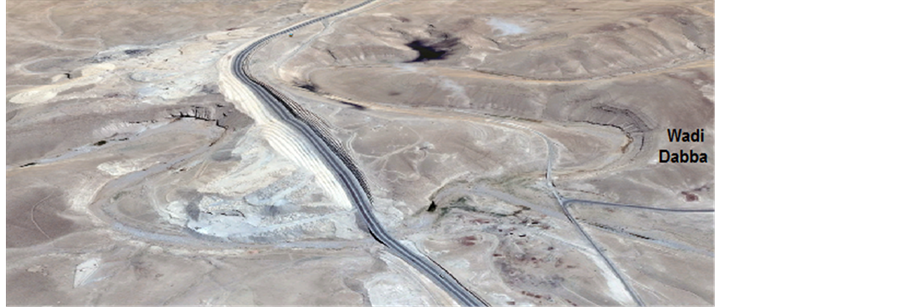 (c)
(c)
Figure 8. Small fan delta of W. Mujib-Wala (a), repetitive flooding of wadi Mujib (b), and (c) intrenched meanders in wadi Dabba.
are controlled by tectonic lineaments. Meanders in the Upper W. Nukheila for example, are typical tectonic controlled meanders. Due to tectonic uplift and continuous downcutting, antecedent meanders are also observed, and wadi courses often reflected the presence of faults. Furthermore, meanders in the watershed also exist where sinuosity of undeep wadis incised in superficial deposits (i.e. soil and regolith cover). Wadi Dabba accommodated a typical example of intrenched meanders with a prominent asymmetrical cross-profile (Figure 8(c)). As the streams incised their courses following the lowering of base level, they managed to maintain the old bends, by adjusting to underlying structures, and thus spectacular incised meanders developed [30] .
The longitudinal profiles of W. Mujib, W. Wala, W. Balue (a tributary of W. Mujib) show that streams are far from attaining grade, where major interruptions are present along these profiles (Figure 9). A slightly short concave, or long straight segment was observed at the headwater area of the profiles, but no clear concave element appeared, which indicates that these wadis do not approach longitudinal equilibrium profile or “grade” as Davis has termed it. All wadis draining to the Jordan Rift do not follow this general tendency. Therefore, it can be demonstrated that age had no influence on the form of the longitudinal profiles. This is due to tectonic activity along the Dead Sea Rift and its eastern shoulder. Such conditions are still present and active as a result of continuing lowering and changes in the Dead Sea base level.
Although several knickpoints may be attributed to local variation in rock resistance to erosion, at least four major knickpoints are considered as rejuvenation points (700 m, 450 m, −100 m, and −250 m), since they coincide with at least three other wadi profiles to the north and south of W. Mujib-Wala watershed. It is believed that the upper two breaks between 700 m and 450 m are knickpoints truncating the Upper Miocene-Pliocene surface, and they may have developed during early Pleistocene tectonics, whereas the other lower two knickpoints (−100 m and −250 m) are probably attributable to the Upper Pleistocene tectonics. However, this fact is supported by major breaks observed on the projected profiles of W. Mujib, W. Wala, W. Nukheila, W. Sueida and W. Kerak (Figure 10, Table 2). The major interruptions characterized the longitudinal profiles of the wadis, and the presence of different types of incised meanders denote that rejuvenation processes occurred when these wadis were in the mature stage of their evolution, probably at the middle of Pleistocene. The distribution of major breaks and interruptions of slopes and profiles are considered a substantial product of tectonic uplifting, downfaulting,
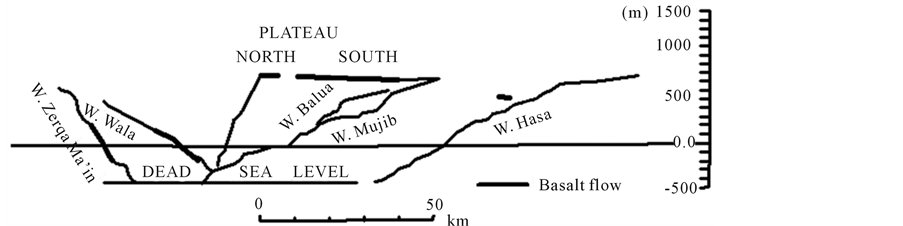
Figure 9. Major interruptions along the longitudinal profiles which considered as rejuvenation points (based on: [30] [35] [37] ).
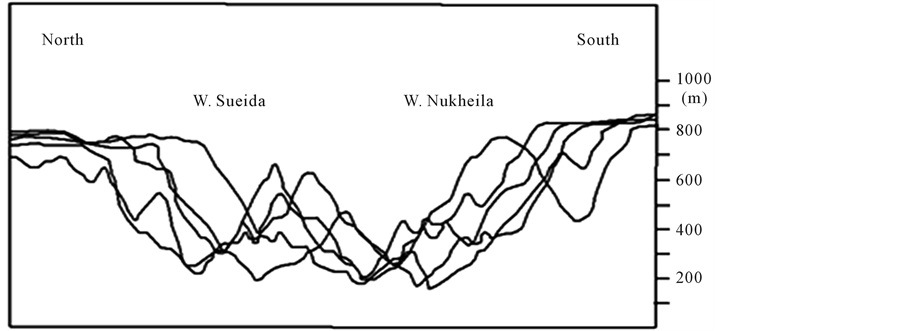
Figure 10. Superimposed profiles across W. Mujib major tributaries illustrate breaks along valley-side slopes which represent rejuvenation stages affected W. Mujib-Wala watershed.
Table 2. Height of breaks (m) along valley-side slopes of W. Mujib-Wala and tributaries.
Source: [30] [40] .
subsidence and rejuvenation, which resulted in a “poly-cyclic” drainage basins, as confirmed earlier by Chorely [41] .
5. Conclusions
Hypsometric analysis for the W. Mujib-Wala watershed and the 28 sub-basins was carried out to understand the age of landforms, and the type of erosive processes shaping the watershed. The hypsometric integral (Hi) is a functional parameter that intends to assess tectonic activity, erosion, and rejuvenation processes. The entire watershed and the 28 sub-basins show sharp upward convex hypsometric curves, and high hypsometric integral values (0.71 - 0.88) denoting that all catchments are at the youth age stage of geomorphic evolution. Thus, all watersheds are of high susceptibility to surface runoff, soil erosion loss, landsliding and flooding. Such processes are encouraged by the presence of structural discontinuities, and the exposure of soft rock units of low shearing resistance in the middle and lower reaches of the watershed.
High tectonic uplift of the eastern rift shoulder (1000 - 1500 m) and recurrent subsidence of the base level at the Dead Sea are the main cause of the extensive and high rate of Pliocene-Pleistocene fluvial incision along the deep canyons and main tributaries. Uplifting, subsidence of the Dead Sea floor, and rejuvenation processes associated with faults and structural joints accelerate head-ward erosion and stream captures. The impact of tectonics and rejuvenation on landforms development, progressive downcutting, and incision in channels bedrock, is verified through field observations. Major breaks and interruptions characterized the longitudinal/projected profiles, and the presence of different types of incised meanders indicated that rejuvenation processes occurred when W. Mujib-Wala was in the mature stage of its evolution, probably in the middle of Pleistocene. The knickpoints and discontinuities of valley-side slope truncated the upper Miocene-Pliocene surface, and might originate during Lower Pleistocene tectonics, while the lower breaks between −100 m to −250 m b.s.l initiated probably due to Upper Pleistocene tectonics.
Five mini-watersheds (24 - 28) close to the Dead Sea area and 17 mini-watersheds (7 - 23) which occupied the middle of W. Mujib-Wala watershed are characterized by higher hypsometric values. Such figures indicate the predominance of hillslope processes, including landsliding and flooding along the lower and middle reaches of the watershed. Other mini-watersheds (1 - 6) show lower values of Hi (0.70 - 0.80), indicating hillslope processes of lesser magnitude (i.e., shallow landslides and moderate soil erosion). Generally, sub-basins with lower Hi values have less total runoff with major contribution from surface runoff, whereas, for sub-basins with higher Hi values, the total runoff is higher with sub-surface runoff as major process [17] . The estimated average annual sediment yield for W. Wala was 143,780 ton/year and 123,100 ton/year for the prediction periods November 2002-December 2007 and 2008-2020 respectively. Furthermore, the predicted average annual sediment yield for W. Mujib is about 341,887 tons/year for the period 2007 to 2020. These estimated sediment yields were in conformity with the higher hypsometric integral values for the sub-basins and the entire W. Mujib-Wala watershed, which revealed the youthful nature of the watershed and the sub-basins. By contrast, the average annual sediment yield for W. Mujib is more than W. Wala, which means that W. Mujib and its sub-basins are more prone to erosion compared with W. Wala and its sub-basins. These results necessitate the construction of appropriate soil and water conservation measures across the watershed and its sub-basins to control soil erosion, to conserve water, and to reduce sediment discharge into the W. Mujib and W. Wala reservoirs.
Cite this paper
YahyaFarhan,AdelElgaziri,IbtisamElmaji,IntisarAli, (2016) Hypsometric Analysis of Wadi Mujib-Wala Watershed (Southern Jordan) Using Remote Sensing and GIS Techniques. International Journal of Geosciences,07,158-176. doi: 10.4236/ijg.2016.72013
References
- 1. Strahler, A.N. (1952) Hypsometric (Area-Altitude) Analysis of Erosional Topography. Geological Society of America Bulletin, 63, 1117-1141. http://dx.doi.org/10.1130/0016-7606(1952)63[1117:HAAOET]2.0.CO;2
- 2. Ritter, D.F., Kochel, R.C. and Miller, J.R. (2002) Process Geomorphology. McGraw Hill, Boston.
- 3. Weissel, J., Pratson, L. and Malinverno, A. (1994) The Length-Scaling Properties of Topography. Journal of Geophysical Research, 30, 151-159. http://dx.doi.org/10.1029/94jb00130
- 4. Hurtrez, J.E., Sol, C. and Lucazeau, F. (1999) Effect of Drainage Area on Hypsometry from Analysis of Small Scale Drainage Basins in the Siwalik Hills (Central Nepal). Earth Surface Processes and Landforms, 24, 799-808. http://dx.doi.org/10.1002/(SICI)1096-9837(199908)24:9<799::AID-ESP12>3.0.CO;2-4
- 5. Bishop, M., Shroder, J., Bonk, R. and Olsenholler, J. (2002) Geomorphic Change in High Mountains: A Western Himalayan Perspective. Global Planetary Change, 32, 311-329.
http://dx.doi.org/10.1016/S0921-8181(02)00073-5 - 6. Langbein, W.B. (1947) Topographic Characteristics of Drainage Basins. USGS Water Supply Paper, 947-C. 157 p.
- 7. Strahler, A.N. (1952b) Dynamic Basis of Geomorphology. Geological Society of America Bulletin, 63, 923-938. http://dx.doi.org/10.1130/0016-7606(1952)63[923:DBOG]2.0.CO;2
- 8. Strahler, A.N. (1957) Quantitative Analysis of Watershed Geomorphology. Transactions, American Geophysical Union, 38, 913-920. http://dx.doi.org/10.1029/TR038i006p00913
- 9. Strahler, A.N. (1964) Quantitative Geomorphology of Drainage Basins and Channel Networks. Section 4-II. In: Chow V.T., Ed., Handbook of Applied Hydrology, McGraw Hill, New York, 439-476.
- 10. Miller, V.C. (1953) A Quantitative Geomorphic Study of Drainage Basin Characteristics in the Clinch Mountain Area, Virginia and Tennessee, Project NR 389-042. Tech. Rept. 3, Columbia University, Department of Geology, ONR, Geography Branch, New York.
- 11. Schumm, S.A. (1956) Evolution of Drainage Systems and Slopes in Badland at Perth Amboy, New Jersey. Geological Society of America Bulletin, 67, 597-646.
http://dx.doi.org/10.1130/0016-7606(1956)67[597:EODSAS]2.0.CO;2 - 12. Singh, O. (2009) Hypsometry and Erosion Proneness: A Case Study in the Lesser Himalayan Watersheds. Journal of Soil and Water Conservation, 8, 53-59.
- 13. Singh, O. and Sarangi, A. (2008) Hypsometric Analysis of Lesser Himalayan Watersheds Using Geographical Information System. Indian Journal of Soil Conservation, 36, 148-154.
- 14. Singh, T. (2008) Hypsometric Analysis of Watersheds Developed on Actively Deforming Mohand Anticline Ridge, NW Himalaya. Geocarto International, 23, 417-427.
http://dx.doi.org/10.1080/10106040801965821 - 15. Singh, O., Sarangi, A. and Sharma, M. (2008) Hypsometric Integral Estimation Methods and Its Relevance to Erosion Status of Northwestern Lesser Himalayan Watersheds. Water Resources Management, 22, 1545-1560. http://dx.doi.org/10.1007/s11269-008-9242-z
- 16. Willgoose, G.R. and Hancock, G. (1998) Revisiting the Hypsometric Curve as an Indicator of Form and Process in Transport Limited Catchment. Earth surface Processes and Landforms, 23, 611-623. http://dx.doi.org/10.1002/(SICI)1096-9837(199807)23:7<611::AID-ESP872>3.0.CO;2-Y
- 17. Kusre, B.C. (2013) Hypsometric Analysis and Watershed Management of Diyung Watershed in North Eastern India. Journal Geological Society of India, 82, 262-270.
http://dx.doi.org/10.1007/s12594-013-0148-x - 18. Sarangi, A. and Bhattacharya, A. (2000) Use of Geomorphological Parameters for Sediment Yield Prediction from Watersheds. Journal of Soil and Water Conservation, 44, 99-106.
- 19. D’Alessandro, L., Del Monte, M., Fredi, P., Lupia Palmieri, E. and Peppoloni, S. (1999) Hypsometric Analysis in the Study of Italian Drainage Basin Morphoevolution. Transactions, Japanese Geomorphological Union, 20, 187-202.
- 20. Markose, V.J. and Jayappa, K.S. (2011) Hypsometric Analysis of Kali River Basin, Karnataka, India, Using Geographic Information System. Geocarto International, 26, 553-568.
http://dx.doi.org/10.1080/10106049.2011.608438 - 21. Lou, W. (2002) Hypsometric Analysis of Margaritifer Sinus and Origin of Valley Network. Journal of Geophysical Research, 107, 5071.
- 22. Ijam, A. and Tarawneh, E. (2012) Assessing of Sediment Yield for Wala Dam Catchment Area in Jordan. European Water, 38, 43-58.
- 23. Ijam, A. and Al-Mahamid, M. (2012) Predicting Sedimentation at Mujib Dam Reservoir in Jordan. Jordan Journal of Civil Engineering, 6, 448-463.
- 24. Ionides, M. (1939) Report on the Water Resources of Transjordan and Their Development. Crown Agents, London.
- 25. Burdon, D. (1959) Handbook of the Geology of Jordan. Benham and Co., Colchester.
- 26. Bender, F. (1975) Geology of the Arabian Peninsula: Jordan. United States Geological Survey Professional Paper 560-I, Washington DC.
- 27. de Jaegar, C. and de Dapper, M. (2002) Techtonic Control in the Geomorphic Development of the Wadi el-Mujib Canyon (Jordan). EGU Stephan Mueller Special Publication Series, 2, 83-94.
http://dx.doi.org/10.5194/smsps-2-83-2002 - 28. Pike, R.J. and Wilson, S.E. (1971) Elevation-Relief Ratio, Hypsometric Integral and Geomorphic Area-Altitude Analysis. Geological Society of America Bulletin, 82, 1079-1084. http://dx.doi.org/10.1130/0016-7606(1971)82[1079:ERHIAG]2.0.CO;2
- 29. Willgoose, G.R. (1994) A Physical Explanation for an Observed Area-Slope-Elevation Relationship for Declining Catchments. Water Resources Research, 30, 151-159. http://dx.doi.org/10.1029/93WR01810
- 30. Farhan, U. (1971) Geomorphological Analysis of Wadi Mujib and Wadi Kerak, Central East Jordan. Master’s Dissertation, University of Jordan, Amman.
- 31. Al-Bolooshi, A. (1997) Geomorphology of Ras En Naqb Escarpemtn, Southern Jordan. Master’s Dissertation, University of Jordan, Amman.
- 32. Farhan, Y., Anaba, O. and Salim, A. (2016) Geomorphometric Analysis of Ras En Naqb Watersheds, Southern Jordan, Using Remote Sensing and GIS. In Review.
- 33. Vivoni, E.R., Di Benedetto, F., Grimaldi, S. and Eltahir, E.B. (2008) Hypsometric Control on Surface and Subsurface Runoff. Water Resources Research, 44, Article ID: W12502.
- 34. Farhan, Y. and Nawaysa, S. (2015) Spatial Assessment of Soil Erosion Risk Using RUSLE and GIS Techniques. Environmental Earth Sciences, 74, 4649-4669. http://dx.doi.org/10.1007/s12665-015-4430-7
- 35. Quennell, A. (1958) The Structure and Geomorphic Evolution of the Dead Sea Rift. Quarterly Journal of the Geological Society, 114, 1-24. http://dx.doi.org/10.1144/gsjgs.114.1.0001
- 36. Hassan, M. and Klein, M. (2002) Fluvial Adjustment of Lower Jordan River to a Drop in the Dead Sea Level. Geomorphology, 45, 21-33. http://dx.doi.org/10.1016/s0169-555x(01)00187-8
- 37. Beheiry, S. (1969) Geomorphology of Central East Jordan. Bulletin de la Societe de Geographie D’Egypt, 41-42, 5-22.
- 38. Khalil, B. (1992) The Geology of the Ar Rabba Area—Map Sheet No. 3152 IB. Bulletin 22, Geology Directorate, NRA, Geological Mapping Division, Amman, 106 p.
- 39. Ten Brink, U.S., Ben-Avraham, Z., Bell, R.E., Hassouneh, M., Coleman, D.F., Anreasen, G., Tibor, G. and Coakley, B. (1993) Structure of the Dead Sea Pull-Apart Basin from Gravity Analysis. Journal of Geophysical Research, 98, 21877-21894. http://dx.doi.org/10.1029/93JB02025
- 40. Farhan, Y., Anbar, A., Enaba, O. and Al-Shaikh, N. (2015) Quantitative Analysis of Geomorphometric Parameters of Wadi Kerak, Jordan, Using Remote Sensing and GIS. Journal of Water Resources and Protection, 7, 456-475. http://dx.doi.org/10.4236/jwarp.2015.76037
- 41. Chorely, R. (1958) Aspects of the Morphometry of a “Polycyclic” Drainage Basin. The Geographical Journal, 124, 370-374. http://dx.doi.org/10.2307/1790789