American Journal of Molecular Biology
Vol.1 No.3(2011), Article ID:7781,9 pages DOI:10.4236/ajmb.2011.13017
Codon bias of influenza a viruses and their hosts
![]()
Department of Computer Science, Houghton College, Houghton, USA.
Email: *Wei.Hu@Houghton.edu
Received 7 April 2011; revised 10 June 2011; accepted 1 July 2011.
Keywords: Influenza A; Evolutionary Drift; Codon Bias
ABSTRACT
The Influenza A virus remains an annual and worldwide health concern due to its fast evolutionary rate. There are two major forms of Influenza evolution: drift, caused by mutations, and shift, which results from the exchange of genetic information between two gene segments. Using six synonymous codon usage bias indexes (GC content, ENC, SCUO, Codon Volatility, RSCU, and Odds Ratio), this study revealed the evolutionary drift patterns in the Influenza A viruses of avian, human, and swine origins as well as those of their hosts. We found that the variation of GC content across the 11 genes in Influenza A uniquely determines the viral origins in avian, human, and swine hosts. As was previously noticed in the Flaviviridae virus, a codon’s RSCU value of the Influenza viruses is positively correlated to the Odds Ratio of the dinucleotides contained within that codon. Additionally, the RSCU values of avian, human, and swine viruses and their corresponding hosts are similar, which is also true of Odds Ratio. Furthermore, the GC content, ENC, SCUO, and Codon Volatility are similar across the avian, human, and swine hosts; however, the RSCU and Odds Ratio of the hosts are distinct. Our findings expanded the knowledge on codon bias of Influenza viruses and their hosts.
1. INTRODUCTION
Due to its frequent evolution, the Influenza A Virus continues to be a worldwide health concern. There are two primary ways in which the Influenza A Virus evolves: drift and shift. Evolutionary shift occurs when two Influenza viruses exchange genetic information, and the resulting viruses usually represent a very large and rapid evolutionary change. This rapid change will sometimes generate a cross-species shift, as occurred in the 2009 H1N1 pandemic [1,2]. Conversely, evolutionary drift tends to occur slowly as mutations accumulate over time. These gradual changes are caused by the high error rate in the Influenza’s RNA replication.
Evolutionary drift in Influenza is commonly evaluated through the study of codon usage. A codon is a combination of three out of the four possible nucleic bases in gene sequences: Adenine - ‘A’, Cytosine - ‘C’, Guanine - ‘G’, and Thymine - ‘T’. There are 64 possible, 43, trinucleotide codons, each of which encodes one of the 21 amino acids. As such (since 64 codons encode only 21 amino acids), there is degeneracy in the genetic code that results in synonymous codons, or codons that encode the same amino acid, which are not commonly used with equal frequency. Since synonymous codons are not utilized with equal frequency, their usage bias is often applied to detect whether mutations have occurred. Studying the usage bias of codons helps to reveal evolutionary history about individual genes or genomes, which can be used to design DNA primers and detect horizontal transfer events [3].
Many different methods of codon usage bias detection have been developed [3-15]. We focus on 6 frequently used bias detectors: GC content, ENC, RSCU, SCUO, Codon Volatility, and Odds Ratio. Among these, GC content, ENC, and RSCU are the simplest to compute and have been widely used in previous works [3-8]. ENC measures the deviation of the codon usage in a gene from equal usage of synonymous codons, and RSCU measures the observed frequency of a particular codon relative to the expected frequency assuming all synonymous codons were selected equally. Also the GC content is correlated with amino acid usage and codon usage. In 2002, Zeeberg [5] developed a bias indicator that utilized Shannon Informational Theory within its calculations. Leading up to this new indicator, results were only applicable within a genome, but the Zeeberg technique, based on information theory, allowed codon bias to be compared across genomes. J. Zhou et al. [6,7] further improved Zeeberg’s method and created the Synonymous Codon Usage Order (SCUO). SCUO was an improvement over Zeeberg’s approach in that it applied maximum entropy to normalize the results. The same year they continued their studies with SCUO and created a quantitative relationship between SCUO and the GC content [8]. In 2003—2004, Joshua B. Plotkin et al. [9,10] developed another information theory based bias detector. This new detector utilized codon volatility, where the volatility of a codon is the probability that a random point mutation will result in a nonsynonymous codon (a codon that does not encode the same amino acid). Later, Jianzhi Zhang [11] showed that codon volatility can be increased slightly by strong frequency-dependent selection, as well as other unrelated factors; whereas the volatility is not effected by directional positive selection. Zhang concluded that codon volatility could only have limited use for detecting positive selection. Another bias detector that is often utilized is the dinucleotide odds ratio [12-15], in which dinucleotides, a pair of nucleotide bases, are evaluated instead of codons. Benjamin D. Greenbaum et al. [14] found that viruses tend to mimic the hosts in that the same dinucleotides are pervasively overor under-represented in Influenza. Francisco P. Lobo [15] furthered this methodology within the Flaviviridae family of viruses and their hosts to show similar findings.
In this study we analyzed the codon usage bias of Influenza A viruses of avian, human, and swine origins compared with that of their hosts, using the aforementioned methods. It has been previously proposed [14,15] that a connection exists between the synonymous codons used in viral genome sequences and the host that they infect in both Influenza and Flaviviridae. We intend to further this research in Influenza A by broadening the scope to include avian, human, and swine viruses and their infected hosts, as well as using additional codon bias measurements.
2. MATERIALS AND METHODS
2.1. Sequence Data
The data used in this study included gene sequences in avian, human, swine, and the 2009 H1N1 pandemic viruses, as well as the mRNA transcripts from their corresponding hosts (avian, human, and swine). All available and fully sequenced Influenza strains (n = 3007) of avian, human, or swine origin were obtained from the National Center for Biotechnology Information (NCBI) [16], which included 7 H subtypes (H1, H2, H3, H4, H5, H6, and H7) and 7 N subtypes (N1, N2, N3, N6, N7, N8, and N9). These sequences were then using MAFFT (Multiple Alignment using Fast Fourier Transform) [17], the N and H subtypes were aligned based on subtype. Only unique sequences were selected for evaluation, resulting in a total of 32566 sequences. The host mRNA transcripts were obtained from NCBI using RefSeq [18]. Table 1 lists the dispersion of all sequences in both the viral and host datasets we used in this study.
Initial sequence processing consisted of verifying open reading frames and multiple sequence alignment using MAFFT. After completion Python scripts were created to perform the codon bias calculations and analyze the results.

Table 1. Summary of Datasets.
2.2. GC Content The frequency of which a Guanine—‘G’ or a Cytosine—‘C’ nucleotide appears at the third position of the codons in a gene is the GC3 content. This measurement has been shown through previous studies to correlate very strongly with the codon usage bias of a gene [19]. The GC content provides a simple technique to verify other codon usage bias indices because of its strong correlation with the usage bias on the whole gene. The GC content is usually found as in (1), where G, C, A, and T represent the number of times that Guanine, Cytosine, Adenine and Thymine appear at a specific position in the codon. This gives the percentage of the GC content of the entire gene. The GC content can also be narrowed to just the third nucleotide position (GC3) by only counting the frequency of the bases at every third nucleotide.
 (1)
(1)
2.3. Effective Number of Codons—ENC
The effective number of codons (ENC) is another simple metric used to quantify the synonymous codon usage bias of a gene; Wright [20] first proposed it in 1990. ENC estimates the absolute synonymous codon usage bias, which will range from 20, when only one codon is used per amino acid, to 61, when all synonymous codons are used with equal frequency.
 (2)
(2)
Presented in (2) is the formula for ENC, in which F2 is the probability that two randomly chosen codons for an amino acid, possibly encoded by two distinct codons, are identical. Likewise, F3 is the probability that three randomly chosen codons for an amino acid with three synonymous codons are identical, and so forth. This yields an easy-to-understand representational value for the synonymous codon dispersion within a gene. However, ENC is still quite limiting in that it does not provide specific details on codon usage frequency.
2.4. Relative Synonymous Codon Usage—RSCU
RSCU is an approach for examining the synonymous codon usage in a gene without the influence of amino acid composition [3]. RSCU values are applied to find the relative use of every unique codon in a gene. The RSCU of the jth codon for the ith amino acid is defined as (3), where  is the frequency of the jth codon for the ith amino acid and
  is the number of alternative synonymous codons for the ith amino acid.
 (3)
(3)
Since RSCU values are calculated for each codon relative to all synonymous codons, it provides a more detailed analysis than the previous methods, which only calculate one result for an entire sequence.
2.5. Synonymous Codon Usage Order—SCUO
Synonymous codon usage order is based on information theory and was developed to analyze patterns in DNA sequences [6,7]. To implement SCUO, a codon table, which contains all amino acids that have more than one codon, is created. This allows the referencing of the jth synonymous codon for the ith amino acid, where  and
and  and where
  represents the number of synonymous codons for the ith amino acid. In each of these instances,
  will represent the occurrence of the jth synonymous codon for amino acid i. The following sequence of equations describes the SCUO calculation.
First, the frequency of the ith degenerate codon of amino acid i is found by normalizing  as follows.
 (4)
(4)
According to Shannon’s information theory [6], the entropy of the ith amino acid is calculated next, (5), where  represents the number of synonymous codons for the jth amino acid. The maximum entropy will occur when every codon is used with equal frequency.
 (5)
(5)
Next, the normalized difference between the maximum entropy and the observed entropy for the jth amino acid in each sequence is calculated. This value,  (6), will be the SCUO for the jth amino acid in each sequence.
 (6)
(6)
The composition ratio of the jth amino acid in each sequence is calculated as Fi, (7), where the sum is taken from 1 to 18 to account for the amino acids that are encoded by more than one codon.
 (7)
(7)
Finally, the average SCUO for each sequence is represented as in (8).
 (8)
(8)
2.6. Codon Volatility
In 2003 J. Plotkin and J. Dushoff [9] compared the codon usage in the HA, NA, and NP genes of the Influenza A viral subtype H3N2 from the year 1968 to the year 2000. Their studies revealed that while comparing the codon bias of these genes errors could easily accrue. This, they determined, was due to the fact that one of the genes could contain many more codons encoding volatile amino acids than the other genes.
To account for the impact of amino acid composition on codon usage calculation they incorporated the volatility of codons, defined below, into the measurement of the codon usage. Their approach is based on the presupposition that each codon has nine possible single-nucleotide mutational neighbors, where each of the threenucleotide bases can individually mutate into one of the three other bases. Some of these single-nucleotide mutational neighbors will be synonymous mutations and the rest will be non-synonymous. This method is better suited for the study of codon bias compared to other metrics because, in the context of influenza mutations, the interest is in codon usage biased toward increasing or decreasing the amino acid substitution rate [9]. Focusing on the volatility of a codon, or how easily a codon change would produce a new amino acid, allows for better comparison between species.
The volatility of a codon measures the degree to which a random single-nucleotide mutation will change the corresponding amino acid and is calculated as (9), where d(x,y) is the Hamming distance between codons x and y.
 (9)
(9)
The Hamming distance is defined as d(acid(ci)),acid(c)) = 0 if acid(ci) encodes the same amino acid as acid(c) otherwise, if it encodes a different amino acid, it is defined as 1 and a substitution occurs.
The volatility of a codon (with a Hamming distance metric), VH(c), quantifies the degree to which a random nucleotide mutation will cause an amino acid substitution. Assuming that all nucleotides will have an equal rate of mutation and are equally exchangeable, the volatility of a codon is the ratio of point-mutational neighbors to total possible single point mutations. For example, TTG in the amino acid Leu will have a volatility of 6/8, since 6 of its 8 non-stop codon neighbors are non-synonymous [11].
2.7. Dinucleotide Odds Ratio
The Odds Ratio calculation is commonly used to evaluate dinucleotides, pairs of nucleotides, in gene sequences. Odds Ratio is a likelihood of observing a dinucleotide in a sequence and is calculated as in (10).
 (10)
(10)
In (10) x and y represent the nucleotides that form dinucleotide xy; and fx, fy, fxy denote the frequencies of nucleotide x, nucleotide y, and dinucleotide xy respectively. Karlin et al. [21] showed that dinucleotides with an odds ratio that is outside of the range [0.78,1.25] could be considered as being more underor over-represented than normal.
3. RESULTS
3.1. Overview
All of the above-mentioned measurements (GC content, ENC, SCUO, Codon Volatility, RSCU, and Odds Ratio) were calculated on the four viral (avian, human, 2009 H1N1, and swine) and three host (avian, human, and swine) data sequences. The GC content, ENC, SCUO, and Codon Volatilities of the avian, human, and swine host mRNA transcripts were not reported in this study because the results were similar across the hosts. The only measurements that provided distinct results across the avian, human, and swine hosts were RSCU and Odds Ratio (sections 3.5, 3.6).
3.2. GC Content
We summarized our comparison of the GC content in avian, human, swine, and 2009 H1N1 viruses in Figure 1 and Table 2. Figure 1 illustrates the GC, GC1, GC2,

Table 2. Influenza GC Content Summaries.

Figure 1. GC Content across Influenza Genomes. The mean GC content for every gene in the avian, human, swine, and 2009 H1N1 sequences. The x-axis represents the GC content at each of the 11 genes as well as the GC content over the entire genome. The blue trend lines represent the complete GC content; whereas the green, red, and yellow trend lines represent the GC content at the first, second, and third codon positions respectively.
and GC3 content, represented by blue, green, red, and yellow respectively, at each gene of different origin. From the chart it is clear that the 4 measurements of GC content are similar across the avian, human, and swine hosts, represented by the blue trends, and as presumed, the GC3 content (yellow) displays the most diversity between the genomes. The NA gene has one of the most diverse GC contents across all four influenza hosts; this was anticipated as NA, as well as HA, is a surface protein of the virus and undergoes the most selection pressure. Surprisingly, however, the HA gene does not show the same bias, although the PB1-F2 gene does. Table 2 was constructed from the results in Figure 1. The mean and variation were calculated for the GC content of these genes of different host origins. The overall GC content of a codon (The top four rows in Table 3) has the lowest deviation of the 4 GC contents (GC, GC1, GC2, and GC3).
Nevertheless, a distinct pattern of GC content in the three primary viral species (avian, human, and swine) was discovered. For each of these the variation, across the 11 genes in Influenza, of the single-nucleotide GC content uniquely identifies its host. Avian viruses deviated in the range of 3.57 to 3.93 over the genes, with an error rate of 0.19; human viruses deviated in the range of 3.95 to 4.22, with an error rate of 0.12; and swine viruses deviated in the range of 4.51 to 6.57, with an error rate of 1.03. The standard deviation of the swine group is an order of magnitude greater than the avian or human groupings, which we have attributed to the composition of the swine sequences. In the case of swine, it appears that the third nucleotide in a codon generally has a much higher GC content compared to that of the other two positions, which results in a comparatively larger standard deviation.

Table 3. Highest and Lowest Common Dinucleotides.
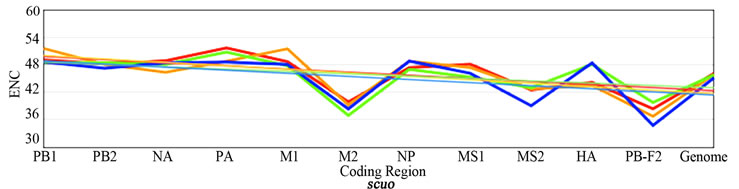
3.3. ENC, SCUO, and Codon Volatility
Figure 2 shows the plotted ENC, SCUO, and volatility values for each gene as well as the trend lines for each host. Since ENC is an inverse probabilistic measurement of two randomly selected synonymous codons being identical, the lower the value the higher the bias; whereas in SCUO and volatility, the higher the value the more biased the virus. Observe in Figure 2 that only the ENC values for the M2 and the PB1-F2 genes are consistently highly biased (notice their extreme variance above the trend lines). The same trend is observed with SCUO in Figure 2(b). However, Figure 2(c) shows that only PB1-F2 is strongly biased based on codon volatility, compared to the trend line of the whole genome.
3.4. Association of ENC and GC Content
GC content has previously been shown to correlate strongly with the effective number of codons (ENC) [3]. Figure 3 depicts the relationship between GC3 content and ENC across the avian, human, swine, and 2009 H1N1 viruses. As seen in Figure 3, the avian viruses follow a distinctly linear trend line, whereas a virus from either human or swine origin follow a trend line that is non-linear. Also, the 2009 H1N1 viruses follow a trend line that is most similar to the human viruses. Since the 2009 H1N1 pandemic is considered to be a reassortment from avian, human, and swine viruses [22], this shows that the ENC and GC3 content in Influenza A depends more heavily on the infected host than on the virus’ recent genetic history.
3.5. Dinucleotide Odds Ratio
The Odds Ratio of the 16 possible dinucleotides revealed that at least 50% (depending on the dataset) were outside of normal range ([0.78,1.25]) [21] and can be classified as underor over-represented. The extremities of these underand over-represented dinucleotides are reported in Table 3, through which several distinct patterns that can be observed. Across the four viruses and three hosts, the CG and TA doublets have the lowest Odds Ratio. Also, CG, which has the lowest Odds Ratio in the human, 2009 H1N1 viruses, and all hosts, has been widely shown to be severely under-represented in vertebrate genomes as well as in viruses infecting vertebrate hosts [14,15]. It is interesting to note that while the most under-represented dinucleotide in all hosts is CG (by large range), it is only
 (a)
(a) (b)
(b)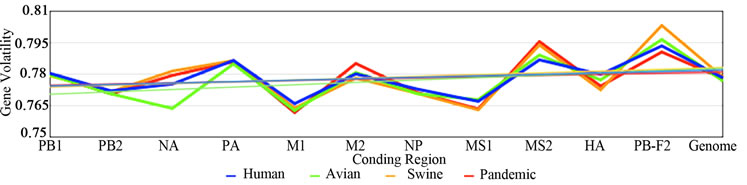 (c)
(c)
Figure 2. ENC, SCUO, and Volatility values of the four viruses and their trend lines.
3a (ENC) represents bias based on lowest values due to ENCs inverse probabilistic nature; M2 and PB1-F2 exhibit the greatest bias respective to all viruses. Whereas SCUO and Volatility (3b-c) identify a biased gene based on higher values; therefore, 3b (SCUO) shows that M2 and PB1-F2 are highly biased compared to all four viruses but 3c (Volatility) only displays bias for the PB1-F2 gene compared to the trend lines.

Figure 3. ENC vs GC3 Content of the four viruses.
ENC values plotted against the GC3 content values from the four viral types. Trend lines were superimposed on the graph for each of the four viruses to exhibit correlations between the separate viral species. The avian viruses clearly show a linear trend, whereas the other three viruses, human, 2009 H1N1 pandemic, and swine, show a distinctly non-linear trend. Also, a close relationship can be seen between the human and 2009 H1N1 pandemic trend lines, inferring that the viral-host relationship in GC3 and ENC play a more important role than a genes recent genetic history.
the most under-represented in the viruses infecting humans, whereas both the avian and swine viruses are more TA under-represented (swine by a large extent). In all cases the most severely over-represented dinucleotide is TG.
The CG suppression in vertebrate genomes is attributed to the methylation that occurs in vertebrate hosts, in which the cytosine nucleotide is often methylated into thymine [15]. This process often results in a mutation of the dinucleotide CG into TG and it is suggested that vertebrates have a tendency to use the duplets TG and CA with higher frequency than CG and TA to avoid the mutations that can occur during the methylation process. Both of these scenarios would also explain the high occurrences of TG and CA across every virus and host sequence.
3.6. RSCU and Odds Ratio
Table 4 is an ordered list of the mean RSCU values for each of our four viral and 3 host sets. The codons for each set of sequences are ordered by the mean RSCU value from highest to lowest. Select codon and value pairs are highlighted based on dinucleotide content. The codons that are highlighted in red contain the least found dinucleotides, and the highlighted green codons contain the second least common dinucleotide, as represented in Table 3. Likewise, most frequent dinucleotides from Table 3 were highlighted in orange, and the second most frequent in purple.
As seen in Table 4, codons that are highlighted as containing the most frequent dinucleotides tend to correspond with higher RSCU values. Contrastingly, the least common dinucleotides are most generally contained in the codons that have the lowest overall RSCU values (the lower portion of Table 4). This reveals a very strong correlation between the dinucleotide content in a gene and the RSCU values of codons within that same gene. Further research on this correlation is warranted.
4. CONCLUSIONS
Our analysis revealed several new and noteworthy findings relating to codon bias in Influenza A and their hosts. We found that the GC content in the genes of Influenza A viruses varies in a predictable manner dependent on the species of the infected host. In particular, the standard deviation of the three single-position GC contents across the 11 genes of avian, human, or swine viruses will uniquely identify its host. Also, as with the Flaviviridae virus [15], there is a strong correlation between a codon’s RSCU value of Influenza viruses and the Odds Ratio of the dinucleotides contained within that codon. Relatedly, the avian, human, 2009 H1N1, and swine viruses exhibit a similar trend to that of their hosts in both the RSCU and Odds Ratio measurements. Specifically,


Table 4. Ordered list (high to low) of the 59 non-trivial codons in Influenza and hosts sorted by RSCU values
the Odds Ratio values in all seven datasets (avian, human, pandemic, and swine viruses as well as the avian, human, and swine hosts) show both CG and TA as being severely under-represented whereas TG is most overrepresented. This phenomenon was previously known within the avian and human viruses [14] but has not previously been seen within the swine virus. Interestingly, the swine and avian viruses both follow a distinctly different pattern than that of human viruses; the avian and swine viruses are most severely TA under-represented whereas the five other sets are CG under-represented. Finally, out of the six considered codon bias measurements, only the Odds Ratio and RSCU values of the avian, human, and swine host mRNA transcripts are distinct. However, the GC content, ENC, SCUO, and Codon Volatilities of these hosts are in close ranges.
In summary, we verified the positive correlation between the Odds-Ratio and RSCU measurements in a much larger dataset, including new species, than in previous research. Surprisingly, a new pattern was found in the deviation of GC content across hosts. Furthermore, a positive correlation was identified between the Odds-Ratio and RSCU measurements of the viruses a correlation that were previously observed only in Flaviviridae viruses.
5. ACKNOWLEDGEMENTS
We thank Houghton College for its financial support as well as Francisco Lobo for helpful discussion on the subject matter.
REFERENCES
- Smith, G., et al. (2009) Origins and evolutionary genomics of the 2009 swine-origin H1N1 influena A epidemic. Nature, 459, 1122-1125. doi:10.1038/nature08182
- Dawood, F., et al. (2009) Emergence of a novel swine-origin influenza A (H1N1) virus in humans. New England Journal of Medicine, 360, 2605-2615. doi:10.1056/NEJMoa0903810
- Zhou, T., Gu, W., Ma, J., Sun, X. and Lu, Z. (2005) Analysis of synonymous codon usage in H5N1 virus and other influenza A viruses. BioSystems, 81, 77-86. doi:10.1016/j.biosystems.2005.03.002
- Suzuki, H., Brown, C. J., Forney, L. J. and Top, E. M. (2008) Comparison of correspondence analysis methods for synonymous codon usage in Bacteria. DNA Research, 15, 357-365. doi:10.1093/dnares/dsn028
- Zeeberg, B. (2002) Shannon information theoretic computation of synonymous codon usage biases in coding regions of human and mouse genomes. Genome Research, 12, 944-955. doi:10.1101/gr.213402
- Wan, X., Xu, D. and Zhou, J. (2003) A new informatics method for measuring synonymous codon usage bias. Intelligent Engineering Systems Through Artificial Neural Networks , 13, 1101-1108.
- Wan, X., Xu, D. and Zhou, J. (2006) Codono: A new informatics method for measuring synonymous codon usage bias within and across genomes. International Journal of General Systems, 35, 109-125. doi:10.1080/03081070500502967
- Wan, X.F., Xu, D., Kleinhofs, A. and Zhou, J. (2004) Quantitative relationship between synonymous codon usage bias and GC composition across unicellular genomes. BMC Evolutionary Biology, 4, 19. doi:10.1186/1471-2148-4-19
- Plotkin, J. B. and Dushoff, J. (2003) Codon bias and frequency-dependent selection on the hemagglutinin epitopes of influenza A virus. Proceedings of the National Academy of Sciences of the United States of America, 100, 7152-7157. doi:10.1073/pnas.1132114100
- Plotkin, J. B., Dushoff, J. and Fraser, H. B. (2004) Detecting selection using a single genome sequence of M. tuberculosis and P. falciparum. Nature, 428, 942-945. doi:10.1038/nature02458
- Zhang, J. (2004) On the evolution of codon volatility. Genetics, 169, 495-501. doi:10.1534/genetics.104.034884
- Burge, C., Campbell, A. M. and Karlin, S. (1992) Overand under-representation of short oligonucleotides in DNA sequences. Proceedings of the National Academy of Sciences, 89, 1358-1362. doi:10.1073/pnas.89.4.1358
- Arndt, P. F., Burge, C. B. and HWA, T. (2003) DNA Sequence evolution with neighbor-dependent mutation. Journal of Computational Biology, 10, 313-322. doi:10.1089/10665270360688039
- Greenbaum, B. D., Levine, A. J., Bhanot, G. and Rabadan, R. (2008) Patterns of evolution and host gene mimicry in influenza and other RNA viruses. Plos Pathogens, 4, 1-9. doi:10.1371/journal.ppat.1000079
- Lobo, F. P., Mota, B. E., Pena, S. D., Azevedo, V., Macedo, A. M., Tauch, A., et al. (2009) Virus-host coevolution: Common patterns of nucleotide motif usage in flaviviridae and their hosts. Plos One, 4. doi:10.1371/journal.pone.0006282
- Bao, Y., Bolotov, P., Dernovoy, D., Kiryutin, B., Zaslavsky, L., et al. (2008) The influenza virus resource at the national center for biotechnology information. Journal of Virology, 82, 596-601. doi:10.1128/JVI.02005-07
- Katoh, K., Misawa, K., Kuma, K.-I. and Miyata, T. (2002) MAFFT: A novel method for rapid multiple sequence alignment based on fast Fourier transform. Nucleic Acids Research , 30, 3059-3066. doi:10.1093/nar/gkf436
- Pruitt, K. D., Tatusova, T. and Maglott, D. R. (2005) NCBI reference sequence (RefSeq): A curated non-redundant sequence database of genomes, transcripts and proteins. Nucleic Acids Research, 33, 501-504. doi:10.1093/nar/gki025
- Qiu, S., Bergero, R., Zeng, K. and Charlesworth, D. (2011) Patterns of codon usage bias in Silene latifolia. Molecular Biological Evolution, 28, 771-780. doi:10.1093/molbev/msq251
- Wright, F. (1990) The effective number of codons used in a gene. Genetics, 87, 23-29.
- Karlin, S., Doerfler, W. and Cardon, L. (1994) Why is CpG suppressed in the genomes of virtually all small eukaryotic viruses but not in those of large eukaryotic viruses? Journal of Virology, 68, 2889-2897.
- Solovyov, A., Greenbaum, B., Palacios, G., Ian Lipkin, W. and Rabadan, R. (2010) Host dependent evolutionary patterns and the origin of 2009 H1N1 pandemic influenza. 3th Edition, PLos Currents, 3, 147.