Paper Menu >>
Journal Menu >>
 Journal of Environmental Protection, 2011, 2, 271-279 doi:10.4236/jep.2011.23030 Published Online May 2011 (http://www.scirp.org/journal/jep) Copyright © 2011 SciRes. JEP 271 Contamination Sources of Bomuruella Reservoir at Nuwara Eliya Randika Anjalie Jayasinghe1*, Nilanthi Janaki Gammanpila Jayaweera Bandara1, Keerthi Meepe Mohotti2 1Department of Forestry and Environmental Science, Faculty of Applied Sciences, University of Sri Jayewardenepura, Nugegoda, Sri Lanka; 2Tea Research Institute, Talawakale, Sri Lanka. Email: randij83@gmail.com Received December 18th, 2010; revised February 5th, 2011; accepted March 8th, 2011. ABSTRACT Bomuruella Reservoir in Nuwara Eliya is an important water source in the area which indirectly contributes to the drinking water supply of the downstream people. Many agricultural lands obtain water from this reservoir and consume its water for washing and cleaning purposes. This research was focused on identifying the contamination sources of Bomuruella reservoir and to investigate the suitability of the reservoir as a drinking water source. According to the water quality analysis, BOD5 and CODMn values of most samp le points did not sa tisfy the specified standa rds of Cen- tral Environmental Authority, Sri Lanka. Municipal wastewater stream and the stream from the cultivated area re- corded high BOD5 levels of 7.65 mg/l and 6.55 mg/l respectively in the period of low water level of the reservoir. The stream from the cu ltivated area reported a high CODMn valu e of 595.74 mg/l during March and the stream from Kan- dapola plantation recorded a CODMn value of 74.44 mg/l during May. This concludes that the reservoir was contami- nated with significant loads of organic wastes. Furthermore, the effluent from the leachate treatment plant recorded higher conductivity, nitrate and CODMn values which indicated that the leachate treatment plant was malfunction- ing.The main cause of pollution of the reservoir is the discharge of agricultural runoff, raw sewage and wastes which include domestic, industrial and hospital waste directly into the feeder streams. It can be concluded that if the reservoir is to be used as a source of drinking water stringent measures have to be taken to control effluents. Keywords: Water Quality, Contamination Sources, Bod5, Codmn, Leachate 1. Introduction Bomuruella Reservoir is situated in the Nuwara Eliya District surrounded by the Kandapola—Seetha Eliya Forest Reserve and serves as an important water source in the area. The reservoir constructed and operated by the Department of Irrigation (ID) is used to augment the irrigation supplies of the Uma Oya canal irrigation scheme, a major irrigation scheme in the upper Uma Oya basin. The reservoir is situated in a valley surrounded by hilly areas which consist of Eucalyptus grandis planta- tion owned by the Department of Forest, a lush Sub Montane Forest and cultivated areas of tea and vegeta- bles. Due to steep valley slopes in major parts of the reservoir catchment the chances of infiltration is re- duced. The thickness of the soil cover in the area is relatively thin reducing the capacity to retain infiltra- tion. The combined effect of these would be rapid run- off in the catchment. Thus stream flows would be characterized by large flow volumes during rainy pe- riods resulting in a high water level in the reservoir, immediately followed by significantly small flows when the rains have ceased resulting in a low water level in the reservoir [1]. Although the Reservoir is not been used as a direct supplier of drinking water, it indirectly contributes to the drinking water supply of the downstream people. Many agricultural lands obtain water from this reser- voir and consume its water for washing and cleaning purposes. Bomuruella Reservoir serves as a popular fishing location among the locals and contributes to the aesthetic value of the area. *This study was funded by UNDP/GEF Small Grants Facility program, SEVANATHA and Research & Development Section of National Water Supply and Drainage Board. However, the reservoir is subjected to many con- tamination sources mainly due to anthropogenic activi-  Contamination Sources of Bomuruella Reservoir at Nuwara Eliya 272 ties. This includes leachate from the Moon Plains land- fill, runoffs from cultivated lands which may contain high amounts of fertilizer and pesticides and industrial, hospital and household wastewater streams. Hence, the research was carried out to study and identify the con- tamination sources of the Bomuruella reservoir. The results were used to evaluate the suitability of water for consumption and to suggest mitigatory measures to improve the quality of the water. 2. Methodology Preliminary field investigations were carried out in Au- gust and September 2008 to identify the possible loca- tions for sample collection and to gain a thorough under- standing about the reservoir environment. Sampling was carried out each month for a period of seven months from November 2008 to May 2009. Sampling was done during both wet and dry periods of the year. Samples from February 2009 to April 2009 were collected to represent the dry period during which there was a low water level in the reservoir, whereas samples in November, December, January and May were collected to represent the wet period when the water lev- el was high. 2.1. Sampling Locations Water samples from the following locations were col- lected during the study period (Table 1). Sampling loca- tions of the reservoir were reached by a boat (except for the reservoir outlet) due to the difficulty in reaching the locations through the forest and due to time constraint. Water samples were taken from the side of the boat using direct sampling method where the sample containers were directly dipped in to the water. Sampling was done with care, under the water surface avoiding surface de- bris and the boat wake. 2.2. Sample Analysis DO, BOD5, CODMn and all the chemical and biological parameters were analysed at the National Water Supply and Drainage Board Laboratory at Thelawala, Ratmalana. pH and biological analysis were carried out on the same day of sample collection. Parameters such as heavy metals and iron (Fe) were measured at the laboratory of the Department of Forestry and Environ- mental Science, University of Sri Jayewardenepura, Nu- gegoda. The water quality analyses were carried out in accor- dance with the Standard Methods for the Examination of Water and Wastewater [2] (Table 2). Values of the pa- rameters were compared with the Central Environmental Authority proposed Ambient Water Quality Standards for inland waters of Sri Lanka [3]. 2.3. Statistical Analysis MINITAB 14 statistical software was used for the statis- tical analysis of the results. Average values of the dif- ferent water quality parameters during high water level and low water level of the reservoir were analysed to determine whether there is a significant difference of the parameters between the two periods by using 1-Sample Wilcoxon test. This is a non-parametric analysis. Furthermore the average values of each parameter during wet and dry periods and Central Environmental Authority proposed ambient water quality standards for inland waters of Sri Lanka were compared using the same test to determine whether there is a significant dif- ference between the observed value of a given parameter and the corresponding standard level. 3. Results The water level of the reservoir was high in November, December, January and May. October, November and December months recorded high rainfall during the study period. Although January did not receive a considerable amount of rainfall, the reservoir water level was high in January due to the previous months’ high rainfall. Aver- age results (averaged over the months) obtained from the water analysis for the high water levels in the reservoir are summarized below in Tables 3 and 4. The water level of the reservoir was low in the months of February, March and April. February and April re- ceived very low amounts of rainfall according to the rainfall data. Although during March there was a consid- erable. Table 1. Sampling locations. Sampling locations Identification code Sampling locations of the reservoir Reservoir Left bank R1 Municipal and Hospital waste waterfall R2 Small stream from the cultivated areas R3 Housing area R4 Stream through the Kandapola Plantation R5 Middle of the Reservoir R6 Reservoir Right bank R7 Reservoir Outlet R8 Leachate treatment facility Leachate after treatment (outlet) L2 Other sampling locations Vegetable washing area V Ambagasduwa Raw water intake Am Copyright © 2011 SciRes. JEP 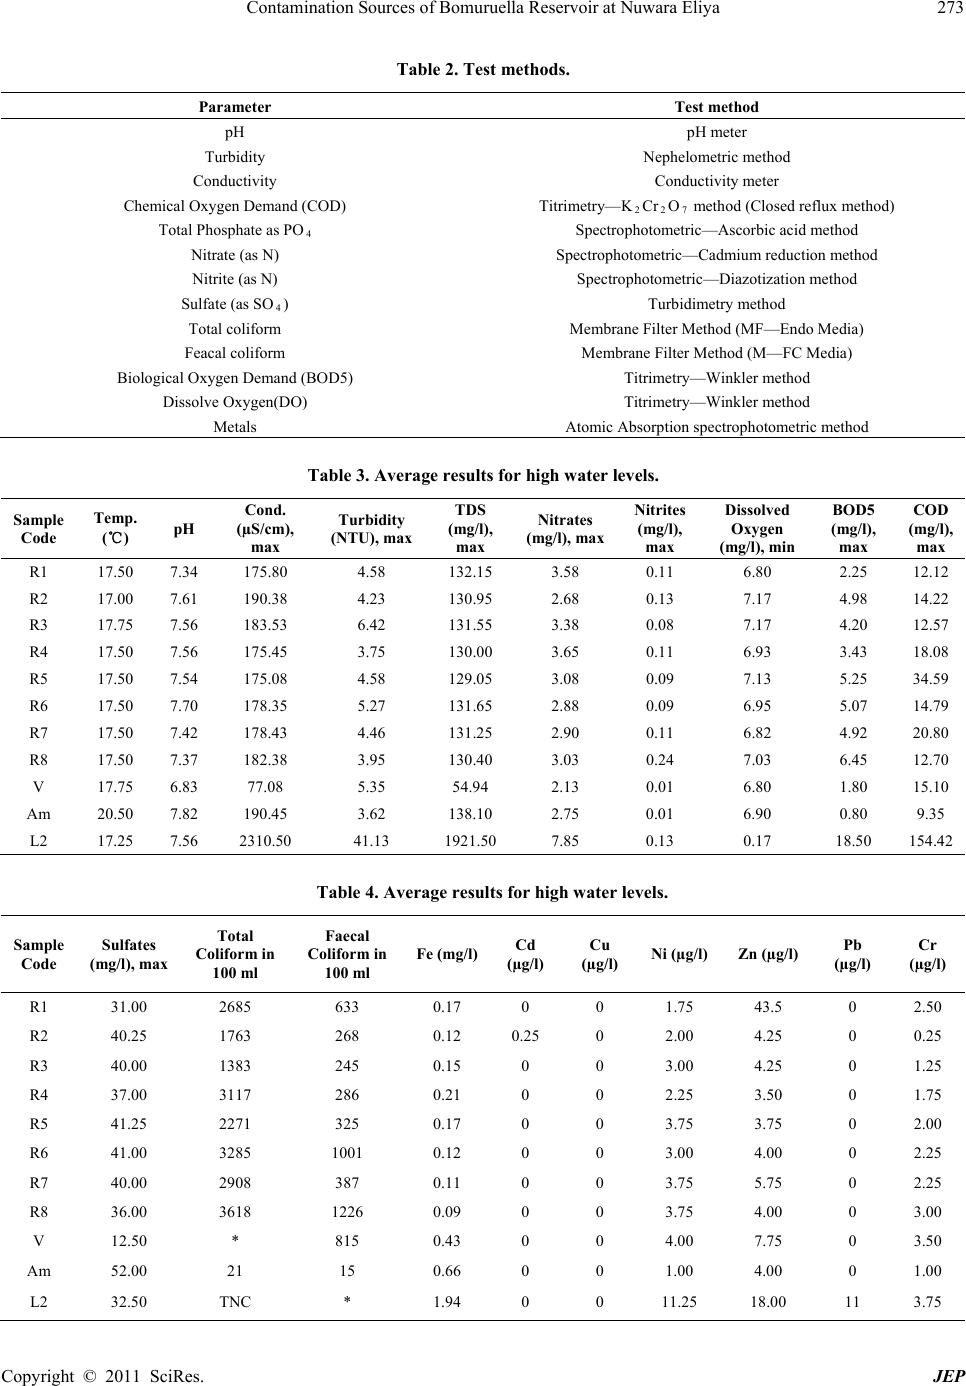 Contamination Sources of Bomuruella Reservoir at Nuwara Eliya Copyright © 2011 SciRes. JEP 273 Table 2. Test methods. Parameter Test method pH pH meter Turbidity Nephelometric method Conductivity Conductivity meter Chemical Oxygen Demand (COD) Titrimetry—K2Cr2O7 method (Closed reflux method) Total Phosphate as PO4 Spectrophotometric—Ascorbic acid method Nitrate (as N) Spectrophotometric—Cadmium reduction method Nitrite (as N) Spectrophotometric—Diazotization method Sulfate (as SO4) Turbidimetry method Total coliform Membrane Filter Method (MF—Endo Media) Feacal coliform Membrane Filter Method (M—FC Media) Biological Oxygen Demand (BOD5) Titrimetry—Winkler method Dissolve Oxygen(DO) Titrimetry—Winkler method Metals Atomic Absorption spectrophotometric method Table 3. Average results for high water levels. Sample Code Temp. (℃) pH Cond. (µS/cm), max Turbidity (NTU), max TDS (mg/l), max Nitrates (mg/l), max Nitrites (mg/l), max Dissolved Oxygen (mg/l), min BOD5 (mg/l), max COD (mg/l), max R1 17.50 7.34 175.80 4.58 132.15 3.58 0.11 6.80 2.25 12.12 R2 17.00 7.61 190.38 4.23 130.95 2.68 0.13 7.17 4.98 14.22 R3 17.75 7.56 183.53 6.42 131.55 3.38 0.08 7.17 4.20 12.57 R4 17.50 7.56 175.45 3.75 130.00 3.65 0.11 6.93 3.43 18.08 R5 17.50 7.54 175.08 4.58 129.05 3.08 0.09 7.13 5.25 34.59 R6 17.50 7.70 178.35 5.27 131.65 2.88 0.09 6.95 5.07 14.79 R7 17.50 7.42 178.43 4.46 131.25 2.90 0.11 6.82 4.92 20.80 R8 17.50 7.37 182.38 3.95 130.40 3.03 0.24 7.03 6.45 12.70 V 17.75 6.83 77.08 5.35 54.94 2.13 0.01 6.80 1.80 15.10 Am 20.50 7.82 190.45 3.62 138.10 2.75 0.01 6.90 0.80 9.35 L2 17.25 7.56 2310.50 41.13 1921.50 7.85 0.13 0.17 18.50 154.42 Table 4. Average results for high water levels. Sample Code Sulfates (mg/l), max Total Coliform in 100 ml Faecal Coliform in 100 ml Fe (mg/l)Cd (µg/l) Cu (µg/l) Ni (µg/l)Zn (µg/l) Pb (µg/l) Cr (µg/l) R1 31.00 2685 633 0.17 0 0 1.75 43.5 0 2.50 R2 40.25 1763 268 0.12 0.25 0 2.00 4.25 0 0.25 R3 40.00 1383 245 0.15 0 0 3.00 4.25 0 1.25 R4 37.00 3117 286 0.21 0 0 2.25 3.50 0 1.75 R5 41.25 2271 325 0.17 0 0 3.75 3.75 0 2.00 R6 41.00 3285 1001 0.12 0 0 3.00 4.00 0 2.25 R7 40.00 2908 387 0.11 0 0 3.75 5.75 0 2.25 R8 36.00 3618 1226 0.09 0 0 3.75 4.00 0 3.00 V 12.50 * 815 0.43 0 0 4.00 7.75 0 3.50 Am 52.00 21 15 0.66 0 0 1.00 4.00 0 1.00 L2 32.50 TNC * 1.94 0 0 11.25 18.00 11 3.75 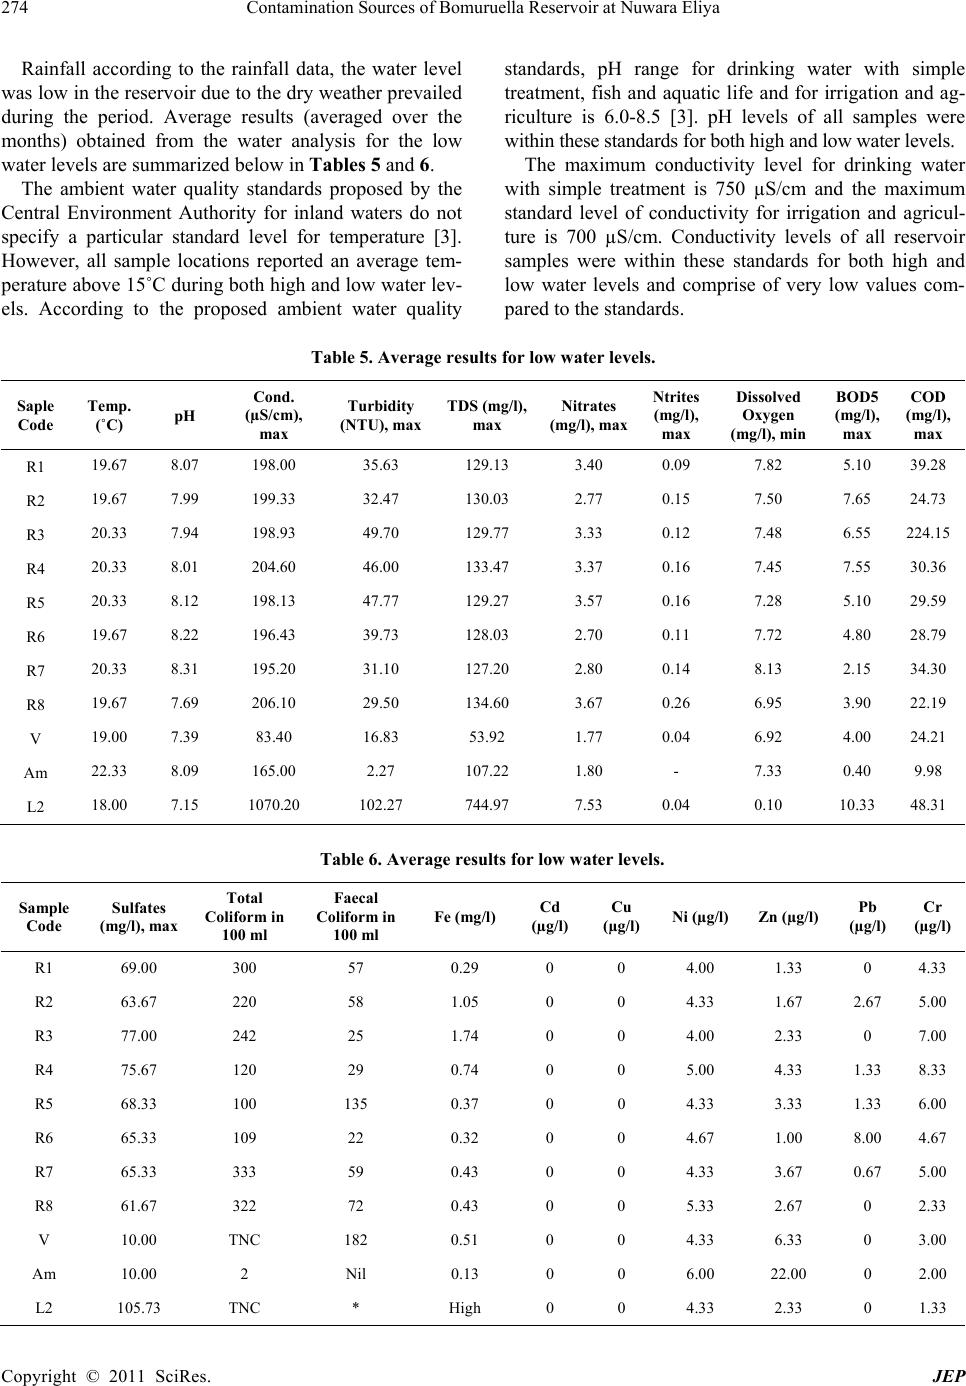 Contamination Sources of Bomuruella Reservoir at Nuwara Eliya 274 Rainfall according to the rainfall data, the water level was low in the reservoir due to the dry weather prevailed during the period. Average results (averaged over the months) obtained from the water analysis for the low water levels are summarized below in Tables 5 and 6. The ambient water quality standards proposed by the Central Environment Authority for inland waters do not specify a particular standard level for temperature [3]. However, all sample locations reported an average tem- perature above 15˚C during both high and low water lev- els. According to the proposed ambient water quality standards, pH range for drinking water with simple treatment, fish and aquatic life and for irrigation and ag- riculture is 6.0-8.5 [3]. pH levels of all samples were within these standards for both high and low water levels. The maximum conductivity level for drinking water with simple treatment is 750 µS/cm and the maximum standard level of conductivity for irrigation and agricul- ture is 700 µS/cm. Conductivity levels of all reservoir samples were within these standards for both high and low water levels and comprise of very low values com- pared to the standards. Table 5. Average results for low water levels. Saple Code Temp. (˚C) pH Cond. (µS/cm), max Turbidity (NTU), maxTDS (mg/l), max Nitrates (mg/l), max Ntrites (mg/l), max Dissolved Oxygen (mg/l), min BOD5 (mg/l), max COD (mg/l), max R1 19.67 8.07 198.00 35.63 129.13 3.40 0.09 7.82 5.10 39.28 R2 19.67 7.99 199.33 32.47 130.03 2.77 0.15 7.50 7.65 24.73 R3 20.33 7.94 198.93 49.70 129.77 3.33 0.12 7.48 6.55 224.15 R4 20.33 8.01 204.60 46.00 133.47 3.37 0.16 7.45 7.55 30.36 R5 20.33 8.12 198.13 47.77 129.27 3.57 0.16 7.28 5.10 29.59 R6 19.67 8.22 196.43 39.73 128.03 2.70 0.11 7.72 4.80 28.79 R7 20.33 8.31 195.20 31.10 127.20 2.80 0.14 8.13 2.15 34.30 R8 19.67 7.69 206.10 29.50 134.60 3.67 0.26 6.95 3.90 22.19 V 19.00 7.39 83.40 16.83 53.92 1.77 0.04 6.92 4.00 24.21 Am 22.33 8.09 165.00 2.27 107.22 1.80 - 7.33 0.40 9.98 L2 18.00 7.15 1070.20 102.27 744.97 7.53 0.04 0.10 10.33 48.31 Table 6. Average results for low water levels. Sample Code Sulfates (mg/l), max Total Coliform in 100 ml Faecal Coliform in 100 ml Fe (mg/l) Cd (µg/l) Cu (µg/l) Ni (µg/l)Zn (µg/l) Pb (µg/l) Cr (µg/l) R1 69.00 300 57 0.29 0 0 4.00 1.33 0 4.33 R2 63.67 220 58 1.05 0 0 4.33 1.67 2.67 5.00 R3 77.00 242 25 1.74 0 0 4.00 2.33 0 7.00 R4 75.67 120 29 0.74 0 0 5.00 4.33 1.33 8.33 R5 68.33 100 135 0.37 0 0 4.33 3.33 1.33 6.00 R6 65.33 109 22 0.32 0 0 4.67 1.00 8.00 4.67 R7 65.33 333 59 0.43 0 0 4.33 3.67 0.67 5.00 R8 61.67 322 72 0.43 0 0 5.33 2.67 0 2.33 V 10.00 TNC 182 0.51 0 0 4.33 6.33 0 3.00 Am 10.00 2 Nil 0.13 0 0 6.00 22.00 0 2.00 L2 105.73 TNC * High 0 0 4.33 2.33 0 1.33 Copyright © 2011 SciRes. JEP  Contamination Sources of Bomuruella Reservoir at Nuwara Eliya 275 The proposed ambient water quality standards of the Central Environment Authority, specify that the accept- able maximum turbidity level for drinking water with simple treatment is 5NTU [3]. Turbidity level was sig- nificantly higher than the standard value in all the reser- voir samples and sample taken from the vegetable wash- ing area (V) during low water level. According to the statistical analysis, turbidity value of low water level period was significantly higher than the standard level (p = 0.004 < 0.05). Moreover, the standards specify that for irrigation and agriculture, the required maximum TDS level is 500 mg/l. According to the results, TDS level in all the samples were lower than the standard level during both low and high water level periods. According to the ambient water quality standards the required maximum nitrate level for drinking water with simple treatment, fish and aquatic life and for irrigation and agriculture is 5 mg/l [3]. Nitrate level was lower than the standard values in all the samples during both high and low water level periods of the reservoir. Samples obtained from the reservoir left bank and streams flow- ing from cultivated area (R3), housing area (R4) and Kandapola plantation (R5) recorded comparatively high nitrate levels. Reservoir outlet recorded a high nitrate level during the low water level of the reservoir. No specific standard is given for nitrites in the pro- posed water quality standards for inland waters. How- ever, according to the results obtained, highest nitrite level was recorded in the sample taken from the reservoir outlet. The permitted maximum sulphate level for drinking water with simple treatment is 250 mg/l and 1000 mg/l for irrigation and agriculture. Sulphate level was lower than the standard values in all the samples during both high and low water level periods of the reservoir. According to the ambient water quality standards of the Central Environment Authority, the required mini- mum DO level for drinking water with simple treatment is 6 mg/l and a minimum of 3 mg/l is required for fish and aquatic life and for irrigation and agriculture [4]. Observed DO levels were higher than the minimum stan- dard values in all the samples during both high and low water level periods of the reservoir. The required BOD level for drinking water with sim- ple treatment is 3 mg/l. Fish and aquatic life requires 4 mg/l and irrigation and agriculture requires a maximum standard level of 5 mg/l [3]. BOD level was higher than the standard value for drinking water with simple treat- ment in all the samples except for the samples obtained from reservoir left bank (R1), vegetable washing area (V) and Ambagasduwa area (Am) during the high water level. Reservoir right bank and Ambagasduwa samples had a low BOD value than the standard level for drinking wa- ter whereas all the other samples had higher values than the standard level during the period of low water level. BOD values for low water level period was significantly higher than the maximum standard level for drinking water with simple treatment (p = 0.026 < 0.05). According to the ambient water quality standards of the Central Environment Authority, the acceptable maximum COD level for drinking water with simple treatment and for fish and aquatic life is 15 mg/l [3]. COD level was higher than the standard values for all the samples except for the sample obtained from the Amba- gasduwa area during the period of low water level. The sample obtained from the stream from the cultivated area (R3) recorded a very high COD level compared to other samples. During the high water level of the reservoir samples collected from the housing area (R4), stream from Kandapola plantation (R5), reservoir right bank (R7) and vegetable washing area (V) recorded high COD lev- els. According to the results of 1-Sample Wilcoxon test, there is a significant difference between the COD values of high and low water levels in the reservoir (p = 0.011 < 0.05). Total Coliform counts of high water level of the res- ervoir were extremely higher than the Coliform counts recorded in the low water level period. Month of De- cember recorded the highest Coliform counts of the study period. Sample obtained from the vegetable wash- ing area recorded the highest Coliform count which is 78,400 in 100 ml. Some of the water samples did not give an exact count due to the presence of other micro- organisms on the growth media. According to the results of 1-Sample Wilcoxon test, there was a significant dif- ference between the average Coliform counts of high and low water levels in the reservoir (p = 0.009 < 0.05). Faecal coliform counts of high water level of the res- ervoir were extremely higher than the faecal coliform counts recorded in the low water level period. Month of December recorded the highest faecal coliform counts of the study period. Sample obtained from the reservoir outlet recorded the highest average faecal coliform count during the high water level period. In addition, vegetable washing area (V) recorded higher faecal coliform counts. Water samples obtained from Amabagasduwa (Am) re- corded the lowest faecal coliform counts. According to the ambient water quality standards of the Central Environment Authority, the desirable highest Iron concentration for drinking water with simple treat- ment is 3 mg/l and the maximum permissible level is 10 mg/l. A maximum of 3 mg/l is required for fish and aquatic life [3]. Iron level was lower than the maximum standard values in all the samples during both high and low water level periods of the reservoir. According to the Copyright © 2011 SciRes. JEP  Contamination Sources of Bomuruella Reservoir at Nuwara Eliya 276 results of 1-Sample Wilcoxon test, there was a signifi- cant difference between the Iron values of high and low water levels in the reservoir (p = 0.047 < 0.05). Lead was detected only in the month of April 2009 in the samples obtained from the housing area and the Kan- dapola plantation stream. Samples obtained from the middle of the reservoir and reservoir right side bank also recorded lead during the same month. Apart from this, Lead was not recorded in any of the sample locations during the study period. The acceptable maximum chromium concentration for drinking water with simple treatment is 50 µg/l. A max- imum of 2 µg/l is acceptable for fish and aquatic life. Chromium level was lower than the maximum standard value for drinking water with simple treatment in all the samples during the two months. However, most of the samples recorded a higher chromium level than the re- quired standard for fish and aquatic life in these two months. Remedial actions to clean up polluted sites and water bodies are generally much more expensive than applying measures to prevent pollution from occurring. Thus, ap- proaches to water pollution controls that focus on wastewater minimisation, recycling of waste products, etc., should be given priority over traditional treatments. Industrial establishments should establish proper treat- ment plants to treat their wastewater. Municipal council and the Central Environmental Authority should monitor the discharge of wastewater from such establishments regularly. An increasing proportion of water pollution originates from diffuse sources, such as agricultural use of fertiliz- ers. The principle of “best environmental practice” should be applied to minimise non-point source pollution. Good agricultural practices that address the causes of water pollution from agriculture such as type, amount and time of application of fertilisers, manure and pesti- cides can give guidance to farmers on how to prevent or reduce pollution of the reservoir which occurs due to excessive use of agrochemicals. Wetlands are commonly recognized as serving a vital role not only for fish and wildlife, but also for pollution filtration and flood control. When runoff water carrying nutrients and sediment circulates through a wetland, the sediment settles and the plants take up and use the nutri- ents before they can run into the reservoir. Hence, it is highly important to protect the wetland area surrounding the Bomuruella reservoir. Moon Plains landfill which is located in the upstream of the reservoir cannot be considered as a sanitary land- fill due to poor management. Waste is haphazardly dumped all over the landfill. A soil cover is not used on top of the wastes which lead to emission of large amounts of leachate. It could be observed that run off through the waste materials were flowing from the sides of the landfill without entering the treatment pond. In addition the treatment pond is not cleaned or maintained properly which has led to the malfunctioning of the treatment plant. Hence, it is recommended that the au- thorities should take necessary actions to manage the landfill in a proper manner and to upgrade the treatment plant. People living in the vicinity of the reservoir should be made aware of the importance of the reservoir. It is im- portant to utilise a participatory approach which involves raising awareness of the importance of water pollution control among policy makers and the surrounding com- munity. Decisions should be taken with the involvement of all the groups affected by the water pollution of the reservoir. This includes CEA, local authorities, NGO’s, National Water Supply and Drainage Board, people in the vicinity and the consumers of water from the Uma Oya water supply scheme. Further studies should be carried out to determine the pesticide residuals and algal counts in reservoir water. These studies will provide a better idea on the level of pollution from agrochemicals and the level of eutrophi- cation respectively. The water of the reservoir is not suitable for drinking purposes with either simple or con- ventional treatment. Hence, it is recommended to utilize a more advance water treatment method to treat the water, if the reservoir is to be used as a drinking water source. 4. Discussion Bomuruella Reservoir is subjected to contamination from different sources in the surrounding area. This includes the landfill leachate treatment plant, vegetable washing area, Municipal wastewater stream, surface water from the cultivated areas and Kandapola plantation and the run-off water streams from the housing area. The pH of most natural waters is between 6.0 and 8.5 although lower values can occur in dilute waters high in organic content and higher values in eutrophic waters. For example, samples collected at the influx point to Barracks Plain reservoir in Nuwara Eliya had zero dis- solved oxygen with relatively high pH values [4]. How- ever, water samples analysed during this research did not report such extreme pH values. According to Akan, Abdulrahman, Dimari and Ogug- buaja, electrical conductivity of water is a useful and convenient indicator of its salinity or total salt content [5]. The conductivity of most freshwaters ranges from 10 to 1000 μS/cm, but may exceed 1000 μS/cm especially in polluted waters or those receiving large quantities of land run-off. The conductivity of all the samples were below 200 μS/cm. This is considerably low compared to the Copyright © 2011 SciRes. JEP  Contamination Sources of Bomuruella Reservoir at Nuwara Eliya 277 standard for drinking water with simple treatment and the required standard level of conductivity for irrigation and agriculture. Turbidity is of considerable interest because of the ef- fects on light transmission and water clarity [6]. Normal turbidity values range from 1 to 1000 NTU and levels can be increased by the presence of organic matter pol- lutants, other effluents or run-off with high suspended matter content. The higher levels of turbidity reported during the research can be due to water being stagnant with low rates of flushing which may have resulted in very fine particulate matter held in suspension during the low water level. Biological activities that prevail during warm water conditions may also have contributed to the high turbidity levels. The same author states that total suspended solids (TSS) are a major transport mechanism for nutrients and contaminants and deposit in reservoirs, thus displacing valuable water storage [6]. According to the results ob- tained during the study, there was no significant differ- ence between the TDS values of high and low water lev- els in the reservoir. When influenced by human activities, surface waters can have nitrate concentrations up to 5 mg/l NO3-N, but often less than 1 mg/l NO3-N. Concentrations in excess of 5 mg/l NO3-N usually indicate pollution by human or animal waste or fertiliser run-off. According to the study, average nitrate variation of water in the reservoir did not exceed the standard levels. A similar study carried out in Bomuruella by NWS&DB reported that results of ni- trates and nitrites were well below the standard limits for drinking water [7]. However, some samples collected from streams flowing from the cultivated area (R3), housing area (R4) and Kandapola plantation (R5) have recorded nitrate levels which was higher than 4 mg/l. This may be due to the agrochemical runoff from these areas. Sulphate is naturally present in surface waters as . In this study, water samples recorded a very low concentration of sulphate level compared to the standard levels. March, April and May recorded higher levels of sulphates compared to months from November to Febru- ary. High sulphate levels may be due to high concentra- tions of solid waste materials from households and par- ticulate matter present in the reservoir due to low flowing of water during these months. 2 4 SO The dissolved oxygen concentration depends on the physical, chemical and biochemical activities in the wa- ter body and provides a good indication of the quality of that water. According to a study carried out by Parana- gama in Kandy Lake, the dissolved oxygen levels varied from 2 to 7 mg/l which indicated that there is no stratifi- cation in the lake [8]. However, in this research all the samples recorded DO levels higher than 6.5 mg/l throughout the study period. This may be due to aeration and circulation that involves moving of the water body thus adding oxygen which increases dissolved oxygen levels. Turbulence of surface water layers due to the ef- fect of wind will cause the water to be saturated with oxygen resulting in high DO levels. According to Ileperuma, urban and industrial dis- charges from inadequate waste treatment and disposal facilities contribute significant quantities of oxygen de- pleting substances [9]. This was observed in samples obtained from the Municipal wastewater stream and the stream from the cultivated area which recorded high BOD5 levels of 7.65 mg/l and 6.55 mg/l respectively in the period of low water level of the reservoir. Moreover, the sample collected from the housing area recorded a high BOD5 level of 7.55 mg/l during the same period. Domestic sources, i.e. from the settlements along the reservoir contribute to the BOD5 level significantly due to poor housekeeping and improper sanitary conditions. According to a study carried out by Ileperuma, the samples obtained from Barrack’s Plain reservoir had high CODMn values indicating increased contamination from organic wastes [10,11]. Similar results were re- ported in this study. Diffuse pollution caused by drainage containing fertilisers and agrochemical residues from cultivated areas most likely have resulted in the high CODMn levels observed in the samples collected from the stream flowing through the cultivated area and stream flowing through the Kandapola plantation. Stream from the cultivated area reported a CODMn value of 595.74 mg/l during the month of March. Kandapola plantation recorded a CODMn value of 74.44 mg/l dur- ing May. As mentioned by Abel in his book, Water Pollution Biology, the coliform group of bacteria is the principal indicator of suitability of water for domestic or other uses. Total coliform bacteria occur in both sewage and natural waters. Some of these bacteria are excreted in the faeces of humans and animals, but many coliforms are heterotrophic and are able to multiply in water and soil environments [12]. Highest numbers of coliforms were recorded in the month of December. This may be due to the high rains which prevailed at the time of sampling. Domestic sources, i.e. from the settlements along the reservoir contribute to the coliform level significantly due to poor housekeeping and improper sanitary conditions which uses the reservoir as the ultimate disposal site. The high- est coliform number of 78,400 in 100 ml was recorded in the sample obtained from the vegetable washing area. This small stream flows through an area with few Copyright © 2011 SciRes. JEP  Contamination Sources of Bomuruella Reservoir at Nuwara Eliya 278 households which may be disposing their septic tank waste directly to the stream. Escherichia coli are present in very high numbers in human and animal faeces and are rarely found in the ab- sence of faecal pollution. Hence, Escherichia coli is con- sidered the most suitable index of faecal contamination. Escherichia coli occur in high numbers in human and animal faeces, sewage and water subject to recent faecal pollution [13]. Faecal pollution may occur because of poor commu- nity facilities for waste disposal, inadequate collection and treatment facilities and the on-site sanitation facili- ties (such as latrines) which drain directly into the reser- voir and streams. Highest numbers of faecal coliforms were recorded in the sample obtained from the reservoir outlet. This may be due to the outlet stream being pol- luted by animal and human faecal matter. In addition, the vegetable washing area (V) recorded a higher number of faecal coliforms which confirmed that the water is being polluted by human faecal matter. Some metals such as Mn, Zn and Cu, when present in trace concentrations are important for the physiological functions of living tissue and regulate many biochemical processes. The same metals, however, discharged into natural waters at increased concentrations in sewage, industrial effluents or from mining operations can have severe toxicological effects on humans and the aquatic ecosystem [14]. Trace metals such as cadmium, copper, chromium, nickel, lead and zinc were analysed during this study. Cadmium was detected only once and that was in the municipal wastewater stream. Lead is used as an additive in petroleum for automobiles and is emitted to the at- mosphere in their exhaust gases, thereby entering the hydrological cycle. Lead was detected in streams from the Kandapola plantation and from the housing area. Lead was found to be present in the samples drawn from the middle of the reservoir and the right side bank of the reservoir in low concentrations. The most highly detected trace element in the water samples was zinc. Zinc is an essential trace element found in virtually all water in the form of salts or organic complexes. However, zinc concentrations can be much higher as a result of dissolution of zinc from metal ap- pliances which uses zinc as a galvanizing agent. The leachate from the landfill is collected and intro- duced to a leachate treatment facility. This is a combine system which consists of a coconut fibre biological con- ductor, a charcoal filter and a wetland. The treated leachate is released to a small stream approximately 500 m below the valley which finally flows in to the reservoir [15]. Treated leachate values were compared with the Central Environmental Authority wastewater discharge standards into sensitive waters (Class II waters). Dis- solved oxygen levels of treated leachate were very low in both periods and did not exceed 0.25 mg/l. Significant concentrations of heavy metals were not detected in treated leachate. However, high concentra- tions of iron were detected in the leachate samples. Ammonia readily dissolves in water which may have resulted in high levels of ammonia producing a pungent odour near the treatment plant. Total Coliform levels of leachate samples were not countable during most of the months due to the presence of other microorganisms on the growth media. However, E-coli levels were higher than the standard levels which confirm the presence of faecal matter in the leachate. The highest E-coli amount was recorded in the treated leachate sample obtained during the month of January which was 2000 E-coli in 100 ml. High amounts of E-coli were recorded during the rest of the months which is higher than the acceptable level of 40 E-coli in 100 ml. 5. Conclusions There are many sources which contaminate the Bomuru- ella reservoir. Municipal wastewater stream carry sewage effluents, urban drainage and other collected wastewaters However, the impact from this stream is considerably mitigated as it flows for a considerable distance through the forest prior to entering the reservoir as a waterfall. Hence, this wastewater stream is subjected to a natural purification. Tea and vegetable cultivation is practiced extensively in the upstream of the reservoir and it contributes to the land run-off associated with excessive land clearance for cultivation. Other major source of pollution is the stream flowing through the Kandapola plantation which is the second largest tributary that flows to the reservoir and it carries a considerable load of agrochemical run off. Housing area contributes to the organic load of the res- ervoir due to the disposal of domestic wastes and poor sanitary conditions. Often household refuse is dumped in to the reservoir. The households which belong to the estate sector lack proper sanitation and most of the households have directed their septic tank wastewater flow to the reservoir. Vegetable washing area which is located upstream of the reservoir recorded high levels of phosphate which indicates that excess fertlisers deposited on vegetables are washed away in water. Septic tanks of some nearby houses are directed to this water flow. Hence, there is a possibility of this stream to contain pathogenic microor- ganisms and consuming of contaminated water to wash vegetables can cause health risks to consumers. Municipal solid waste of the Nuwara Eliya area is dumped in the Moon plains landfill site. Land disposal Copyright © 2011 SciRes. JEP  Contamination Sources of Bomuruella Reservoir at Nuwara Eliya Copyright © 2011 SciRes. JEP 279 site is poorly planned and controlled resulting in the formation of leachate which poses particular risks of contaminating the water sources. According to this research, contamination sources identified as polluting the reservoir has a severe impact on the water quality of the reservoir. The main cause of pollution is the discharge of agricultural runoff, raw sewage and wastes which includes domestic and indus- trial waste directly into the feeder streams. Hence, it can be concluded that the water of the reservoir is not suit- able for drinking purposes with either simple or conven- tional treatment. It can be further concluded that, if the reservoir is to be used as a source of drinking water stringent measures should be applied to control effluents. REFERENCES [1] Manikawita Hydropower Development (PVT) Ltd., “Fi- nal Report of the Proposed Bomuruella Mini Hydropower Project, Hydrological Study,” Environmental Impact As- sessment, 2004, pp. 1-22. [2] APHA, “Standard Methods for the Examination of Water and Wastewater,” 20th Edition, American Public Health Association, American Water Works Association and Water Environment Federation, Washington D C, 1998. [3] Central Environmental Authority, “Proposed Ambient Water Quality Standards for Inland Waters of Sri Lanka,” Environment Action 1 Project (funded by ADB), Co- lombo, 2001. [4] JICA, “The Study on Greater Kandy and Nuwara Eliya Water Supply and Environmental Improvement Plan in the Democratic Socialist Republic of Sri Lanka,” Vol. 5, Nippon Jogesuido Sekkei CO., LTD., Hyderabad, 1999 [5] J. C. Akan, F. I. Abdulrahman, G. A. Dimari, V. O. Ogugbuaja, “Physicochemical Determination of Pollut- ants in Wastewater and Vegetable Samples along the Ja- kara Wastewater Channel in Kano Metropolis, Kano State,” European Journal of Scientific Research, Vol. 23, No. 1, 2008, pp. 122-133. [6] Dortch, M. S., “Water Quality Considerations in Reser- voir Management,” US Army Engineer Waterways Ex- periment Station, Vicksburg, 1998, pp. 32-38. [7] National Water Supply and Drainage Board, “Water Quality Reports, Bomuruella,” Central Laboratory, The- lawala, Ratmalana, 1997. [8] P. N. Paranagama, “Zooplankton as Bio-Indicators of Eutrophication and Possible eutrophication Controlling Measures for Kandy Lake,” 2002. [9] O. A. Ileperuma, “Environmental Pollution in Sri Lanka: A Review,” Journal of National Science Foundation, Vol. 28, No. 4, 2001, pp. 301-325. [10] O. A. Ileperuma, “Report on Water quality Examination in the Kandy and Nuwara Eliya Districts,” First Phase (Dry Season), 1998a. [11] O. A. Ileperuma, Report on Water quality Examination in the Kandy and Nuwara Eliya Districts, Second Phase (Rainy Season), 1998b. [12] P. D. Abel, “Water Pollution Biology,” Ellis Horwood, New York, 1989. [13] WHO, “Guidelines for Drinking Water Quality,” 3rd Edition, Incorporating the First and Second Addenda, Recommendations, Vol. 1, World Health Organization, Geneva, 2008. [14] R. Helmer and I. Hespanhol, (Eds.), “Water Pollution Control—A Guide to the Use of Water Quality Manage- ment Principles,” United Nations Environment Pro- gramme (UNEP) and World Health Organization, 1997. [15] JICA Study Team, “Improvement Project of the Moon Plains landfill site in Nuwara Eliya,” Environmental Im- pact Assessment, Kokusai Kogya Co., Ltd., Tokyo, 2003. |