N. Y. Misconi / Natural Science 3 (2011) 285-290
Copyright © 2011 SciRes. OPEN ACCESS
287
4. INVESTIGATION APPROACH
Smith [1] used basically similar methodology to the
one outlined below. However it still followed the classi-
cal method in the sense that the Sun was not observed
above the Martian atmosphere with the same instrument.
This condition is absolutely necessary in our new meth-
od in order to generate accurate values of the extinction
coefficient by dust. Smith [1] found daytime opacities of
0.42 to 0.52 and found changes during the daytime i.e.
morning vs. afternoon, and evening. The IMP has also
been used to determine the optical depth at night by im-
aging the zero-magnitude stars Arcturus, Vega, and Al-
tair. However, they found higher optical depth at night
(0.75 +/− 0.04) than day, which they attribute to “The
high optical depth has meant that images through the
geology filters typically only provide around 250 counts
on these objects in the maximum exposure time of 32.76
s. However, the diopter filter, used to investigate the
magnets in the near field, has a much wider bandpass
and provides several times the signal at the cost of a
smeared image of the star.” They reduced 21 images of
the star Arcturus taken over several nights and an air
mass range of 1.0 to 1.7 which gave the above optical
depth figure. They also attribute the higher optical depth
at nighttime vs. daytime to the formation of water ice.
Historically, information on the aerosols in the lower
part of the Earth’s atmosphere (~ 45 km) is of prime
interest to both astronomers, and atmospheric chemists
and scientists, for different reasons. The classical method
used by astronomers to obtain information on the extinc-
tion coefficient caused by aerosols can be summarized
by the following: using a small telescopic photopo-
larimeter with a narrow-band filter, one bright star can
be observed until it drifts near the horizon, continuously.
The star’s path over the sky covers a range of elevation
angles having different air masses. The star’s brightness
from this data is then plotted vs. its elevation angle or
the respective air masses. A least squares fit to the data
would then result in a solid line where the data is linear
(higher elevations). The slope of this line is proportional
to the extinction coefficient of the atmosphere at the
time and local of the observations.
Using this classical method to remove the atmospheric
effects from astronomical observations, we use the zo-
diacal light (ZL) as a good example since it is a well-
observed phenomenon from space, and more extensively
from the ground. Ground-based observations of the ZL
from Hawaii, Tenerife the Canary Islands, and other sites
has been going on for decades using photopolarimeters
(see [2,3,4,5,6,7,8]). The difficulties encountered in the
ground-based observations of the ZL are one of separa-
tion from atmospheric and non-atmospheric contami-
nants. The atmospheric contaminants are airglow line
and continuum emissions, extinction (scattering and ab-
sorption) of the ZL by atmospheric particulates and
off-axis light scattered into the instrument. The non-
atmospheric contaminants are: bright stars in the field of
view (FOV), integrated starlight (ISL, light from stars
that cannot be resolved by the instrument), and diffuse
galactic light (light scattered by interstellar dust).
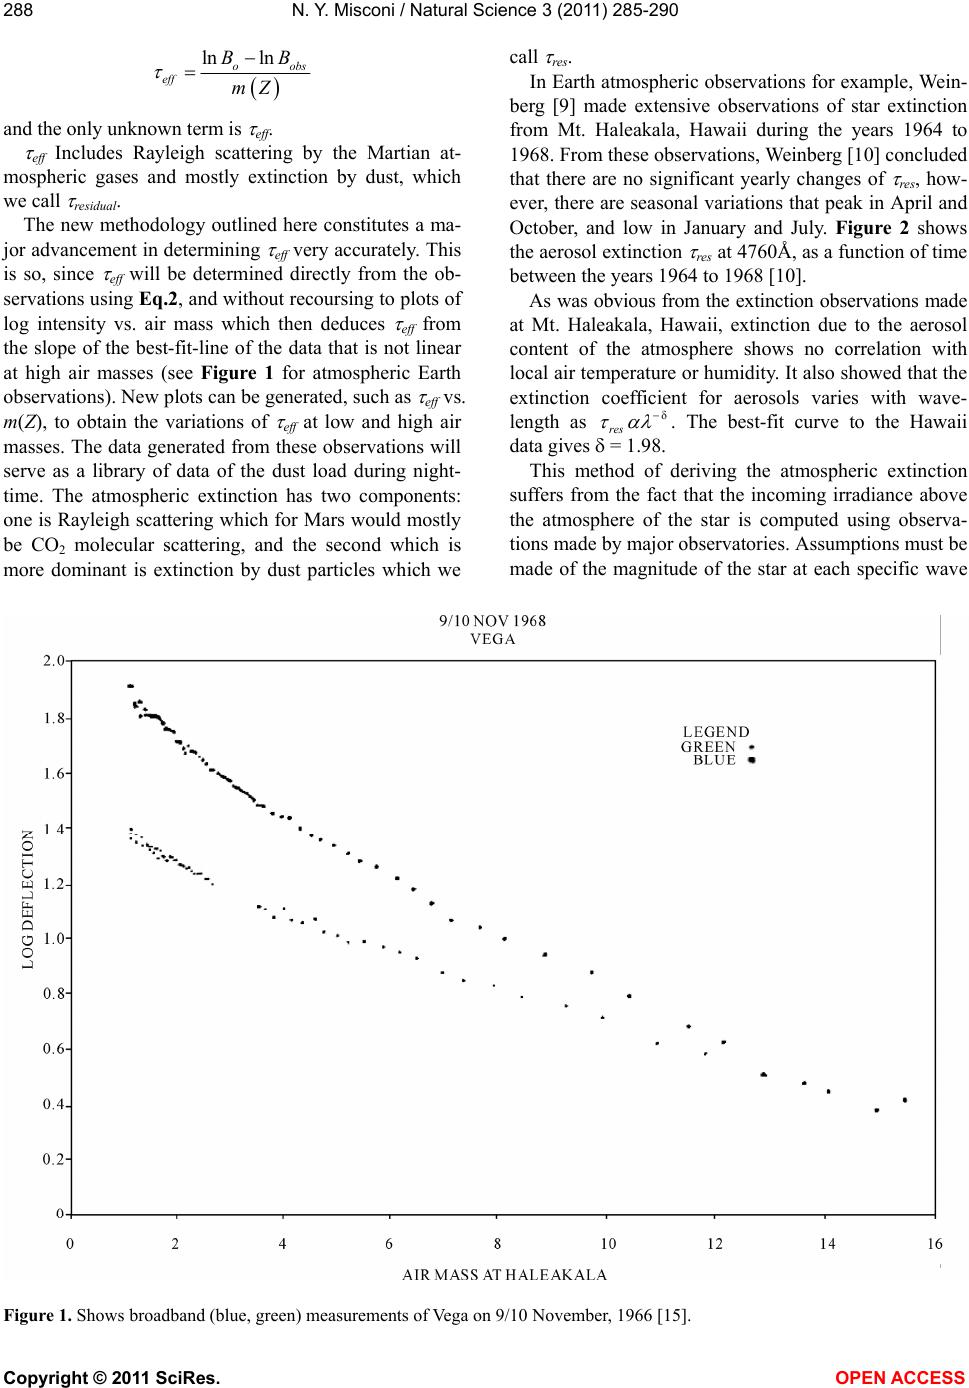
In the case of Rayleigh scattering the differences be-
tween the Earth atmosphere and the Martian atmosphere
must be taken into account (however it may prove to be
minimal) in the modeling techniques which serves to
separate this component from the residual aerosol com-
ponent. To give an example of data obtained on the at-
mospheric extinction coefficient using the classical
method, Figure 1 shows a broad-band (blue, green) mea-
surements of Vega, on 9/10, November, 1966, from Mt.
Haleakala, Hawaii [9]. If the data were linear with air
mass, the slope would be proportional to the extinction
coefficient.
5. THE CLASSICAL VS. THE NEW
METHOD
The atmospheric extinction can be calculated from the
classical relation:
emZ
obs o
BB
(1)
where Bo is the brightness of the star outside the atmos-
phere. In the old method described above, the graph of
log Bobs vs. the air mass m(Z) should be a straight line
from which both the extinction coefficient and Bo can be
determined. In reality, the best-fit line to the data is a
straight line only at small air masses (linear part of the
data). As air mass increases the data becomes non-linear
and the atmospheric extinction coefficient cannot be cal-
culated but rather estimated. The non-linear part at high
air masses is the part that gives information on the
dust/aerosol part in the atmosphere.
Our proposed method will measure Bo directly by ob-
serving the preselected star from space and Bobs by the
same imager at the Martian landing site. This measure-
ment is at the core of this new technique. So for each
m(Z), computed for the respective Z angle from the ze-
nith by using the Van Rhijn function for the landing site,
we will have the respective values of both Bo and Bobs
measured. This will give us directly without the need to
any plotting or measuring the slope of a best-fit line to
the data, which suffers from being non-linear at high air
masses. Thus, we can rewrite Eq.1 as:
ln lnln
obso eff
BB mZe
(2)