 Journal of Geoscience and Environment Protection, 2014, 2, 19-27 Published Online April 2014 in SciRes. http://www.scirp.org/journal/gep http://dx.doi.org/10.4236/gep.2014.22004 How to cite this paper: Fan, C. L. (2014). Spectral Analysis of Water Reflectance for Hyperspectral Remote Sensing of Water Quailty in Estuarine Water. Journal of Geoscience and Environment Protection, 2, 19-27. http://dx.doi.org/10.4236/gep.2014.22004 Spectral Analysis of Water Reflectance for Hyperspectral Remote Sensing of Water Quailty in Estuarine Water Chunlei Fan Depart ment of Biology, Patuxent Environmental and Aquatic Research Laboratory, Morgan State University, Baltimo re, USA Email: chunlei.fan@morgan.edu Received Dec emb er 2013 Abstract Hyperspectral remote sensing offers an effective approach for frequent, synoptic water quality measurements over a large spatial extent. However, the optical complexity of case 2 water makes the water quality monitoring by remote sensing in estuarine water a challenge. The prime objec- tive of this study was to develop algorithms for hyperspectral remote sensing of water quality based on in situ spectral measurement of water reflectance. In this study, water reflectance spec- tra R(λ) were acquired by a pair of Ocean Optic 2000 spectroradiometers during the summers from 2008 to 2011 at Patuxent River, a tributary of Chesapeake Bay, USA. Simultaneously, concen- trations of chlorophyll a and total suspended solids (TSS), as well as absorption of colored dis- solved organic matter (CDOM) were measured. Empirical models that based on spectral features of water reflectance generally showed good correlations with water quality parameters. The re- trieval model that using spectral bands at red/NIR showed a high correlation with chlorophyll a concentration (R2 = 0.81). The ratio of green to blue spectral bands is the best predictor for TSS (R2 = 0.75), and CDOM absorption is best correlated with spectral features at blue and NIR regions (R2 = 0.85). These empirical models were further applied to the ASIA Eagle hyperspectral aerial imagery to demonstrate the feasibility of hyperspectral remote sensing of water quality in the optical complex estuarine waters. Keywords Case 2 Water; Hyperspectral Remote Sensing; Water Quality 1. Introduction Coastal waters are under increasing pressures from anthropogenic disturbances at various temporal and spatial scales (Fan, Glibert et al., 2003, Anderson, Burkholder et al., 2008). Thus, the water quality monitoring is vital for assessing such impacts, and further provides important information for sustainable water resource manage- ments. While the traditional monitoring programs can provide valuable water quality information, these pro- grams are time and labor intensive, and lack of the necessary temporal or spatial information for better decision  C. L. Fan making. Remote sensing offers the most effective means for frequent, synoptic water quality measurements (Kendrick, 1976, Brando and Dekker, 2003, Campbell, Phinn et al., 2011). Over the last several decades, various empirical, semi-analytical, and analytical ocean color models have been developed to derive the water quality parameters of interest (e.g. concentrations of Chl a, total suspended solids (TSS), and the absorption of colored dissolved organic matter (CDOM)) (Senay, Shafique et al., 2002). However, coastal and estuarine waters are optically complex and the signal that a remote sensing detector collects is a mixed signal composed of various water optically active constituents from different sources (Brando and Dekker, 2003). For these case 2 waters, attempts to apply the ocean color models could result in poor predictive ability in retrieval of various water quality proprieties (Hunter, Tyler et al., 2010). As an integrated part of hyperspectral remote sensing mission in the Chesapeake Bay, water reflectance spec- tra R(λ), as well as the discrete water samples for optically active constituents measurements, were collected at 11 field stations during the summers from 2008 to 2011 in the Patuxent River, a tributary of Chesapeake Bay, USA. In this study, we examined the relationships between the spectral features of water reflectance R(λ) and water quality parameters. The main objective of this study is to establish empirical algorithms that could be used for retrieval of water quality parameters from airborne hyperspectral data in the Chesapeake Bay watershed, which provides a rapid and effective water quality monitoring technique over a large spatial area for best coastal mana ge me nts. 2. Methods 2.1. Study Area The Patuxent River is a large tributary of Chesapeake Bay, USA with a 2427 KM2 of watershed and a rapid in- creasing population (Figure 1). The river provides a diverse and varied habitat for fish, shellfish, birds, and oth- er animals. Current landuse and landcover in the watershed is: 30% of developed area, 23% of agriculture, 40% of forest, and 3% of water. Figure 1 shows the locations of the 11 field stations where the in situ water reflec- tance spectra R(λ) were taken during the summers from 2008 to 2011. These stations were generally selected along longitudinal river transect to capture a salinity gradient from river to the Chesapeake Bay. The stations re- flected the diversity of estuarine habitats, from the low salinity, high clay and CDOM concentration waters in the upriver to the mesohaline, low clay concentration waters at the river mouth. These stations also represented a wide range of bio-optical properties which are necessary for algorithm development. 2.2. Discrete Water Sampling At each field station, the following physical, chemical and biological parameters were measured: GPS Coordi- nates, secchi disk depth (m), salinity (psu), temperature C˚, Chl a and TSS concentrations, and CDOM absor- bance at 440 nm. The bulk water samples were collected near surface by bucket and transferred to 20L polye- thylene container and placed in the shade. At the laboratory, samples were refrigerated and usually processed within 6 h of collection. All laboratory procedures are consistent with Standard Methods for the Examination of Water and Wastewater. Chl a was extracted using 90% acetone and measured with a Spectronic Genesys II spectrophotometer (Spectronics, Inc.). Total suspended solids analysis was performed by filtering water samples on pre-weighed filters, which were then placed in a drying oven at 70˚C for 24 hours and reweighed. Any weight gain was considered to be the TSS dry weight. The CDOM absorbance was measured using filtrate from the glass fiber filtration procedure for Chl a and TSS analysis. The absorbance was measured in quartz cuvettes (10 cm path length) at 40 nm intervals between 320 nm and 580 nm using the Genysis II Spectrophotometer. CDOM absorbance at 440 nm is reported here. 2.3. Reflectance Measurement and Imagery Acquisition The in situ optical measurements (n = 53) were made on board a research vessel within 3.5 h of solar noon. Hyperspectral (approximately 2000 bands with sampling interval of ~0.3 nm and a spectral resolution of ~1.5 nm) water irradiance reflectance R(λ) was measured with a dual Ocean Optics USB2000 radiometer system from 350 to 1000 nm range. Light was brought to the radiometers by 200-micron diameter, shielded fiber optic cables. The first radiometer equipped with a cosine collector (yielding a hemispherical 180˚ field of view), and was pointed upward to measure down welling incident irradiance (E(λ)d). The second radiometer equipped with  C. L. Fan Figure 1. Map of the study area and the locations of the field stations for in situ measurement on the Patuxent River. The location of the study area in Chesa- peake Bay watershed is showed in upper right map. a 25˚ field-of-view simultaneously measured the upwelling radiance of water (L(λ)u) from just below the wa- ter’s surface. The upwelling fiber was pointed 15˚ - 20˚ from nadir in the direction of 90˚ away from the sun to minimize sun glint and sky radiance. Each reflectance spectra was an average of 8 - 15 scans, and six separate spectra were collected. Therefore, a single, average spectrum may be an average of 50 - 80 scans. Furthermore, the reflectance R(λ) was calibrated by measuring the upwelling radiance of a white Spectralon reflectance panel (99% reflectance, Labsphere, Inc., North Sutton, NH), and a custom software package called “CALMIT Data Acquisition Program” or CDAP (University of Nebraska, Lincoln, NE) compared the signals from the two fibers and generated a normalized percentage of reflectance as: ()( )( )( )( )( ) %R Lλu/E λdEλcal / LλcalR λcal 100 λ = ××× R(λ)cal is the reflectance of the spectralon panel linearly interpolated to match the band centers of each radi- ometer. A smoothing and integrating macro were used to resample the % R(λ) at 1 nm intervals in the range of 400 to 800 nm for further analysis. The smoothing process did not affect the shape or magnitude of the spectral features of interest, but rather reduced the number of spectral bands. Aerial hyperspectral imagery of the Patuxent River with 2 m spatial resolution of was acquired during a NOAA flyover mission in the summer of 2005 using AISA Eagle VNIR remote hyperspectral sensor (Center for Advance Land Management Information Technologies, University of Nebraska, Lincoln). AISA Eagle is a pushbroom hyperspectral system with 1000 pixel swath width which can collect hyperspectral data at 2 m spa- tial resolution in 97 contiguous bands (2.5 nm bandwidth from 435 to 730 nm and 10 nm bandwidth from 730 to 950 nm). Total 6 segments over 50 km stretch of the Patuxent River were sampled during the summer of 2005. 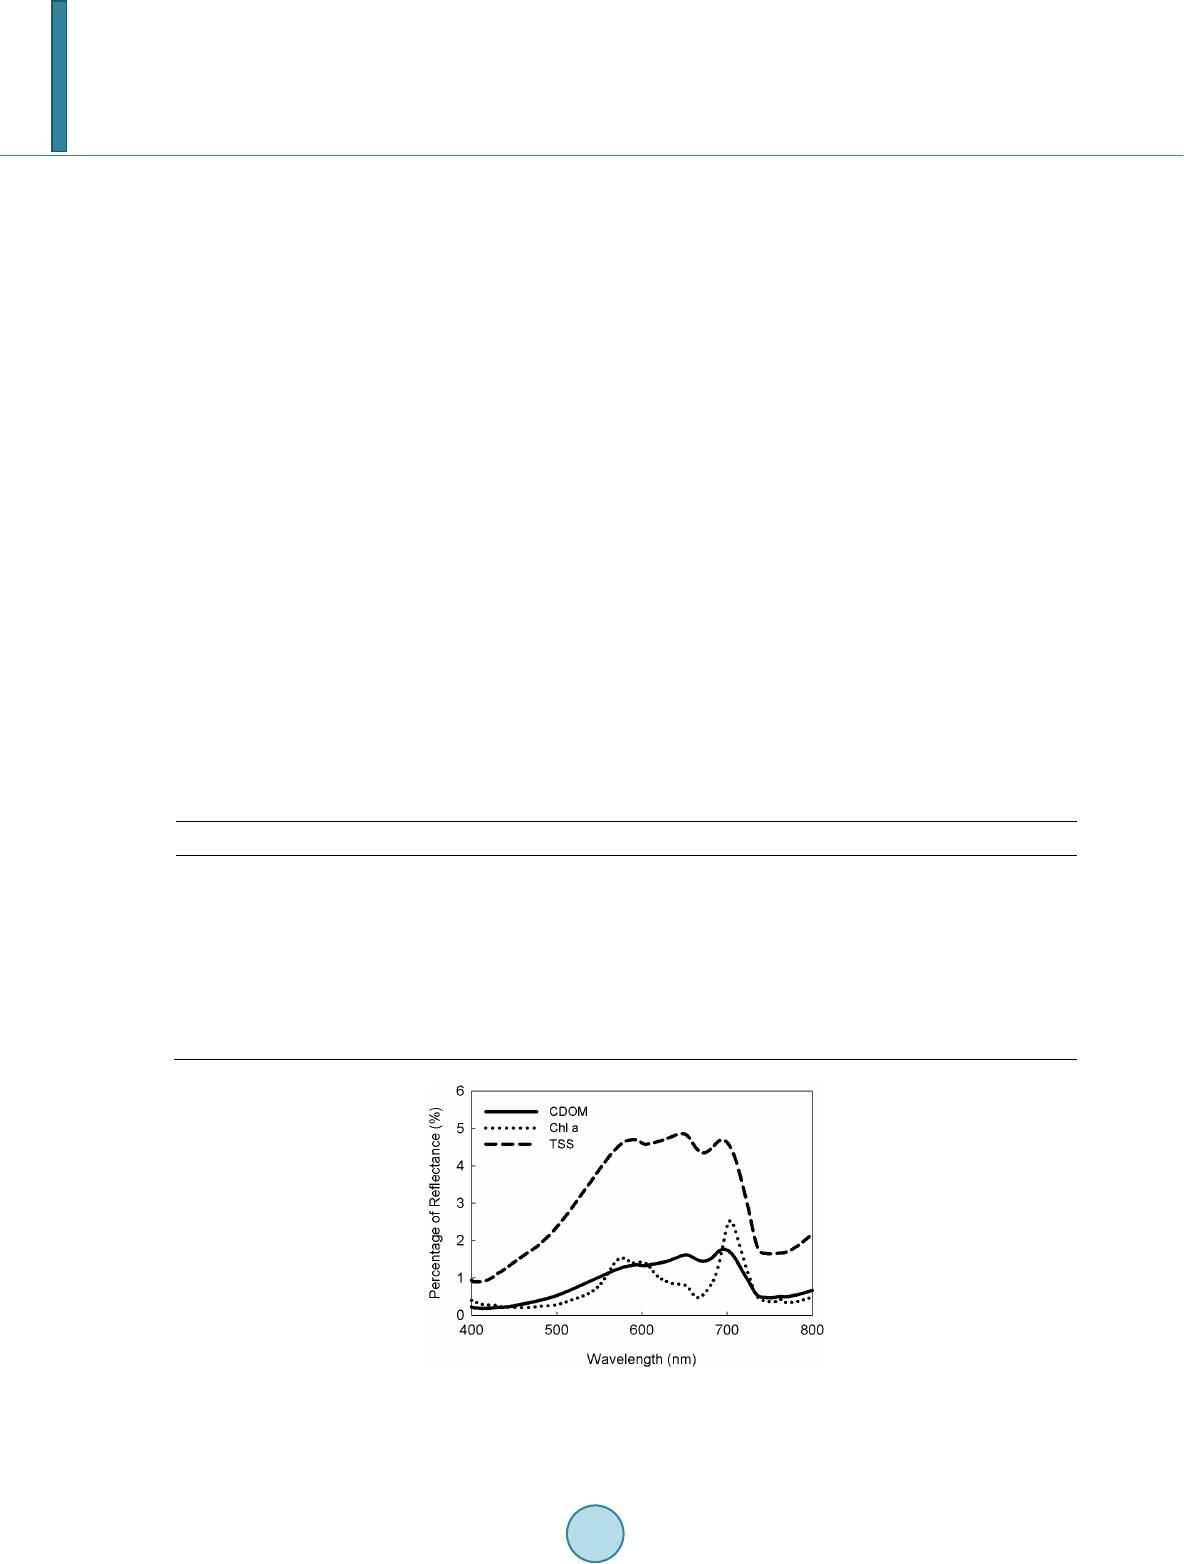 C. L. Fan 3. Results and Discussion 3.1. In Situ Water Quality Parameters The water quality parameters exhibited a large variability along the Patuxent River in this study (Table 1). Since all measurements were carried out during summer seasons, the water temperatures were relatively high with the range from 26.2˚C to 31.3˚C. The salinity also has a large variability, with values ranging from 0.1 psu to more than 12 psu from the freshwater river to mesohaline bay water. The optically active water constituents also show a large variability among the Patuxent River. The Chl a concentration presented a mean value of 24.6 µg L−1 with a standard deviation of 15.1 µg L−1. The TSS concen- trations ranged from 7.1 mg L−1 to 64.8 mg L−1 with a mean value of 22.4 mg L−1. The high TSS concentrations were mainly distributed at the area or stations which are generally influenced by terrestrial sources, and corres- ponding with river runoff events. The absorption of CDOM at 440 nm ranged from 0.2 m−1 to 2.5 m−1 with an average of 0.83 m−1. Furthermore, these optically active water constituents are not related to each other in this study, suggesting a complex origin of these bio-optical properties. 3.2. Spectral Features of Water Reflectance R(λ) The water reflectance R(λ) measured at the Patuxent River also displayed a high degree of variation both in magnitude and shape over the visible and NIR region as the results of largely uncorrelated bio-optical properties. However, the influences on the general shape and magnitude of the reflectance by bio-optical constituents were still observed in this study. As showed in Figure 2, when the water has high chlorophyll concentration, the ref- lectance spectra of the water showed characteristic absorption at the blue (400 - 500 nm) and red (600 - 680 nm) wavelength regions, which results in low reflectance (i.e., trough), especially at ~670 nm wavelength. Also, there is a phytoplankton scattering peak at ~700 nm, which is the result from a combination of chlorophyll fluo- rescence and the strong water absorption at wavelength longer than 700 nm. This general influence on spectral Table 1. Statistics for environmental parameters of discrete water samples (n = 63). Parameters Minimum Maximum Mean Standard deviation Salinity, psu 0.1 12.0 7.1 3.85 Temp, ˚C 26.2 31.3 2 8.7 1.17 Secchi depth, m 0.3 1.5 0.8 0.31 Chl a, μg/L 2.1 77.9 24.6 15.12 TSS, mg/L 7.1 64.8 22.4 13.22 ABS440, m−1 0.2 2.5 0.83 0.52 Figure 2. The general spectral features for coastal wa- ter that are dominated by high concentrations of chl a, TSS concentrations and absorption of CDOM.  C. L. Fan reflectance by phytoplankton pigments (i.e. chlorophyll) is also consistent with previous studies (Olmanson, Brezonik et al., 2013, Warner and Fan, 2013). The upper Patuxent River represents sediment-dominated water with high TSS concentrations of 50 mg/L. Although chl a will influence the spectral feature, such as the small trough at 670 nm, the TSS dominated the spectral features of water reflectance, with high reflectance across a wide spectra range from 560 - 700 nm. This influence of TSS in regulating water reflectance spectra was also observed in the previous studies (Toole and Siegel, 2001) (Lubac and Loisel, 2007). Because of the strong ab- sorption by CDOM at blue and green spectral ranges, the reflectance spectra of high CDOM water were charac- terized by low reflectance across the blue and green spectral regions, with very small reflectance peaks near 660 and 700 nm (Olmanson, Brezonik et al., 2013). 3.3. Retrieval Model Development The general features of reflectance spectra observed from the in situ measurements further provided insights re- garding wavelength bands selection likely to be used for retrieval models to predict the water quality parameters (i.e. chl a, TSS, and CDOM) (Olmanson, Brezonik et al., 2013). Based on the in situ measurements in this study, band ration algorithms were developed to establish the relationships between water reflectance and selected wa- ter quality parameters, and this approach has been suggested as one of the most appropriate method elsewhere (Legleiter and Roberts, 2005). Several previous studies showed strong relationships between log transformed water quality data and reflectance values from hyperspectral data (Olmanson, Brezonik et al., 2013), and log transformation could further make the water quality data near normally distributed to meet the assumption of re- gression. Therefore, log-transformed data were used in this study for model development. Chlorophyll a mod e l : Chl a is commonly measured in water quality monitoring programs, and has strong re- lationships with the spectral ratio of 700 to 670 nm in our dataset. This was also found to be the case in several previous studies (Schalles, 2006). This relationship is due to the backscattering by phytoplankton at the 700 nm and the strong absorption at 670 nm. In our dataset, even with a complex bio-optical features, the band ratio of 700 to 670 nm was strongly correlated with chl a concentration as showed in Figur e 3(A). The regression model is of the following form: LN(Chl a) = 1.29(R700/R670) + 1.83 with R2 = 0.81 CDOM model: Compared to TSS, the CDOM has a strong absorption effect across the blue and green spec- tral regions (Fig ure 2). Because of low CDOM concentration, some of the impacts of CDOM on spectral varia- bility have been largely neglected un previous studies (Toole and Siegel, 2001, Lubac and Loisel, 2007). The da- taset in this study suggested that the increase in the CDOM concentration strongly suppressed the reflectance at blue to green wavelength region, and then this effect declined exponentially toward the longer wavelength. Based on this CDOM spectral feature, the regression model (Figure 3( B)) was developed as the following form: LN(CDOM) = 0.89(R700/R450) – 0.15 with R2 = 0.83 TSS model: TSS represents both living organic solids (mainly phytoplankton) and inorganic suspended solids which mainly contribute to scattering of light with low absorption. So, as showed in Fig ure 2, water with high TSS concentration tends to have high reflectance, especially at green to red spectral regions. Remote Sensing algorithms for TSS reported in literature are less consistent and more depended on the specific bio-optical con- ditions (Doxaran, Cherukuru et al., 2005). In our dataset, the relationships between the spectral properties and the log-transformed TSS concentration showed good correlation with the ratio of 650:420 nm. The regression model (Figure 3(C)) is of the following form: LN(TSS) = 0.23(R650/R420) + 1.98, with R2 = 0.75 3.4. Water Quality Mapping The ASIA eagle hyperspectral imagery was classified based on the procedure of Olmanson et al. (2013) (Ol- manson, Brezonik et al., 2013). The EXELIS ENVI 4.7 and ESRI ArcGIS 10.1 were used for image processing. The image for a flight segment that were acquired at mouth of Patuxent River, summer 2005 was first corrected geospatially and radiometrically to “at platform reflectance”, then atmospheric correction was conducted on the image using the FLAASH in ENVI using the band at 820 nm wavelength to produce the image of “water reflec- tance”. Once the image preprocessing was complete, a “water only” image was produced by preforming a supervised classification in ENVI based on the selected water region of interests (ROIs). The terrestrial features were  C. L. Fan Figure 3. Scatter plots of in situ log transformed water quality parameters versus corresponding band ratio values. (A) Chl a, (B) CD OM, (C) T SS. masked out to create the water-only image for further analysis. Finally, the band ratio models based on in situ spectral measurement were applied to these radiometric data in the image to create the pixel-level water quality maps . Figure 4 shows the pixel-level maps of water quality (chl a, TSS and CDOM) in a small section of the flight segment at the mouth of the Patuxent River which was collected by a AISA Eagle hyperpsectral radiometer in the summer, 2005. These maps clearly demonstrate the heterogeneity of water quality over a relative small area. A patch of phytoplankton bloom (dinoflagellate P. minimum, based on field observation) with high chl a con- centration was observed in the middle of the river, while the chl a concentration in other area was relative low. As Figure 4 shows, the high TSS concentration was mainly dominated in the small creeks, coves, and river banks. The CDOM absorption was also found high in the small creeks and coves around the river, as well as in the area with phytoplankton blooms. This suggests the origin of CDOM could be both terrestrial or produced during the algal bloom.  C. L. Fan Figure 4. Maps of Chl a, TSS concentrations, and CDOM absorption at the mouth for the Patuxent River, summer 2005.  C. L. Fan The feasibility of hyperspectral remote sensing that can capture the fine scale variation of water quality para- meters was illustrated in the F igure 4. In these maps, the algal bloom could be very patchy, and there was a big variation in these water quality parameters over a relative small body of water. These images could provide vast water quality information that would not be seen by conventional monitoring program which probably only in- volve one sampling station in the same area. 4. Conclusion With the availability of hyperspectral data, which can provide higher spectral resolution for the specific features of water quality parameters, recent hyperspectral remote sensing holds the promise to accurately estimate water quality parameters (Chang, Dickey et al., 2006). Hyperspectral remote sensing can capture a more comprehen- sive picture of water quality than is obtained by a conventional ground-based monitoring program. However, to make this feasible, the in situ spectral measurement is a critical step toward retrieval model development. Be- cause of the spectral features of water reflectance by different water quality parameters, the band selection or model development should focus on these wavelength regions for retrieval of such optical constituents (Dall’Olmo, Gitelson et al., 2005). Our study showed the reflectance ratio R700/670 is well correlated with chl a concentration, the ratio of red and green spectral region is best for TSS prediction, and the CDOM absorption was found be to correlated with the spectral features in NIR and blue regions. These developed algorithms can be further applied to hyperspectral images to generate detailed water quality maps for ecosystem monitoring and mana ge me nts. However, the coefficients in these retrieval models were derived from the dataset that is specific to the study area, so do not necessarily represent the coastal waters in other areas. The accuracy of such algorithms is always subject to the location of ground truthing dataset. Also, future study of the direct measurements of in situ i nhe - rent optical properties (IOPs), such as backscattering and absorption coefficients and their relationships with water reflectance R(λ) are needed for further development of algorithms for water quality retrievals by remote sensing in estuarine waters. Acknowledgem ent s We appreciate the field help from Morgan State University Environmental and Aquatic Environmental Lab, and the early comments and discussions on this work. This work was partly supported by NOAA ECSC program, the NSF award 1036586 to university of Maryland Eastern Shore, and the USDA NIFA award VAE-2011- 02523 to Virginia State University (sub-award to Morgan State University). References Anderson, D. M., Burkholder, J. M., Cochlan, W. P., Glibert, P. M., Gobler, C. J., Heil, C. A., Kudela, R. M., Parsons, M. L., Rensel, J. E. J., Townsend, D. W., Trainer, V. L., & Var go, G. A. (2008). Harmful Algal Blooms and Eutrophication: Examining Linkages from Selected Coastal Regions of the United States. Harmful Algae, 8, 39-53 . http://dx.doi.org/10.1016/j.hal.2008.08.017 Brando, V. E., & Dekker, A. G. (2003). Satellite Hyperspectral Remote Sensing for Estimating Estuarine and Coastal Water Quality. IEEE Transactions on Geoscience and Remote Sensing, 41, 1378 -1387. http://dx.doi.org/10.1109/TGRS.2003.812907 Campbell, G., Phinn, S. R., Dekker, A. G., & Brando, V. E. (2011). Remote Sensing of Water Quality in an Australian Tropical Freshwater Impoundment Using Matrix Inversion and MERIS Images. Remote Sensing of Environment, 115, 2402-2414. http://dx.doi.org/10.1016/j.rse.2011.05.003 Chang, G., Dickey, T. , & Lewi s , M. (2006). Toward a Global Ocean System for Measurements of Optical Properties Using Remote Sensing and in Situ Observations. Remote Sensing of the Marine Environment: Manual of Remote Sensing, 6, 285-326. Dall’Olmo, G., Gitelson, A. A., Rundquist, D. C., Leavitt, B., Barrow, T. , & Holz, J. C. (2005). Assessing the Potential of SeaWiFS and MODIS for Estimating Chlorophyll Concentration in Turbid Productive Waters Using Red and Near-Infrared Bands. Remote Sensing of Environment , 96, 176 -187. http://dx.doi.org/10.1016/j.rse.2005.02.007 Doxaran, D., Cherukuru, R., & Lavender, S. (2005). Use of Reflectance Band Ratios to Estimate Suspended and Dissolved Matter Concentrations in Estuarine Waters. International Journal of Remote Sensing, 26, 1763-1769. http://dx.doi.org/10.1080/01431160512331314092  C. L. Fan Fan, C., Glibert, P. M., & Burkholder, J. M. (2003). Characterization of the Affinity for Nitrogen, Uptake Kinetics, and En- vironmental Relationships for Prorocentrum Minimum in Natural Blooms and Laboratory Cultures. Harmful Algae, 2, 283-299. http://dx.doi.org/10.1016/S1568-9883(03 )00 04 7-7 Hunter, P. D., Tyler, A. N., Carval ho , L., Codd, G. A., & Mab erly, S. C. (2010). Hyperspectral Remote Sensing of Cyano- bacterial Pigments as Indicators for Cell Populations and Toxins in Eutrophic Lakes. Remote Sensing of Environment, 114, 2705-2718. http://dx.doi.org/10.1016/j.rse.2010.06.006 Kendrick, P. (1976). Remote Sensing and Water Quality. Journal (Water Pollution Control Federation), 48, 2243-2246. Legleiter, C. J., & Roberts, D. A. (2005). Effects of Channel Morphology and Sensor Spatial Resolution on Image-Derived Depth Estimates. Remote Sensing of Environment, 95, 231-247. http://dx.doi.org/10.1016/j.rse.2004.12.013 Lubac, B., & Lois el , H. (2007). Variability and Classification of Remote Sensing Reflectance Spectra in the Eastern English Channel and Southern North Sea. Remote Sensing of Environment, 110, 45-58. http://dx.doi.org/10.1016/j.rse.2007.02.012 Olmanson, L. G., Brezonik, P. L., & Bauer, M. E. (2013). Airborne Hyperspectral Remote Sensing to Assess Spatial Distri- bution of Water Quality Characteristics in Large Rivers: The Mississippi River and Its Tributaries in Minnesota. Remote Sensing of Environment, 130, 254-265. http://dx.doi.org/10.1016/j.rse.2012.11.023 Schalles, J. F. (2006). Optical Remote Sensing Techniques to Estimate Phytoplankton Chlorophyll a Concentrations in Coastal. Remote Sensing of Aquatic Coastal Ecosystem Processes, Springer, 27-79. Senay, G. B., Shafique, N. A., Aut r ey, B. C., Fulk, F., & Cormier S. M. (20 02) . The Selection of Narrow Wavebands for Op - timizing Water Quality Monitoring on the Great Miami River, Ohio Using Hyperspectral Remote Sensor Data. Journal of Spatial Hydrology, 1. Toole, D. A., & Siegel, D. A. (2001). Modes and Mechanisms of Ocean Color Variability in the Santa Barbara Channel. Journal of Geophysical Research: Oceans (1978-2012), 1 06, 269 85 -27000. Warner, R. A., & Fan, C. (2013). Optical Spectra of Phytoplankton Cultures for Remote Sensing Applications: Focus on Harmful Algal Blooms. International Journal of Environmental Science and Development, 94-98 .
|