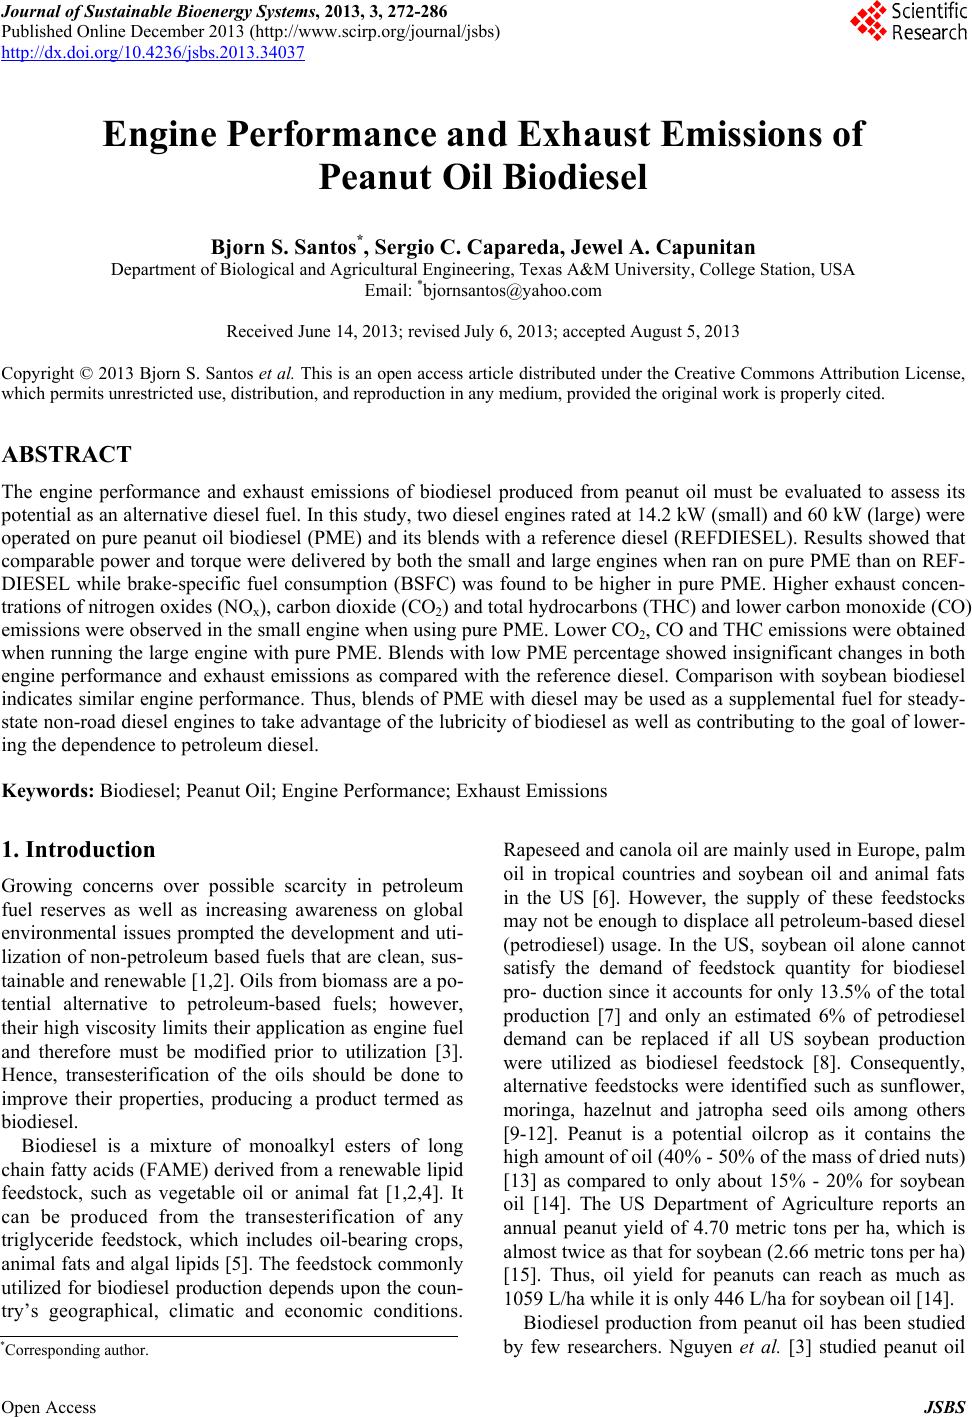
 Journal of Sustainable Bioenergy Systems, 2013, 3, 272-286 Published Online December 2013 (http://www.scirp.org/journal/jsbs) http://dx.doi.org/10.4236/jsbs.2013.34037 Open Access JSBS Engine Performance and Exhaust Emissions of Peanut Oil Biodiesel Bjorn S. Santos*, Sergio C. Capareda, Jewel A. Capunitan Department of Biological and Agricultural Engineering, Texas A&M University, College Station, USA Email: *bjornsantos@yahoo.com Received June 14, 2013; revised July 6, 2013; accepted August 5, 2013 Copyright © 2013 Bjorn S. Santos et al. This is an open access article distributed under the Creative Commons Attribution License, which permits unrestricted use, distribution, and reproduction in any medium, provided the original work is properly cited. ABSTRACT The engine performance and exhaust emissions of biodiesel produced from peanut oil must be evaluated to assess its potential as an alternative diesel fuel. In this study, two diesel engines rated at 14.2 kW (small) and 60 kW (large) were operated on pure peanut oil biodiesel (PME) and its blends with a reference diesel (REFDIESEL). Results showed that comparable power and torque were delivered by both the small and large engines when ran on pure PME than on REF- DIESEL while brake-specific fuel consumption (BSFC) was found to be higher in pure PME. Higher exhaust concen- trations of nitrogen oxides (NOx), carbon dioxide (CO2) and total hydrocarbons (THC) and lower carbon monoxide (CO) emissions were observed in the small engine when using pure PME. Lower CO2, CO and THC emissions were obtained when running the large engine with pure PME. Blends with low PME percentage showed insignificant changes in both engine performance and exhaust emissions as compared with the reference diesel. Comparison with soybean biodiesel indicates similar engine performance. Thus, blends of PME with diesel may be used as a supplemental fuel for steady- state non-road diesel engines to take advantage of the lubricity of biodiesel as well as contributing to the goal of lower- ing the dependence to petroleum diesel. Keywords: Biodiesel; Peanut Oil; Engine Performance; Exhaust Emissions 1. Introduction Growing concerns over possible scarcity in petroleum fuel reserves as well as increasing awareness on global environmental issues prompted the development and uti- lization of non-petroleum based fuels that are clean, sus- tainable and renewable [1,2]. Oils from biomass are a po- tential alternative to petroleum-based fuels; however, their high viscosity limits their application as engine fuel and therefore must be modified prior to utilization [3]. Hence, transesterification of the oils should be done to improve their properties, producing a product termed as biodiesel. Biodiesel is a mixture of monoalkyl esters of long chain fatty acids (FAME) derived from a renewable lipid feedstock, such as vegetable oil or animal fat [1,2,4]. It can be produced from the transesterification of any triglyceride feedstock, which includes oil-bearing crops, animal fats and algal lipids [5]. The feedstock commonly utilized for biodiesel production depends upon the coun- try’s geographical, climatic and economic conditions. Rapeseed and canola oil are mainly used in Europe, palm oil in tropical countries and soybean oil and animal fats in the US [6]. However, the supply of these feedstocks may not be enough to displace all petroleum-based diesel (petrodiesel) usage. In the US, soybean oil alone cannot satisfy the demand of feedstock quantity for biodiesel pro- duction since it accounts for only 13.5% of the total production [7] and only an estimated 6% of petrodiesel demand can be replaced if all US soybean production were utilized as biodiesel feedstock [8]. Consequently, alternative feedstocks were identified such as sunflower, moringa, hazelnut and jatropha seed oils among others [9-12]. Peanut is a potential oilcrop as it contains the high amount of oil (40% - 50% of the mass of dried nuts) [13] as compared to only about 15% - 20% for soybean oil [14]. The US Department of Agriculture reports an annual peanut yield of 4.70 metric tons per ha, which is almost twice as that for soybean (2.66 metric tons per ha) [15]. Thus, oil yield for peanuts can reach as much as 1059 L/ha while it is only 446 L/ha for soybean oil [14]. Biodiesel production from peanut oil has been studied by few researchers. Nguyen et al. [3] studied peanut oil *Corresponding author.  B. S. SANTOS ET AL. 273 extraction using diesel-based reverse-micellar microemul- sions. Their product is a peanut oil-diesel blend which was tested for peanut oil fraction, viscosity, cloud point and pour point, all of which met the requirements for bio- diesel fuel. Moser [16], on the other hand, prepared me- thyl esters from high-oleic peanut oil using catalytic so- dium methoxide and obtained 92% yield of peanut me- thyl esters which exhibited excellent oxidative stability but poor cold flow properties. A study by Kaya et al. [17] showed ester conversion of 89% via sodium hydrox- ide-catalyzed transesterification of solvent-extracted oil from peanuts grown in Turkey. The obtained biodiesel has a viscosity close to petrodiesel but has calorific value 6% less than that for petrodiesel. Important fuel proper- ties such as density, flash point, cetane number, pour point and cold point fall within the set standards. Another important aspect in biodiesel research that must be considered is the assessment of its performance as an engine fuel. Studies involving the application of peanut oil biodiesel in an engine are very limited in lit- erature. A number of studies discussed the performance of biodiesel from other feedstocks such as soybean, sun- flower, canola, in an engine which specifically has the effect of using biodiesel blends on engine power and fuel economy [18]. However, engine performance may be affected by the variation in biodiesel quality caused by differences in the esterification process and the raw ma- terials used, among others [19]. Aside from engine testing, emissions associated with the use of biodiesel also need to be evaluated to assess its cleanliness as a fuel. The Environmental Protection Agency (EPA) reported that non-road diesel engines have a substantial role in contributing to the nation’s air pollution and therefore stricter emission standards were imposed with regards to the amounts of particulate mat- ter, nitrogen oxides and sulfur oxides [20]. This necessi- tates the analysis of biodiesel emissions to ensure com- pliance with current EPA regulations. Hence, this study was conducted to investigate the ap- plication of peanut oil biodiesel as an engine fuel and compared it with those of soybean oil biodiesel and a ref- erence petroleum diesel. This study aims to: 1) assess fuel properties of the peanut oil biodiesel in accordance with ASTM standards; 2) determine the effect of blend- ing percentage of biodiesel on the characteristic engine performance (i.e. net brake power, torque and specific consumption); 3) determine the relationship between pollutant concentrations (i.e. NOx, THC, CO and CO2) in a diesel engine exhaust and the percentage of biodiesel in fuel blends; and 4) compare performance with exhaust emissions when using peanut oil methyl ester (PME), soybean oil methyl ester (SME) and a reference diesel (REFDIESEL). 2. Materials and Methods 2.1. Materials PME was prepared from previously extracted and refined oils at the Bio-Energy Testing and Analysis (BETA) La- boratory at Texas A & M University, College Station, TX. The following conventional biodiesel reaction con- ditions were used: reaction time, 1 h; weight of catalyst, 0.4 wt%. of initial oil weight; vol. of methanol, 15%·vol. of oil; reaction temperature: 50˚C. The biodiesel obtained was then blended with a reference diesel (REFDIESEL- ULSD standard no. 2 reference fuel). The test fuels were analyzed to determine if they meet ASTM 6751-07 stan- dard. Fuels and fuel blends are as follows: 5% PME-95% REFDIESEL-B5 PME 20% PME-80% REFDIESEL-B20 PME 50% PME-50% REFDIESEL-B50 PME 100% PME-0% REFDIESEL-B100 PME Soybean oil biodiesel (SME) and the reference diesel were purchased commercially. 2.2. ASTM Characterization of Biodiesel Fuels ASTM characterization of the biodiesel was done to en- sure that the test fuel used in the study conforms to the ASTM D6751-08 standard (ASTM, 2008). Some of the referenced procedures in the ASTM 6751 standard were conducted in the BETA lab. Such procedures were: cloud and pour point (ASTM D2500), flash point (ASTM D93), water and sediment (ASTM D2709), kinematic viscosity (ASTM D445), acid number (ASTM D664) and gross heating value (ASTM D4809). 2.3. Engine Performance and Exhaust Emissions Testing Engine performance and exhaust emissions testing were conducted at the BETA Lab engine testing facility. In- strumentation needed to measure some of the EPA regu- lated emissions, such as CO, CO2, NOx, THC, and SO2 were in place. 2.3.1. Test Equipment The BETA lab uses two (2) test engines with their own respective test beds and dynamometer set-ups. One of the test engines was a 3-cylinder Yanmar 3009D diesel en- gine rated at 14.2 kW. Table 1 lists the general specifica- tions of the small and large test engine. The engine load was controlled by a water-cooled eddy current absorption dynamometer with a Dynamatic® EC 2000 controller. The maximum braking power of the dynamometer was rated at 22.4 kW (30 hp) at 6000 rpm. The large test engine used in the study was an in-line, 4-cylinder, 4.5 L, four stroke, naturally aspirated John Open Access JSBS  B. S. SANTOS ET AL. 274 Table 1. General specifications for Yanmar 3009D and JD4045DF150 diesel engines. Specification Yanmar 3009D JD 4045DF150 Rated power 14.2 kW (19 hp) at 3000 rpm 60 kW (80 hp) at 2700 rpm Number of cylinders 3 4 Bore 72 mm 106 mm Stroke 72 mm 127 mm Displacement 0.879 L 4.5 L Compression ratio 22.6:1 17.6:1 Combustion system Indirect injection Direct injection Aspiration Natural Natural Deere diesel engine. It was connected to a 450 HP water- cooled eddy current inductor dynamometer (Pohl Asso- ciates Inc., Hatfield, PA). The engine’s rated power was at 80 HP with rated speed of 2500 rpm. The engine’s ge- neral specifications were listed in Table 1. The engine load and throttle were controlled by a multi-loop Inter- Loc V dynamometer and throttle controller (Dyne Sys- tems Inc., Jackson, WI). 2.3.2. In strume ntation and Data Acquisition Equipment Figure 1 shows the schematics of the data acquisition system for the Yanmar 3009D and JD 4045DF150 diesel engines. Instrumentation includes measurement of test cell ambient conditions (barometric pressure, tempera- ture, and humidity), engine speed and torque, fuel flow rates, engine manifold pressures and temperatures, and engine exhaust gaseous emissions measurements. Fuel flow was measured with an AW positive displacement gear type flow meter with 50% ± 1% duty cycle. Mani- fold pressure measurements were taken by strain gauge pressure transducers positioned in the exhaust and intake manifolds. Temperature measurements were measured with shielded type-K thermocouples at roughly the same aforementioned locations as pressure. Engine brake tor- que and speed were acquired from the dynamometer. National Instruments (NI) data acquisition equipment (DAQ) was installed in different parts of the test engines and the test cell. A fiber optic cable connects the remote computer to the NI PCI-7831R FPGA module. Thermo- couples and pressure transducers were connected to the SCXI 1320 and SCXI 1326 signal conditioning units. Torque and engine speed data are collected using a NI Labview program developed for this research. Exhaust emissions, such as CO, NOx, and SO2 were measured with electrochemical SEM sensors, while CO2 and total hydrocarbons (THC) were measured with NDIR sensors, all assembled in an Enerac™ model 3000E emissions analyzer. The emissions analyzer has a capability of measuring 0 to 3500 ppm NOx concentrations, 0 to 2000 ppm CO and SO2 concentrations, with an accuracy of ±2% of reading; 0 to 5% by volume total hydrocarbon concentra- tions, and 0 to 20% CO2 concentrations with an accuracy of ±5% of reading. In addition, it also measures the am- bient temperature, stack temperature, stack velocity, and test cell O2 concentrations. 2.3.3. Experimental Method Engine power tests are conducted in accordance with SAE Standard Engine Power Test Code for diesel en- gines (SAE J1349 Revised MAR2008). Baseline engine performance and emissions tests are performed using ULSD reference diesel fuel. Engine performance data for ULSD reference diesel were corrected to the standard atmospheric conditions using the compression ignition engine correction formula according to SAE J1349 - MARCH2008. Variables such as air and relative humidity are care- fully monitored. Fuel temperature is controlled as out- lined in the test procedure. Tests were conducted in a randomized complete block design (RCBD) to prove that the fuel sequence is not significant to the results of the study. Response variables were the following: net brake power (kW), torque (N-m), fuel consumption (L/h), NOx concentrations (ppm), unburned hydrocarbon concentra- tions (ppm), CO concentrations (ppm), and CO2 concen- trations (%). The BETA lab is equipped with a NI Labview pro- gram that can perform remote-based switching of fuel source. This provides changing of test fuels without turning off the engine. At each fuel change, the fuel filter was replaced and then the engine was warmed at idle speed on the new fuel for 15 minutes to purge remaining previous test fuel from the engine’s fuel system. Then, the engine was operated at full throttle and prepared for the next performance testing. Also, a new set of sintered filters for the exhaust emissions analyzer was installed prior to the next emissions testing. The important sources of uncertainty in this study are: 1) Supply of consistent quality of fuel; 2) proper con- trol over relevant engine parameters (e.g. speed and load); and 3) proper use and calibration of the measurement instruments. To minimize the first source of uncertainty, test fuels were processed in such a way that it will match up ASTM 6751 standard. Fresh batch of biodiesel was used to ensure consistency of the fuel quality in the ex- periment. The uncertainty associated with the second source was minimized by depending on the proper con- trol and use of engine instrumentation and controller equipment. Parameters, such as engine speed, fuel flow rate, and load accuracy were matched to within ±5 RPM, Open Access JSBS 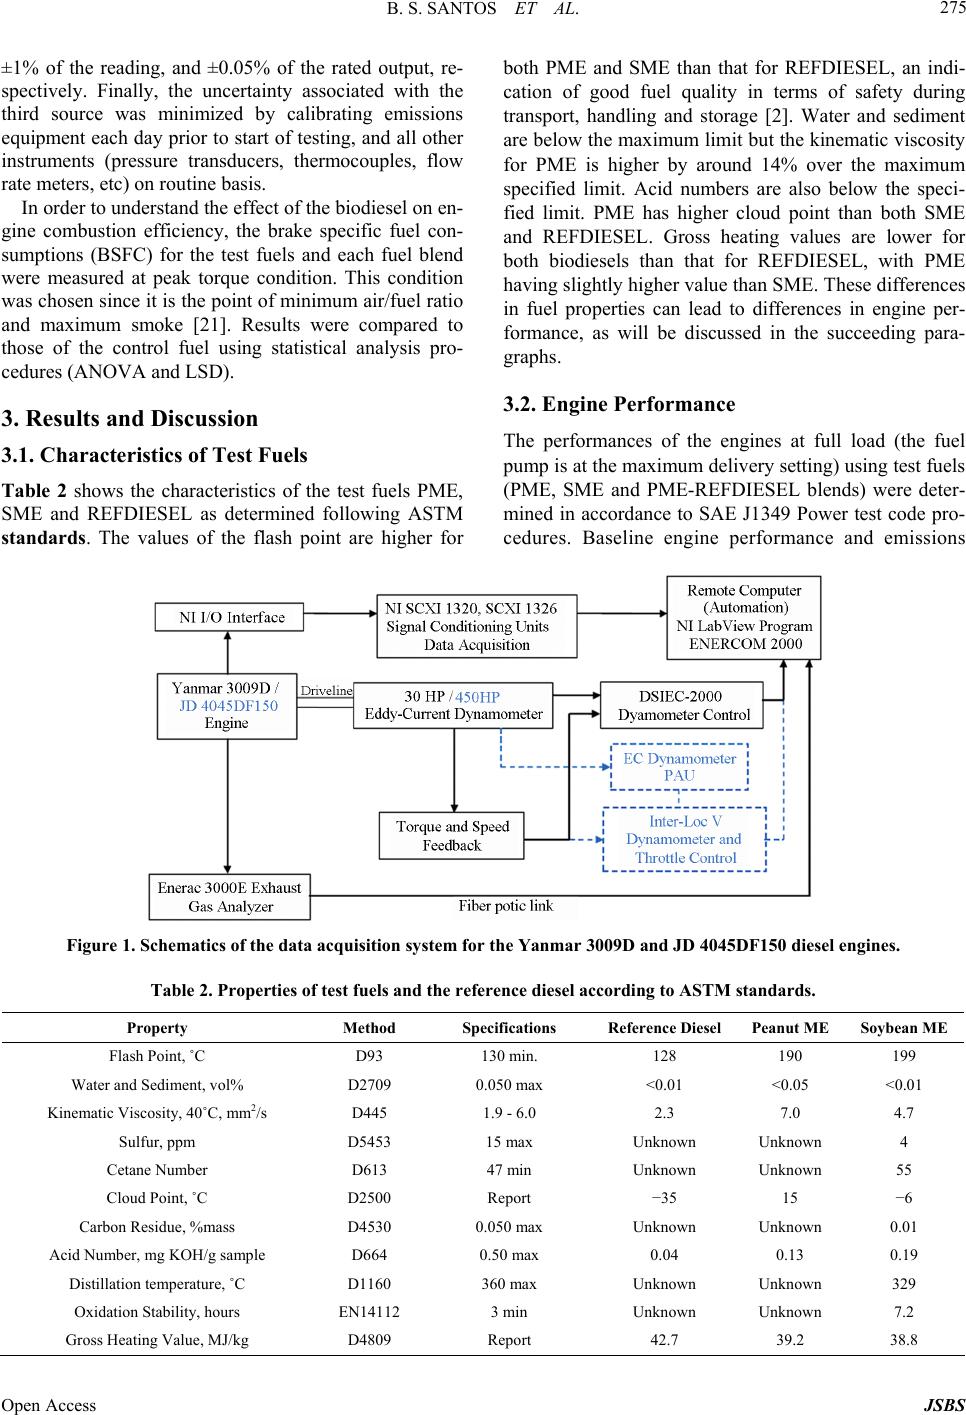 B. S. SANTOS ET AL. Open Access JSBS 275 ±1% of the reading, and ±0.05% of the rated output, re- spectively. Finally, the uncertainty associated with the third source was minimized by calibrating emissions equipment each day prior to start of testing, and all other instruments (pressure transducers, thermocouples, flow rate meters, etc) on routine basis. both PME and SME than that for REFDIESEL, an indi- cation of good fuel quality in terms of safety during transport, handling and storage [2]. Water and sediment are below the maximum limit but the kinematic viscosity for PME is higher by around 14% over the maximum specified limit. Acid numbers are also below the speci- fied limit. PME has higher cloud point than both SME and REFDIESEL. Gross heating values are lower for both biodiesels than that for REFDIESEL, with PME having slightly higher value than SME. These differences in fuel properties can lead to differences in engine per- formance, as will be discussed in the succeeding para- graphs. In order to understand the effect of the biodiesel on en- gine combustion efficiency, the brake specific fuel con- sumptions (BSFC) for the test fuels and each fuel blend were measured at peak torque condition. This condition was chosen since it is the point of minimum air/fuel ratio and maximum smoke [21]. Results were compared to those of the control fuel using statistical analysis pro- cedures (ANOVA and LSD). 3.2. Engine Performance 3. Results and Discussion The performances of the engines at full load (the fuel pump is at the maximum delivery setting) using test fuels (PME, SME and PME-REFDIESEL blends) were deter- mined in accordance to SAE J1349 Power test code pro- cedures. Baseline engine performance and emissions 3.1. Characteristics of Test Fuels Table 2 shows the characteristics of the test fuels PME, SME and REFDIESEL as determined following ASTM standards. The values of the flash point are higher for Figure 1. Schematics of the data acquisition system for the Yanmar 3009D and JD 4045DF150 diesel engines. Table 2. Properties of test fuels and the reference diesel according to ASTM standards. Property Method Specifications Reference Diesel Peanut ME Soybean ME Flash Point, ˚C D93 130 min. 128 190 199 Water and Sediment, vol% D2709 0.050 max <0.01 <0.05 <0.01 Kinematic Viscosity, 40˚C, mm2/s D445 1.9 - 6.0 2.3 7.0 4.7 Sulfur, ppm D5453 15 max Unknown Unknown 4 Cetane Number D613 47 min Unknown Unknown 55 Cloud Point, ˚C D2500 Report −35 15 −6 Carbon Residue, %mass D4530 0.050 max Unknown Unknown 0.01 Acid Number, mg KOH/g sample D664 0.50 max 0.04 0.13 0.19 Distillation temperature, ˚C D1160 360 max Unknown Unknown 329 Oxidation Stability, hours EN14112 3 min Unknown Unknown 7.2 Gross Heating Value, MJ/kg D4809 Report 42.7 39.2 38.8  B. S. SANTOS ET AL. 276 tests were performed using standard no. 2 ULSD fuel (REFDIESEL). Corrected values of the net brake power and brake-specific fuel consumption for ULSD, as de- scribed earlier, were also presented in the following sec- tions. 3.2.1. Net Brake Power 3.2.1.1. Small Engine The net brake power at different engine speeds and fuel blends during the operation of the 14.2-kW Yanmar 3009D engine is presented in Figure 2. At different en- gine speeds, there is an initial gradually increasing trend in power until a maximum is reached and then it falls rapidly as the engine speed is further increased (Figure 2(a)). Power decreases after a maximum is reached due to increase in friction at higher speeds. The net brake po- wer, as defined by the Society of Automotive Engineers [22], is a measure of the engine’s horsepower delivered directly to the engine’s crankshaft without the loss in po- wer caused by the accessories such as the gearbox, alter- nator, differential, water pump, and other auxiliary com- ponents such as power steering pump, muffled exhaust system, etc. (a) (b) Figure 2. Net brake power of the Yanmar engine at various (a) engine speeds and (b) PME-REFDIESEL fuel ble nds. Comparison of the engine brake power at different fuel blends shows that there is negligible power loss when using the different proportion of PME and REFDIESEL (Figure 2(b)). There was even a slight increase of around 2.3% for B100 PME to a net brake power of 13.8 kW. Several studies also observed a slight increase in po- wer; one of which is reported by Usta et al. [23], where the power slightly increased for the 5% sunflower oil biodiesel (SFME)-diesel blend but decreased by about 2% - 3% for the 30% blend. Also, Moreno et al. [19] showed no noticeable power loss when using 25, 50 and 75% blends of SFME and diesel, and even slightly gained around 3% for the 25% blend. However, when pure SFME was used, a slight loss was observed (~1.5%). Song and Zhang [24] also observed that the engine brake power and torque increased with the increase in biodiesel percentage in the blends. Finally, Al-Widyan et al. [25] found that the engine power was higher when using bio- diesel than diesel. The net brake power when using PME was also com- pared to that when using SME, as shown in Figure 3. SME followed a similar trend in net brake power at in- creasing engine speed. It also had similar value of net brake power with REFDIESEL (13.5 kW at engine speed of 2940 rpm) and thus, slightly lower than PME (13.8 kW). Some researchers explained that the increase in engine power when using biodiesel can be attributed to the higher viscosity of biodiesel, which enhances fuel spray penetration, and thus improves air-fuel mixing [26-28]. Also, the high lubricity of biodiesel might result in re- duced friction loss and thus improve the brake effective power, as was proposed by Ramadhas et al. [29]. 3.2.1.2. Large Engine For the 4-cylinder-80-hp John Deere engine, the net brake power at different engine speeds as shown in Fig- Figure 3. Net brake power of the Yanmar engine using PME, SME and REFDIESEL at varying engine spe ed. Open Access JSBS  B. S. SANTOS ET AL. 277 ure 4(a) follows the same trend as with the small engine. Comparison of the different fuel blends, however, showed that there was a slight loss of power for B5 PME com- pared to REFDIESEL (Figure 4(b)). B5 PME has 0.81% less power than REFDIESEL (55.7 kW). An improve- ment was also observed as the percentage of PME was increased to 50% peanut oil biodiesel and 50% diesel fuel. B50 PME obtained the highest peak power of 55.9 kW, which was 1% higher than REFDIESEL (not sig- nificant). However, this improvement gradually disap- pears as the percentage of PME in the blend was increas- ed to B100 PME. A slight loss in power was observed for B100 PME with 54.8 kW. The net brake power for of PME at different engine speeds in comparison with SME and REFDIESEL are also presented in Figure 5. The corrected peak net brake power using REFDIESEL was observed to be the highest compared to the biodiesel fuels, although the differences are not quite significant. Hence, PME yields as much as the same power as SME and REFDIESEL. 3.2.2. Engine Torque 3.2.2.1. Small Engine The engine torque at varying engine speed and fuel blends were also obtained and shown in Figure 6. The torque is a good indicator of an engine’s ability to do work and is a function of engine speed. Similar to engine power, the torque was gradually increasing at low speed and de- creased rapidly after a maximum value was reached. Tor- que decreases because the engine is unable to ingest a full charge of air at higher speeds [30]. There was a slight variation in peak torque values for PME-REFDIESEL blends compared to REFDIESEL. The peak torque values for B5, B50 and B100 fuel blends were higher than that for REFDIESEL. B20 PME obtained the least peak torque value with 47.37 N-m, while B50 PME obtained the highest with 49.9 N-m. 3.2.2.2. Large Engine The plots of peak torque values for the different fuel blends and engine speeds for the large John Deere engine are shown in Figure 7. The peak torque values for most of the PME blends increased by as much as 2%. Peak tor- que was measured from 287.1 N-m for B5 PME to 294.5 N-m for B50 PME at a speed of 800 rev/min. Torque va- lues for B20 PME and B100 PME were observed at 289.3 N-m and 289.8 N-m, respectively. The peak torque values in comparison with SME are presented in Figure 8 and indicate similar values for PME (289.8 N-m at 868.5 rpm) and SME (288.7 N-m at 854 rpm). A similar decrease in peak torque values as the en- gine speed increased was observed just as seen in the small engine performance study. (a) (b) Figure 4. Net brake power of the John Deere engine at var- ious (a) engine speeds and (b) PME-REFDIESEL fuel blends. Figure 5. Net brake power of the John Deere engine using PME, SME and REFDIESEL at varying engine spe ed. 3.2.3. Brake Specific Fuel Consumption (BSFC) 3.2.3.1. Small Engine The brake specific fuel consumption (BSFC) is a meas- ure of fuel efficiency within the crankshaft of an internal combustion engine and can be obtained by dividing the rate of fuel consumption of the engine by the net brake power [30]. Figure 9 shows the BSFC in relation to Open Access JSBS  B. S. SANTOS ET AL. Open Access JSBS 278 (a) (b) Figure 6. Engine torque of the Yanmar engine at various (a) engine speeds and (b) PME-REF DIESEL fue l blends. (a) (b) Figure 7. Engine torque of the John Deere engine at various (a) engine speeds and (b) PME-REFDIESEL fuel blends. Figure 8. Engine torque of the John Deere engine using PME, SME and REFDIESEL at varying engine spe ed. varying engine speed and fuel blends. The BSFC is shown to decrease with an increase in engine speed until it rea- ches a minimum value and further increases at higher speeds. Greater friction losses at higher speeds contribute to the increase in fuel consumption while at low speed, the longer time per cycle results in higher heat loss, al- lowing for more fuel consumption. At peak torque conditions, the BSFC was found to in- crease when using pure PME but has no significant dif- ference among the REFDIESEL, B5 and B20 fuel blends. REFDIESEL obtained a corrected brake-specific fuel consumption of 270.2 g/kW-h. An increase in BSFC was also observed by Moreno et al. [19], when they fueled a four-cylinder, turbocharged, indirect injected Isuzu en- gine with pure sunflower oil biodiesel. The BSFC in- creased by approximately 12% higher than with pure die- sel fuel. Kaplan et al also observed similar results [31]. Fuel consumption increases when using biodiesel due to its low heating value, as well as high density and viscos- ity as compared to a regular diesel [18]. The BSFC for PME was also compared with that for SME and REFDIESEL as presented in Figure 10 at dif- ferent engine speeds. At peak torque conditions, both B100 SME and B100 PME have higher BSFC than REFDIESEL at 14% and 9%, respectively. Statistical ana- lysis showed significant diffrences among the values, e  B. S. SANTOS ET AL. 279 (a) (b) Figure 9. Brake specific fuel consumption (BSFC) of the Yanmar engine at various (a) engine speeds and (b) PME-REFDIESEL fuel blends. Figure 10. BSFC of the Yanmar engine using PME, SME and REFDIESEL at varying engine speed. with SME having higher BSFC than PME. 3.2.3.2. Large Engine The trends in BSFC when running the large John Deere engine with different blends of PME and REFDIESEL and engine speeds are shown in Figure 11. Results showed that the BSFC increases as the percentage of PME in the mixture increases (Figure 11(b)). B50 PME obtained the highest BSFC with 325.3 g/kW-h, compared to only 248.8 g/kW-h for REFDIESEL. Comparison of PME with SME and REFDIESEL in Figure 12 shows that REFDIESEL obtained the lowest BSFC with a value of 248.78 g/kW-h. Statistical analysis showed that there is no strong evidence of difference between the BSFC of PME and SME. A 17.2% increase in BSFC was observed from SME compared to REF- DIESEL. Similar explanation as with the small engine can be applied in these observations. 3.2.4. Engine Performance Summary To summarize, PME delivered similar power and torque (a) (b) Figure 11. BSFC of the John Deere engine at various (a) engine speeds and (b) PME-REFDIESEL fue l blends. as compared with pure REFDIESEL and SME when used in both small and large engines. Power is a function of the engine geometry, speed, air/fuel ratio, efficiencies and fuel properties. Assuming mechanical losses are sim- ilar, and since there were no modifications made in Open Access JSBS  B. S. SANTOS ET AL. 280 Figure 12. BSFC of the John Deere engine using PME, SME and REFDIESEL at varying engine speed. the injection rates or duration for an individual test fuel, similar performance of PME with REFDIESEL may be attributed to the positive effects of its properties such as higher viscosity and lubricity. Moreover, the rise in mass flow for all biodiesel fuels as observed from both engines can be attributed to the lower heating values of the test fuels. The heating value affects the torque being produced and in order to match that torque with REFDIESEL, pure biodiesel and its blends with REFDIESEL will have to put more energy in the engine, resulting to higher fuel consumption. The BSFC at peak torque conditions for both engines were higher when using both PME and SME than the REF- DIESEL. 3.3. Exhaust Emissions Since the composition of the fuel affects the emissions of an engine, emissions from biodiesel fuel are also differ- ent as compared to those of petroleum diesel. Due to its higher oxygen content (~10 - 12 wt·%), biodiesel has less heating value and yields less particle emissions. Addi- tional advantage is the absence of sulfur in biodiesel, thus removing the typical aerosols derived from sulfuric acid formed during diesel fuel combustion. However, it should be noted that the results can also be affected by the type of engine and its condition [32]. Some of the EPA regulated emissions determined in this research were CO, CO2, NOx, SO2, and total hydrocarbons. 3.3.1. Small Engine Emissions The emission concentrations for PME and its blends at peak torque conditions are shown in Figure 13. The NOx concentration was found to increase as the percentage of PME biodiesel in a blend is increased, reaching as high as 30% when using pure PME (Figure 13(a)). The same was observed by many other researchers concerning the NOx emissions when using biodiesel. A maximum of 15% increase in NOx emissions for B100 was observed by Nabi et al. [33] at high load condition which was at- tributed to the 12% oxygen content of the B100 and higher gas temperature in combustion chamber. A greater increase in NOx emissions (22.1%) was observed by Ozsezen et al. [34] when they employed waste palm oil biodiesel on a 6-cylinder WC, NA, DI diesel engine while canola biodiesel produced NOx emissions higher than petrodiesel by 6.5%. The increase in NOx emissions could have been affected by the differences in the fuel properties between diesel and biodiesel. According to Moser et al. [35], the higher density and viscosity of the biodiesel imply that the differential pressure at the ad- vance piston contained in the distributor pump is slightly increased, which in turn advances injection. Also, the amount of fuel injected per cycle could also be affected by variations in density in the fuel. In addition, the fuel spray properties might also be modified due to increases in the size of the droplets of the fuel, thus affecting burning of the fuel [35]. The increase in NOx emissions could also be related to the higher oxygen content of bio- diesel, as it may provide additional oxygen for NOx for- mation [21]. For the CO2 emissions, as shown in Figure 13(d), REFDIESEL had the least CO2 concentration (7%) while PME has approximately 18% more emissions. Other re- searchers also report that the CO2 emissions increase when an engine is ran on biodiesel due to more efficient combustion [29,36-40]. Nevertheless, others reason out that this can be offset by planting and raising biodiesel crops as supported by life-cycle assessment of CO2 emis- sions from biodiesel [39,41]. About 50% - 80% reduction in CO2 emissions can be obtained when using biodiesel [42]. THC concentrations also increased by as much as 30% when B100 PME (14 ppm) was used as compared with REFDIESEL (10.78 ppm). However, there is no definite trend that can be seen for the fuel blends (Figure 13(c)). A similar increase in hydrocarbon emissions was observed by Munoz [32] at high engine speed and load. They ex- plained that hydrocarbon emissions increased since the higher density and viscosity of biodiesel changes the cha- racteristics of the fuel jet, i.e. size of droplets, penetration, etc., liberated by the injector. It also increases the amount of fuel retained in the interior of the injector nozzle, and therefore cannot be incorporated in the combustion cham- ber immediately, causing an increase in the hydrocarbons without burning. The CO concentration was found to decrease with an increase in the percentage of PME in the fuel blends (Figure 13(b)). A decrease of 29% in CO concentrations where observed as the mixture increase from 0 to 50% PME fuel. Similar decrease (around 30%) as compared to Open Access JSBS  B. S. SANTOS ET AL. Open Access JSBS 281 (a) (b) (c) (d) (e) Figure 13. Various exhaust emission concentrations using different PME-REFDIESEL fuel blends for the Yanmar diesel engine. petrodiesel was observed by Puhan et al. [43] when they used Mahua oil biodiesel. Utlu et al. [44] observed a 17.1% decrease when using waste frying oil biodiesel and Wu et al. [45] reports an average of 4% - 16% CO reduction for five biodiesels. The lower CO emissions can be attributed to the higher oxygen content of bio- diesel as compared to petrodiesel which promotes com- plete combustion and thus, reduction in CO emissions [40,46-48]. Finally, there were no noticeable increase in the SO2 concentrations produced using PME and its blends with REFDIESEL (Figure 13(e)). At peak torque conditions, the SO2 concentrations stayed below 10 ppm levels, a proof of the advantage of using biodiesel due to its low sulfur content as compared with petroleum diesel. The emissions of PME were also compared with those when using SME as shown in Figure 14. SME has Higher NOx concentrations than REFDIESEL while PME has clo- ser values, but still higher (Figure 14(a)). CO and CO2 concentrations tend to decrease as the engine speed in- creased and were relatively similar for both SME and PME (Figures 14(b) and (c)). REFDIESEL, as expected, has higher CO concentrations than the biodiesel fuels. Total hydrocarbon concentrations seemed to be not af- fected by the engine speed, but were slightly higher in SME than in PME emissions (Figure 14(d)). 3.3.2. Large Engine Emissions The emissions were also determined for the large John-Deere engine as shown in Figure 15. Similar to the observations in the small engine, the NOx concentration increased as the percentage of PME in the blend in- creased. The maximum increase was observed with B100 PME which has 18% highr NOx concentrations than e  B. S. SANTOS ET AL. 282 (a) (b) (c) (d) (e) Figure 14. Various emission concentrations of the Yanmar engine using PME, SME and REFDIESEL at varying engine speeds. REFDIESEL. CO2 and THC emissions have similar trends in that they were observed to increase with B5 PME but decreased when the percentage of PME in the fuel blend is increased. The trend in CO emissions, on the other hand, was found to be similar to that for the small engine. The lowest CO concentration was observed with B50 PME at 98 ppm, while B100 PME (8% higher than B50 PME) has 109 ppm of CO concentrations. Fi- Open Access JSBS  B. S. SANTOS ET AL. 283 (a) (b) (c) (d) (e) Figure 15. Various exhaust emission concentrations using different PME-REFDIESEL fuel blends for the John Deere diesel engine. nally, SO2 concentrations, yields no definite trend and did not seem to be affected by the changes in percentage of PME in the test fuel. Comparison of the emissions of PME with those of SME is also presented in Figures 16. Generally, NOx emissions tend to decrease as the speed of the engine is increased (Figure 16(a)). REFDIESEL obtained the low- est peak NOx concentrations with 454 ppm at 1203 rev/min and has slightly lower value than SME (522 ppm). PME has similar NOx emissions (521 ppm) with SME. CO2 concentrations were observed to gradually in- crease as the speed was increased up to a certain point (2050 rev/min) only and then decreased rapidly up to peak power conditions (Figure 16(b)). CO2 emissions were slightly higher for PME as compared with those of SME but lower than those of REFDIESEL at intermedi- ate engine speeds. CO and THC concentrations, on the other hand, tend to peak as they approach peak power conditions (Figures 16(c) and (d)). SME has higher THC concentrations than PME but lower CO concentrations. 3.3.3. Exhaust Emissions Summary Generally, NOx emissions were found to be higher when using pure biodiesel (PME) than with the reference diesel for both small and large engines. It also increases with the increase in the percentage of PME in the fuel blends. CO2 concentrations were also observed to increase in the small engine when using pure PME but decreased in the large engine. A notable increase in THC for the pure Open Access JSBS  B. S. SANTOS ET AL. 284 (a) (b) (c) (d) Figure 16. Various exhaust emissions of the John Deere engine using PME, SME and REFDIESEL at varying engine speed. PME in the small engine was observed while an increas- ing trend with an increase in PME in the blend was ob- served for the large engine. Similar trends in CO and SO2 emissions were observed in both small and large engines, with CO decreasing in concentration with the increase in PME in the blend and SO2 being lower than 10 ppm. Differences in exhaust emission concentrations in PME and PME-REFDIESEL blends were observed due to changes in properties such as density, viscosity and hea- ting values, as well as the composition of the fuel. These altogether affect the fuel injection characteristics and the mechanism of fuel burning, thus resulting in variation in emission concentrations of the EPA regulated pollutants. 4. Conclusion The engine performance and exhaust emissions were evaluated for a small and large engine operated on pure PME and its blends with a reference diesel. SME was also tested for comparison purposes. Results showed that comparable power and torque were delivered by both the small and large engines when ran on pure PME while BSFC was found to be higher as compared to the refer- ence diesel. Analyses of the exhaust emissions of the small engine when ran on pure PME showed higher NOx, CO2 and THC but lower CO emissions. The fuel blends at the lower end showed insignificant changes in the ex- haust emissions. The large engine also produced higher NOx emissions but lower CO2, CO and THC emissions when ran on pure PME. SO2 remained below 10 ppm and lower than that produced by the reference diesel. Based on these observations, biodiesel may be used as a sup- plemental fuel for steady-state non-road diesel engines. Using small percentage of fuel blends, such as B5 and B20, resulted in insignificant changes in peak power and BSFC as compared to that of pure diesel fuel. Hence, consumers may choose to use these blends in order to take advantage of the lubricity of biodiesel as well as contributing to the goal of lowering the dependence to petroleum diesel. 5. Acknowledgements We gratefully acknowledge the Houston Advanced Re- search Center (HARC) for financial support of this pro- ject. REFERENCES [1] Demirbas, “Progress and Recent Trends in Biodiesel Fuels,” Energy Conversion and Management, Vol. 50, No. 1, 2009, pp. 14-34. Open Access JSBS  B. S. SANTOS ET AL. 285 http://dx.doi.org/10.1016/j.enconman.2008.09.001 [2] A. E. Atabani, A. S. Silitonga, I. A. Badruddin, T. M. I. Mahalia, H. H. Masjuki and S. Mekhilef, “A Com- prehensive Review on Biodiesel as an Alternative Energy Resource and Its Characteristics,” Renewable and Sus- tainable Energy Reviews, Vol. 16, No. 4, 2012, pp. 2070- 2093. http://dx.doi.org/10.1016/j.rser.2012.01.003 [3] T. Nguyen, L. Do and D. A. Sabatini, “Biodiesel Pro- duction via Peanut Oil Extraction Using Diesel-Based Re- verse-Micellar Microemulsions,” Fuel, Vol. 89, No. 9, 2010, pp. 2285-2291. http://dx.doi.org/10.1016/j.fuel.2010.03.021 [4] M. Canacki and J. Van Gerpen, “Biodiesel Production from Oils and Fats with High Free Fatty Acids,” Tran- sactions of the ASAE, Vol. 44, No. 6, 2001, pp. 1429- 1436. [5] S. K. Hoekman, A. Broch, C. Robbins, E. Ceniceros and M. Natarajan, “Review of Biodiesel Composition, Pro- perties and Specifications,” Renewable and Sustainable Energy Review s, Vol. 16, No. 1, 2012, pp. 143-169. http://dx.doi.org/10.1016/j.rser.2011.07.143 [6] B. R. Moser, “Biodiesel Production, Properties, and Feed- stocks,” In vitro Cell Dev Biol-Plant, Vol. 45, No. 3, 2009, pp. 229-266. http://dx.doi.org/10.1007/s11627-009-9204-z [7] USDA, “US Bioenergy Statistics,” 2013. http://www.ers.usda.gov/data-products/us-bioenergy-stati stics.aspx [8] J. Hill, E. Nelson, D. Tilman, S. Polasky and D. Tiffany, “Environmental, Economic, and Energetic Costs and Be- nefits of Biodiesel and Ethanol Biofuels,” Proceedings of the National Academy Sciences of the United States of America, Vol. 103, No. 30, 2006, pp. 11206-11210. http://dx.doi.org/10.1073/pnas.0604600103 [9] G. Antolin, F. V. Tinaut, Y. Briceno, V. Castano, C. Perez and A. I. Ramirez, “Optimization of Biodiesel Production by Sunflower Oil Transesterification,” Bioresource Te- chnology, Vol. 83, No. 2, 2002, pp. 111-114. http://dx.doi.org/10.1016/S0960-8524(01)00200-0 [10] U. Rashid, F. Anwar, B. R. Moser and G. Knothe, “Mo- ringa Oleifera Oil: A Possible Source of Biodiesel,” Bio- resource Technology, Vol. 99, No. 7, 2008, pp. 8175- 8179. http://dx.doi.org/10.1016/j.biortech.2008.03.066 [11] Y. X. Xu and M. A. Hanna, “Synthesis and Charac- terization of Hazelnut-Oil Based Biodiesel,” Industrial Crops Products, Vol. 29, No. 2-3, 2009, pp. 473-479. http://dx.doi.org/10.1016/j.indcrop.2008.09.004 [12] W. M. J. Achten, L. Verchot, Y. J. Franken, E. Mathijs, V. P. Singh, R. Aerts and B. Muys, “Jatropha Bio-Diesel Production and Use,” Biomass Bioenergy, Vol. 32, No. 12, 2008, pp. 1063-1084. http://dx.doi.org/10.1016/j.biombioe.2008.03.003 [13] J. P. Davis, L. O. Dean, W. H. Faircloth and T. H. Sanders, “Physical and Chemical Characterizations of Normal and High-Oleic Oils from Nine Commercial Cultivars of Pea- nut,” Journal of the American Oil Chemists’ Society, Vol. 85, No. 3, 2008, pp. 235-243. http://dx.doi.org/10.1007/s11746-007-1190-x [14] A. Karmakar, S. Karmakar and S. Mukherjee, “Properties of Various Plants and Animals Feedstocks for Biodiesel Production,” Bioresource Technology, Vol. 101, No. 8, 2010, pp. 7201-7210. http://dx.doi.org/10.1016/j.biortech.2010.04.079 [15] National Agricultural Statistics Service (NASS), Agri- cultural Statistics Board, United States Department of Agriculture (USDA), “US Crop Production Data,” http://usda01.library.cornell.edu/usda/nass/CropProd//201 0s/2013/CropProd-01-11-2013.pdf [16] B. Moser, “Preparation of Fatty Acid Methyl Esters from Hazelnut, High-Oleic Peanut and Walnut Oils and Evaluation as Biodiesel,” Fuel, Vol. 92, No. 1, 2012, pp. 231-238. http://dx.doi.org/10.1016/j.fuel.2011.08.005 [17] C. Kaya, C. Hamamci, A. Baysal, O. Akba, S. Erdogan and A. Saydut, “Methyl Ester of Peanut (Arachis hypogea L.) Seed Oil as a Potential Feedstock for Biodiesel Produc- tion,” Renewable Energy, Vol. 34, 2009, No. 5, pp. 1257- 1260. http://dx.doi.org/10.1016/j.renene.2008.10.002 [18] J. Xue, T. E. Grift and A. C. Hansen, “Effect of Biodiesel on Engine Performances and Emissions,” Renewable and Sustainable Energy Reviews, Vol. 15, No. 2, 2011, pp. 1098-1116. http://dx.doi.org/10.1016/j.rser.2010.11.016 [19] F. Moreno, M. Muñoz and J. Morea-Roy, “Sunflower Methyl Ester as a Fuel for Automobile Diesel Engines,” Transactions of the American Society of Agricultural Engineers, Vol. 42, No. 5, 1999, pp. 1181-1185. [20] US EPA, “Control of Emissions of Air Pollution from Nonroad Diesel Engines and Fuel; Final Rule,” US EPA, Washington DC, 2004. [21] M. Canakci and J. H. Van Gerpen, “Comparison of En- gine Performance and Emissions for Petroleum Diesel Fuel, Yellow Grease Biodiesel, and Soybean Oil Bio- diesel,” Transactions of the American Society of Agri- cultural Engineers, Vol. 46, No. 4, 2003, pp. 937-944. [22] SAE Standards, “SAE J 1349: Engine Power Test Code- Spark Ignition and Compression Ignition—Net Power Rating,” SAE, Troy, 2008. [23] N. Usta, E. Ozturk, O. Can, E. S. Conkur, S. Nas and A. H. Con, “Combustion of Biodiesel Fuel Produced from Hazelnut Soapstock/Waste Sunflower Oil Mixture in a Diesel Engine,” Energy Conversion and Management, Vol. 46, No. 5, 2005, pp. 741-755. http://dx.doi.org/10.1016/j.enconman.2004.05.001 [24] J. T. Song and C. H. Zhang, “An Experimental Study on the Performance and Exhaust Emissions of a Diesel Engine Fuelled with Soybean Oil Methyl Ester,” Proceedings of the Institution of Mechanical Engineers Part D Journal of Automobile Engineering, Vol. 222, No. 12, 2008, pp. 2487-2496. [25] M. I. Al-Widyan, G. Tashtoush and M. Abu-Qudais., “Utilization of Ethyl Ester of Waste Vegetable Oils as Fuel in Diesel Engines,” Fuel Processing Technology, Vol. 76, No. 2, 2002, pp.91-103. http://dx.doi.org/10.1016/S0378-3820(02)00009-7 [26] B. F. Lin, J. H. Huang and D. Y. Huang D-Y, “Experi- mental Study of the Effects of Vegetable Oil Methyl Ester on DI Diesel Engine Performance Characteristics and Open Access JSBS  B. S. SANTOS ET AL. Open Access JSBS 286 Pollutant Emissions,” Fuel, Vol. 88, No. 9, 2009, pp. 1779-1785. http://dx.doi.org/10.1016/j.fuel.2009.04.006 [27] C. Oner and S. Altun, “Biodiesel Production from Inedible Animal Tallow and an Experimental Investigation of Its Use as Alternative Fuel in a Direct Injection Diesel En- gine,” Applied Energy, Vol. 86, No. 10, 2009, pp. 2114- 2120. http://dx.doi.org/10.1016/j.apenergy.2009.01.005 [28] A. Monyem, J. H. Van Gerpen and M. Canakci, “The Ef- fect of Timing and Oxidation on Emissions from Bio- diesel-Fueled Engines,” Transactions of the American Society of Agricultural Engineers, Vol. 44, No. 1, 2001, pp. 35-42. [29] A. S. Ramadhas, C. Muraleedharan and S. Jayaraj, “Performance and Emission Evaluation of a Diesel En- gine Fueled with Methyl Esters of Rubber Seed Oil,” Re- newable Energy, Vol. 30, No. 12, 2005, pp. 1789-1800. http://dx.doi.org/10.1016/j.renene.2005.01.009 [30] W. W. Pulkrabek, “Engineering Fundamentals of the In- ternal Combustion Engine,” 2nd edition, Pearson Prentice- Hall, Upper Saddle River, 2004. [31] C. Kaplan, R. Arslan and A. Sürmen, “Performance Cha- racteristics of Sunflower Methyl Esters as Biodiesel,” Energy Sources, Part A: Recovery, Utilization, and Envi- ronmental Effects, Vol. 28, No. 8, 2006, pp. 751-755. http://dx.doi.org/10.1080/009083190523415 [32] M. Muñoz, F. Moreno and J. Morea, “Emissions of an Automobile Diesel Engine Fueled with Sunflower Methyl Ester,” Transactions of the American Society of Agricul- tural Engineers, Vol. 47, No. 1, 2004, pp. 5-11. [33] M. N. Nabi, S. M. N. Hoque and M. S. Akhter, “Karanja (Pongamia pinnata) Biodiesel Production in Bangladesh, Characterization of Karanja Biodiesel and Its Effect on Diesel Emissions,” Fuel Processing Technology, Vol. 90, No. 9, 2009, pp. 1080-1086. http://dx.doi.org/10.1016/j.fuproc.2009.04.014 [34] A. N. Ozsezen, M. Canakci, A. Turkcan and C. Sayin, “Performance and Combustion Characteristics of a DI Diesel Engine Fueled with Waste Palm Oil and Canola Oil Methyl Esters,” Fuel, Vol. 88, No. 4, 2009, pp. 629- 636. http://dx.doi.org/10.1016/j.fuel.2008.09.023 [35] F. Moser, H. Schlogl and H. Wiesbauer, “Behaviour of Rape Seed Oil Methyl Ester Fueled Tractor Engines and Field Experience,” III’e Symposium, CEC: CTCM/EFTC, 1989. [36] Y. Ulusoy, Y. Tekin, M. Cetinkaya and F. Karao- smanoglu, “The Engine Tests of Biodiesel from Used Frying Oil,” Energy Sources, Vol. 26, No. 10, 2004, pp. 927-932. http://dx.doi.org/10.1080/00908310490473219 [37] G. Fontaras, G. Karavalakis, M. Kousoulidou, T. Tzam- kiozis, L. Ntziachristo, E. Bakeas, et al., “Effects of Biodiesel on Passenger Car Fuel Consumption, Regulated and Non-Regulated Pollutant Emissions over Legislated and Real-World Driving Cycles,” Fuel, Vol. 88, No. 9, 2009, pp. 1608-1617. http://dx.doi.org/10.1016/j.fuel.2009.02.011 [38] M. Canakci, “Performance and Emissions Characteristics of Biodiesel from Soybean Oil,” Proceedings of the Institution of Mechanical Engineers, Vol. 219, No. 7, 2005, pp. 915-922. [39] G. Labeckas and S. Slavinskas, “The Effect of Rapeseed Oil Methyl Ester on Direct Injection Diesel Engine Per- formance and Exhaust Emissions,” Energy Conversion and Management, Vol. 47, No. 13-14, 2006, pp. 1954- 1967.http://dx.doi.org/10.1016/j.enconman.2005.09.003 [40] S. Puhan, N. Vedaraman, G. Sankaranarayanan and R. B. V. Bharat, “Performance and Emission Study of Mahua Oil (Madhuca Indica Oil) Ethyl Ester in a 4-Stroke Natural Aspirated Direct Injection Diesel Engine,” Renewable Energy, Vol. 30, No. 8, 2005, pp. 1269-1278. http://dx.doi.org/10.1016/j.renene.2004.09.010 [41] P. K. Sahoo, L. M. Das, M. K. G. Babu and S. N. Naik, “Biodiesel Development from High Acid Value Polanga Seed Oil and Performance Evaluation in a CI Engine,” Fuel, Vol. 86, No. 3, 2007, pp. 448-454. http://dx.doi.org/10.1016/j.fuel.2006.07.025 [42] C. Carraretto, A. Macor, A. Mirandola, A. Stoppato and S. Tonon, “Biodiesel as Alternative Fuel: Experimental Ana- lysis and Energetic Evaluations,” Energy, Vol. 29, No. 12-15, 2004, pp. 2195-2211. http://dx.doi.org/10.1016/j.energy.2004.03.042 [43] S. Puhan, N. Vedaraman, B. V. B. Ram, G. Sankarna- rayanan and K. Jeychandran, “Mahua Oil (Madhuca In- dica Seed Oil) Methyl Ester as Biodiesel-Preparation and Emission Characterstics,” Biomass and Bioenergy, Vol. 28, No. 1, 2005, pp. 87-93. http://dx.doi.org/10.1016/j.biombioe.2004.06.002 [44] Z. Utlu and M. S. Kocak, “The Effect of Biodiesel Fuel Obtained from Waste Frying Oil on Direct Injection Diesel Engine Performance and Exhaust Emissions,” Renewable Energy, Vol. 33, No. 8, 2008, pp. 1936-1941. http://dx.doi.org/10.1016/j.renene.2007.10.006 [45] F. Wu, J. Wang, W. Chen and S. Shuai, “A Study on Emission Performance of a Diesel Engine Fueled with Five Typical Methyl Ester Biodiesels,” Atmospheric En- vironment, Vol. 43, No. 7, 2009, pp. 1481-1485. http://dx.doi.org/10.1016/j.atmosenv.2008.12.007 [46] H. Aydin and H. Bayindir, “Performance and Emission Analysis of Cottonseed Oil Methyl Ester in a Diesel Engine,” Renewable Energy, Vol. 35, No. 3, 2010, pp. 588-592. http://dx.doi.org/10.1016/j.renene.2009.08.009 [47] M. Karabektas, “The Effects of Turbocharger on the Performance and Exhaust Emissions of a Diesel Engine Fuelled with Biodiesel,” Renewable Energy, Vol. 34, No. 4, 2009, pp. 989-993. http://dx.doi.org/10.1016/j.renene.2008.08.010 [48] E. Buyukkaya, “Effects of Biodiesel on a DI Diesel En- gine Performance, Emission and Combustion Character- istics,” Fuel, Vol. 89, No. 10, 2010, pp. 3099-3105. http://dx.doi.org/10.1016/j.fuel.2010.05.034
|