F. FERDOS ET AL.
Open Access
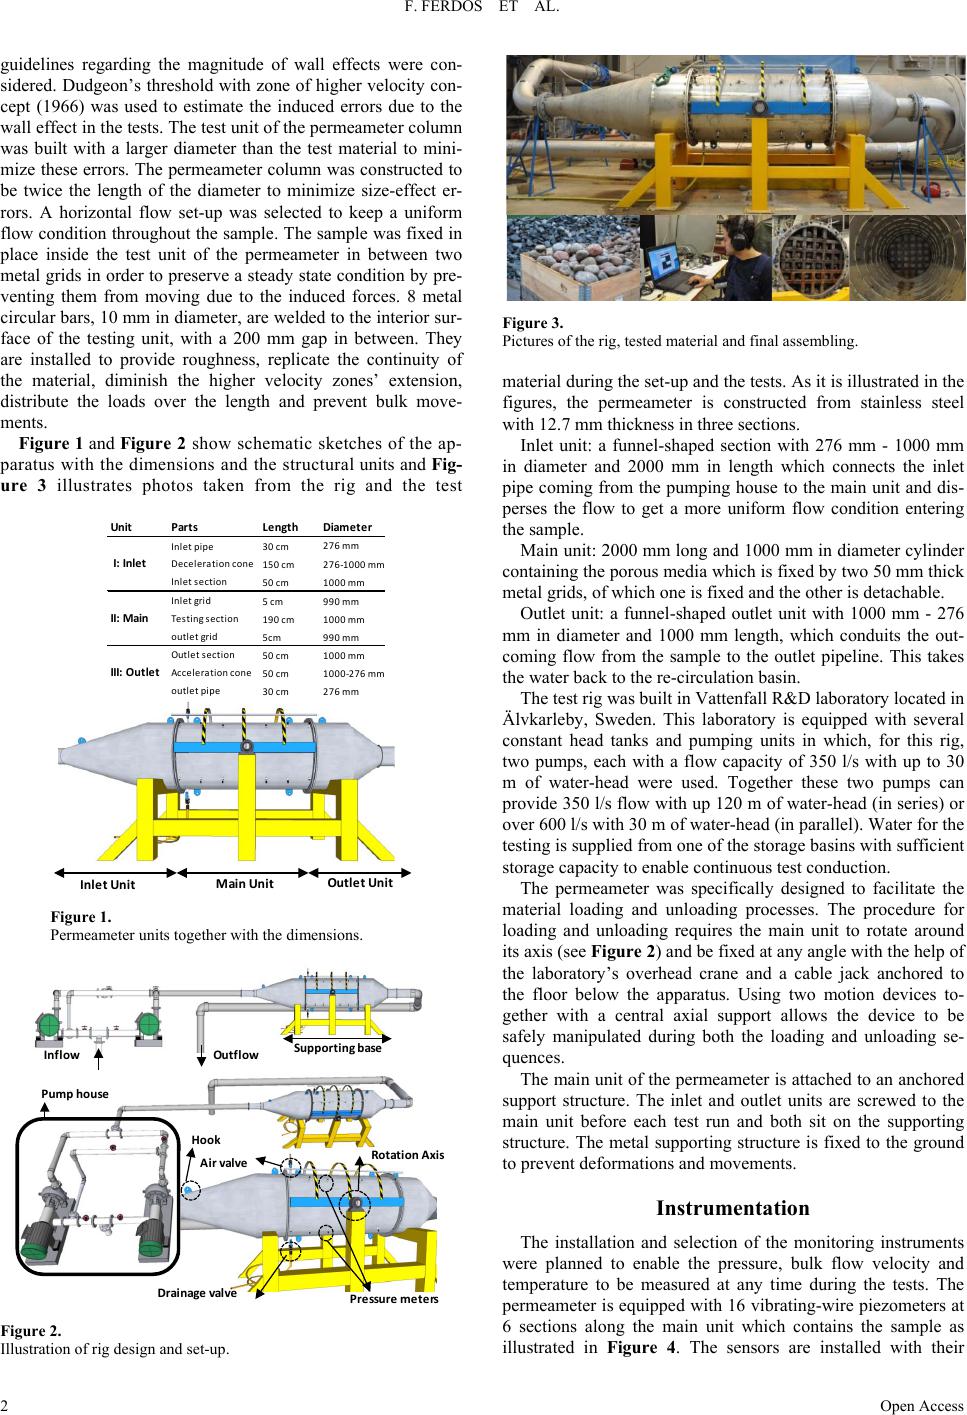
Figure 4.
Main unit with 16 p iezometers which are installed diagon ally in 6 sec-
tions.
heads concealed within the cylinder’s wall to protect them from
any damage during the loading and unloading processes. The
flow through the permeameter is measured with a magnetic
flow meter, installed upstream of the test rig, with are lative
accuracy of less than ±2%. The temperature is monitored with
an infrared thermometer. All the sensors were monitored and
their data were recorded using a computer-controlled data ac-
quisition system with half a second recording interval.
Operation
Each test takes approximately two days to complete, which
includes preparation and loading of a sample in accordance
with the safety regulations, running the pumping test and fi-
nally the unloading process. In the following section, the proce-
dure of each test run using the permeameter is described.
Loading and Unloading the Permeameter
The washed materials in pallet rims were driven into the
laboratory, using a pallet lift-truck. The inlet and outlet units of
the apparatus were detached by loosening the bolts from the
main unit. These units were then lifted by hooking them up to
the tower crane and moving them aside. Afterwards, an explic-
itly designed metal plate containing a valve is screwed to the
main unit. This metal plate enables the main unit to be filled
with water in a vertical position and the amount of water to be
measured, from which the active porosity of the sample if cal-
culated.
For each of the tests, the permeameter was tilted at an up-
ward angle of 20 degrees to start the filling process and gradu-
ally turned upwards to a vertical position with the help of two
cranes. It was filled by carefully loading the rocks one by one
into the main. Once filled, the mountable metal grid was lifted
by the tower crane, placed on top of the sample and fixed with
4 screws. The main unit was then filled with water until satura-
tion of the sample and then the volume of the water within the
main unit was measured by releasing the water from the valve
embedded on the metal plate. After the porosity measurement,
the main unit was again tilted approximately 45 degrees back-
wards, towards a horizontal position, and the metal plate was
then unscrewed from the main unit. Afterwards, the main unit
was tilted more to reach the horizontal position, the inlet and
outlet units were then lifted by the crane, mounted and screwed
to the main unit. Thick rubber bands together with special filler
pastes were used in the connections in order to seal them com-
pletely. The final preparation stages prior to the tests were to
connect the inlet and outlet units to the inlet and outlet pipes
and connect the instruments to their data-transferring and
power-supplying wires.
Upon completion of each test, the wires were detached, the
rig was drained using the drainage valve embedded in the bot-
tom of the rig and then the inlet and outlet units were un-
screwed. The main unit was then tilted to a vertical standing
position, the metal net was unscrewed and then lifted with the
help of the tower crane. The stones were then removed by hand
and the unit was tilted step by step until all the stones were
removed. The main unit of the permeameter was then lowered
to a horizontal position, inspected and cleaned for the next test.
The removed stones were then loaded onto the pallet rims once
again and driven away.
The following sections describe the detailed procedure used
for each test.
Pre-Test Procedure
Prior to all the tests, a procedure was performed with an
empty unit while the pumps, data-acquisition system and in-
strumentations were checked and calibrated. After each loading
and assembly of the apparatus, a 50 l/sec flow was introduced
and the trapped air released with the help of the air valve em-
bedded on top of the main unit. The connections were also in-
spected to ensure a proper sealing and secure connection.
Testing Proced ure
After the pre-test procedure, the flow was increased in 50 l/s
steps until reaching the maximum flow of 600 l/s in 12 steps.
Each flow increment was maintained for approximately 5 min.
to ensure a steady state condition was reached, where all the
instruments showed a constant reading with a constant fluctua-
tion interval for that step of the flow.
Material
Two material types in two size ranges were prepared and
used for the through-flow test. The material was sieved care-
fully to achieve a uniform size distribution (poor graded), en-
hancing the material grading that can represent what has been
used in existing hydraulic structures or could be used for poten-
tial projects. The results for these materials can even be used to
estimate the behaviour of material with slightly bigger grains
and maintain the geometric property criteria outlined by Sabin
and Hansen (1994).
Material char acteristi cs are present ed in Table 1.
Experimental Results
The measurements taking during the tests were interpreted
using the friction factor concept for packed columns to evalua te
energy dissipation through the tested material.
In order to be able to analyse the forces exerted by the flow-
ing fluid on the solid surfaces in a porous medium, there have
been two main approaches taken in order to develop expres-
sions for the friction factor and to assess energy losses. In the
first approach, the active porosity of the porous medium is used
and it is considered as a group of tangled conduits with varying
cross sections, in which this theory can be further developed by
using the concept of energy losses for a single straight pipe and
extending it to incorporate the complicated network of pipes
Sec 1: 2 sensors
Sec 2: 4 sensors
Sec 3: 2 sensors
Sec 4: 2 sensors
Sec 5: 4 sensors
Sec 6: 2 sensors