Journal of Environmental Protection
Vol. 3 No. 1 (2012) , Article ID: 16866 , 15 pages DOI:10.4236/jep.2012.31004
Assessment of Impacts and Risks of Air Pollution Applying Two Strategies of Numerical Chemistry Transport Modelling
![]()
1Rhenish Institute for Environmental Research, University of Cologne (RIU), Cologne, Germany; 2Laboratory of Atmospheric Physics, Aristotle University of Thessaloniki, Thessaloniki, Greece; 3Institute of Geophysics, Bulgarian Academy of Sciences, Sofia, Bulgaria; 4Institute of Energy, Water and Environment, Polytechnic University of Tirana, Tirana, Albania; 5National Meteorological Administration, Bucharest, Romania.
Email: eb@eurad.uni-koeln.de
Received October 26th, 2011; revised November 29th, 2011; accepted December 29th, 2011
Keywords: Air pollution; chemical transport modeling; risk; accidental release; emergency; BALKAN model system; EURAD model system
ABSTRACT
Assessment of harmful impacts and risks of air pollution in case of accidents as well as of long lasting exposition is an important challenge of chemical transport modeling. Sad confirmation of this statement unexpectedly has come from the nuclear power plant accident in Fukushima which occurred while this paper was finalized. Two strategies to comply with the task of impact and risk assessment in extended regions like Central Europe or the Balkans are described. The first one is characterized by application of a single model system to an extended domain. The other one is based on the combined application of several chemical transport models designed for the use in various sub-domains in the region under consideration. Advantages and disadvantages exist for both approaches. For instance, the single model strategy allows unified and harmonized assessment of risks in a larger region, whereas the combined model strategy may provide faster and locally more specific response in emergency cases. The single model approach is treated exploiting applications of the EURAD model system. The combined model approach is a novel way of joint use of chemical transport model systems developed for the Balkans. The models are described and the accuracy of simulations carried out with them is briefly demonstrated by comparison of simulated and observed concentrations of air pollutants. Applications regarding the search of sources for high pollution events and the assessment of risks through known sources are exemplarily discussed.
1. Introduction
Air quality is subjected to a manifold of threats which may result in adverse impacts on human health, agriculture and ecosystems. Growing awareness of an endangered atmospheric environment has led to growing activity of controlling and predicting air quality worldwide.
The most effective tools for this purpose are monitoring networks and air quality modeling systems with forecast abilities [1]. This paper is devoted to the discussion of two different strategies of treating the problem by advanced simulation of chemical transport in the lower troposphere. The aim of model application to regions, where harmful impacts of air pollution are found, are contributions to air quality control, assessment of mitigation measures and specifically risk analysis and treatment of emergency situations.
The recent demolition of the nuclear power plant in Fukushima, Japan, as a consequence of an extremely strong earthquake and an unexpectedly intense tsunami, which resulted in highly radioactive emissions, is reminding us of the urgency and importance of application of chemistry transport models to emergency simulations and risk assessment. We would rather have missed this motivation of our work. The radioactive emissions have been spread from the damaged reactors in Fukushima by atmospheric transport over large parts of the northern hemisphere and possibly over the southern one, too. One of the models described in this paper and applied in its hemispheric version tried to catch this effect with simulations which, of course, had to be preliminary due to the lack of reliable emission data from the Fukushima plant during a longer period after the event (see http://www. eurad.uni-koeln.de/).
The two strategies of emergency modeling and risk assessment discussed in the following sections are 1) the application of a single model to a large domain (Central Europe and sub-regions in this case) and 2) the combination of several models developed for smaller differing domains in unified form and their application to the integral domain (the Balkans in this case). The comparison of both strategies has been motivated by a project devoted to the development of a modeling system for emergency response to the release of harmful substances with contributions from Albania, Bulgaria, Greece and Romania ([2]; see also www.nato.int/ science/ index. html), which has been accompanied by comparative studies based on the European Air Pollution Dispersion Model (EURAD [3]).
We will briefly outline the basic features of both simulation systems with emphasis on the combination of the BALKAN models and approaches to their unification. This appears to be the most interesting part in the framework of the development of an efficient emergency and risk assessment tool. In addition to the technical part of this study two examples of risk assessment, one for each model system, will be given. Deeper insight into the performance of the models and application issues will be given in a follow-up paper.
2. Models and Input Data
2.1. General Remarks
The fundamental relationship governing chemistry and transport in the atmosphere is the mass balance or continuity equation for minor species emitted and mixed into the air (primary pollutants) or generated by chemical transformation of such species (secondary pollutants). The equation describing the change of the concentration Ci of species i with time t may be written as
 (1)
(1)
with Pi and Li the chemical production and loss, respectively, and Ei the emission of the species by sources in the atmospheric medium (e.g. cars, stacks, airplanes). K represents the eddy diffusivity matrix and v three-dimensional wind vector. If particulate matter is included in the air quality simulations special modules are needed for the treatment of the production and loss term in (1) which also take into account aerosol dynamics [4,5]. Equation (1) can only be solved numerically if not drastic simplifications are introduced as in (3). Regional numerical models require boundary conditions for the flux of matter into and out of the model domain. For the lower boundary, the earth surface, the vertical flux Ftotal is given by emissions from various sources (diffusive anthropogenic emissions, biogenic emissions, outgassing of soil etc., Fem) and dry and wet deposition (Fdep):
 (2)
(2)
The Gaussian plume model for a stationary point source is an analytical solution of (1) assuming constant meteorological conditions amongst other simplifications [6,7]. We briefly describe the basic concept of the plume model, since this is the origin of the so-called Inpuff model [8,9] used as near-source algorithm in the BALKAN system. The formula of the plume model reads
 (3)
(3)
with concentration C depending on horizontal coordinates x, y and the height z, h height of the point source, u wind in x-direction at height h, σy and σz standard deviation of the concentration distribution in the y and z direction, respectively. The standard deviations depend on the distance x from the source with position (0, 0, h). Modifications of the Gaussian dispersion model have been developed for application to intermittent emissions or puffs. They are an important tool for near source assessment of toxic gas concentrations in the case of short-term emissions during an accident, e.g. an explosion in a chemical plant. For the sake of brevity this issue will not further be discussed in this paper. For additional reading one may refer to [10].
CTMs need meteorological and emission data as input. Wind, temperature, pressure, humidity and other meteorological parameters have to be provided by meteorological models if, as in our case, emergency modeling is the aim of model application. Emissions are provided by inventories for the simulation of background air pollution. The EMEP/EEA inventory [11] provides anthropogenic emissions for Europe. Specific inventories with higher resolution have been prepared for various European subdomains. Natural emissions are estimated from land use data in dependence on meteorological conditions. Thus the general model system is made up by a CTM, supported by a meteorological and an emission model. Initial and boundary conditions for dynamical and chemical calculations can be derived from larger-scale, e.g. global, models and analyses and in the case of CTMs, from climatology if modeled and/or analyzed data are not available.
In principle, each model has its own ways to handle input data for vertical and horizontal boundary conditions and may have different sources of input data (e.g. for meteorological parameters and emissions). It usually has to adjust emissions of volatile organic compounds given by available inventories to its chemical mechanism in specific ways. This, of course, may provoke special efforts for unification of an ensemble of models, as it is evident for the combination of models listed in Table 1.
We will briefly call the system of combined and unified models for the Balkans the BALKAN model system (or just BALKAN system) in this study. Whereas the primary objective of the development of the EURAD system was regional air quality analysis, assessment and forecast with the potential of application to emergency events, the design of the BALKAN system has inversely been aiming at fast treatment of for emergency cases with the potential of background regional air quality analysis and assessment. It is an effort towards joint multi-national risk management for more reliable and efficient treatment of transboundary effects of accidents and better disaster prevention in a multi-national region.
2.2. EURAD Model System
In the EURAD model system meteorological fields were generated by the meso-scale meteorological model MM5 [12], which then has been replaced by WRF [13] recently. Transport is simulated within the chemical transport model (EURAD-CTM) by solving the 3-D advection and diffusion equation (1). In height the model extends from the ground up to 100 hPa in its standard version with 16 or 23 levels. Gas-Phase chemistry is usually handled by the Regional Atmospheric Chemistry Mechanism (RACM [14]). For specific applications special versions of RACM are available, e.g. RACM-MIM for improved treatment of biogenic emissions [15]. A resistance model is employed for estimating dry deposition. Cloud processes are parameterized following [16]. For the simulation of particulate matter the sub-model MADE (Modal Aerosol Model for Europe) has been developed and applied with an extension called SORGAM (Secondary Organic Aerosol Model),) to account for the formation of secondary organic aerosols from biogenic and anthropogenic gaseous precursors. MADE simulates size resolved concentrations of secondary inorganic species ( ,
, ,
, ), and primary (EC, OC, unidentified particulate matter) aerosol species [4,17]. It contains temperature dependent reaction coefficients for particle formation and growth [18]. SORGAM is treating biogenic and anthropogenic secondary organics (BSOA, ASOA) [5]. The chemical interaction with cloud droplets is an important process and has been included in the aerosol sub-model. The near-surface concentrations of PM10 as well as gaseous air pollutants (e.g.: NO2, NOx, SO2, CO, ozone) relevant for impact and risk assessment can easily be analyzed by employing the model output which is stored on an hourly basis.
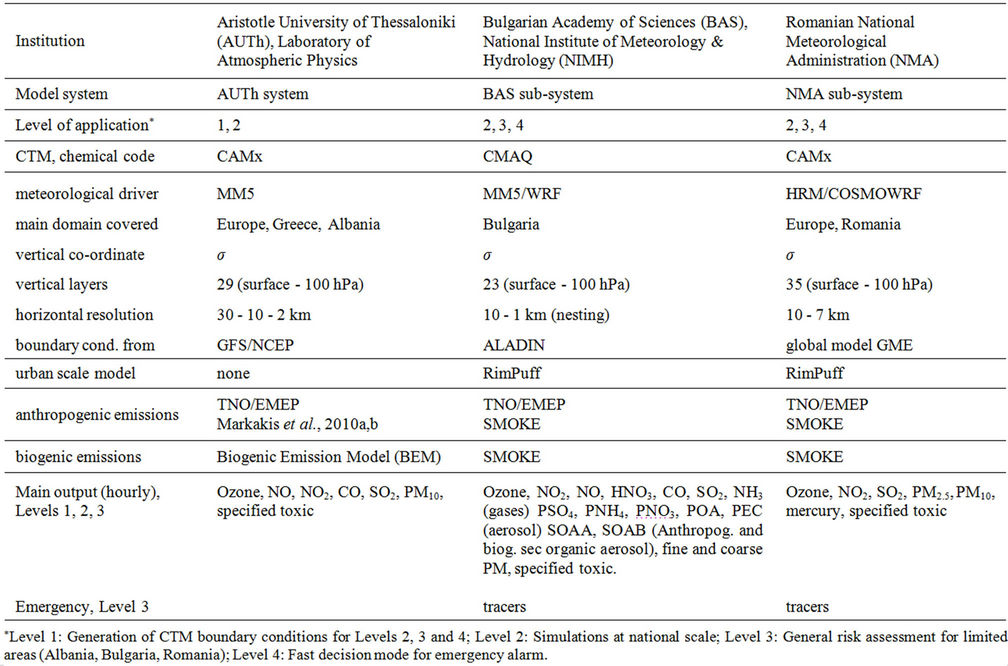
Table 1. Components of the BALKAN system for regional modeling of air pollution emergency events and risk.
The system allows sequential nesting which is needed for reliable definition of initial and boundary values on smaller scales. Carrying out nesting or zooming calculations with the EURAD system the largest model domain is chosen in a way that the boundaries are positioned in areas which are not heavily polluted and where reasonable climatologic estimates for the initial and boundary values can be applied.
Topographic data of the USGS data bases with resolution of about 500 m are employed. Land use data as provided by Smiatek (IfU at FZ Karlsruhe; personal communication) have been implemented. Meteorological initial and boundary values for the largest domain are derived from ECMWF analyses. EMEP data of gaseous anthropogenic emissions are used for large and medium region simulations. Local scale calculations are based on local emission inventories as, for instance, provided by the State Environmental Agency of North-Rhine Westphalia [19]. Emission data for particulate matter as available from the Netherlands Organization for Applied Scientific Research (TNO) has been applied. Biogenic emissions are separately parameterized with the help of land use data, radiation and temperature as calculated by the EURAD system. Model output is usually provided in time steps of 1 hour.
2.3. BALKAN Model System
The components of the BALKAN system have independently been developed in the partner countries, but are applied in a coordinated manner for the treatment of emergency cases and the assessment of risks. They are compiled in Table 1. One may discern four levels or modes of the system: 1) a background mode dealing with air chemistry background conditions in a larger region containing the partner countries; 2) simulations at national scale, providing chemical background for Level 3; 3) a general risk assessment level for limited areas, comprising the modeling systems existing and further developed in Romania (National Meteorological Administration) and Bulgaria (Geophysical Institute of the Bulgarian Academy of Sciences, Department of Atmospheric Physics) and to be implemented later in Albania (IEWE, PTU Albania), 4) a fast decision mode for immediate response to accidents which is using the same model ensemble as Level 3). For near source treatment of toxic emissions the Inpuff model (see Section 2.1) is applied.
2.3.1. Background—The Auth System
The Level 1 mode is generating unified atmospheric composition input as boundary conditions for the national model systems (here addressed as sub-systems) and is made up by the operational chemical weather forecast system (AUTh CWFS) of the Greek partner, the Laboratory of Atmospheric Physics, Aristotle University of Thessaloniki (AUTh) [27-31]. It is able to provide nested domain calculations for countries like Greece or, in the framework of the Balkan project, Albania. The horizontal resolution of air quality simulations for European, Balkan and city scale (Athens, Thessaloniki) is 30, 10 and 2 km, respectively. CWFS is run once a day producing 3-day pollution forecasts. The system consists of the prognostic meteorological meso-scale model MM5 [12] and the Comprehensive Air quality Model with extensions (CAMx [21]). Two examples of air quality forecast maps for the Balkan Peninsula are presented in Figure 1.
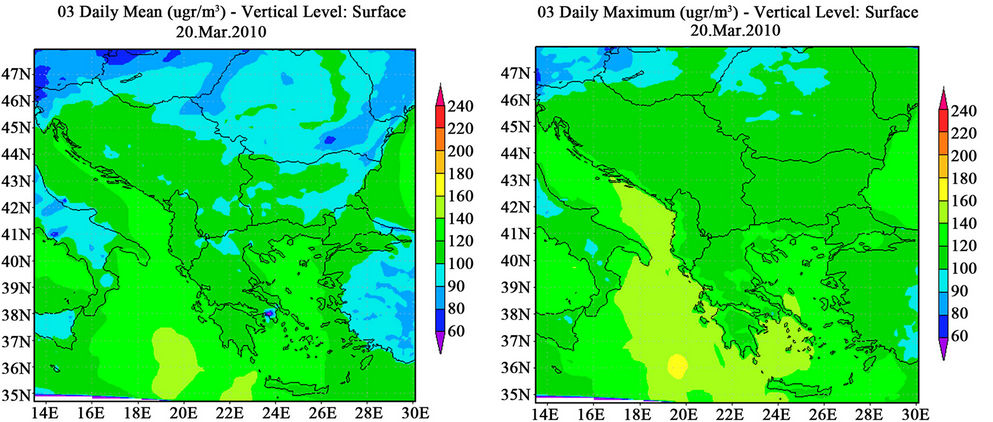
Figure 1. Forecast maps (20 March 2010) for ozone in the Balkan Peninsula produced by the AUTh air quality forecast modeling system.
The anthropogenic emission data, used as CAMx input data, are gridded hourly emission rates of gaseous pollutants (NOx, SO2, NMVOCs, CH4, NH3, CO) and particulate matter (PM10). Annual anthropogenic emission data of gaseous pollutants and particulate matter provided by TNO (Netherlands Organization for Applied Scientific Research [22]) were used. The emission inventory was prepared for the “Global and Regional Earth-System Monitoring using Satellite and in-situ data” project (GEMS project [23]) in order to account for the emissions from all anthropogenic emission sources in the European territory as well as in a part of West Asia in a grid spacing of 1/8 by 1/16 degrees. The annual emission data were temporally disaggregated (seasonal, weekly and diurnal temporal profiles) according to [24]. A detailed emission inventory developed for Greece, Athens and Thessaloniki [25,26] and ship emissions data from the EMEP database are also used in forecast runs. A Biogenic Emission Model has been integrated in the forecast system and is used for the calculation of spatially and temporally resolved biogenic NMVOCs emissions [27,32,33]. The model allows the calculation of isoprene “synthesis” emissions, of monoterpenes “pool” and “synthesis” emissions and of other volatile organic compounds (OVOCs) “pool” emissions on the basis of: 1) the U.S. Geological Survey 1km resolution Eurasia Land Cover Characteristics land use database (version 2), 2) a land-use specific, monthly isoprene, monoterpenes and other volatile organic compounds (OVOCs) emission potentials and foliar biomass densities database and 3) temperature and solar radiation data provided by the mesoscale meteorological model MM5.
Over the European region MM5 is forced by the 12:00 UTC GFS/NCEP global forecast of 1-degree spatial resolution. The global chemistry transport model MOZART-IFS [34] is used to provide the CAMx boundary conditions. The gaseous chemical mechanism used in CAMx runs is the Carbon Bond Mechanism version 4 (CBM-IV) with isoprene chemistry based on [35]. In addition, CAMx features air quality with detailed algorithms for the atmospheric processes, including aqueous chemistry (RADM-AQ [36]), inorganic aerosol thermodynamics/partitioning (ISORROPIA [37,38]), and secondary organic aerosol formation/partitioning (SOAP [39]). CAMx is run with a static two-mode coarse/fine scheme for the particle size distribution. Figure 1 shows the daily mean (left panel) and the daily maximum (right panel) of ozone forecasted by the model for 20 March 2010 as an example.
2.3.2. Risk Assessment Level—The BAS and NMA Sub-Systems
As regards the risk assessment level, i.e. Level 2 of the combined and envisaged unified system, the Bulgarian component (briefly BAS sub-system) is employing Models-3 (www.epa.gov/AMD/CMAQ/) containing the Community Multiscale Air Quality system (CMAQ [40,41]) for photo-chemical calculations and therefore needs to adjust the level CAMx data from the AUTh to the specifications of this mechanism in order to generate suitable boundary values. CMAQ is driven by meteorology generated by MM5 for the Bulgarian domain nested into the larger domain of CWFS comprising all Balkan and neighboring areas (Figure 2). Anthropogenic and bi genic emissions are treated and adjusted to CMAQ by SMOKE (Sparse Matrix Operator Kernel Emissions Modeling System, www. cmascenter.org/index.cfm? temp_id =99999 & model = smoke). Figure 3 shows the way how specific regions are zoomed by sequential nesting. It also exhibits the position of the main sources of potential accidental releases (hot spots) in Bulgaria.
The Romanian component of Level 2 has been derived from the Air Pollution Forecasting System of the National Meteorological Administration (NMA) and is briefly addressed as NMA sub-system in this paper. It is based on the regional meteorological High Resolution Model (HRM) of the German Weather Service, the Weather Research and Forecast Model (WRF [13]) and CAMx.
2.3.3. Fast Decision Mode
Level 3, the fast decision mode, employs the same subsystems of BAS and NMA as Level 2. It is completed by the InPuff model as a near source model needed for emergency events. The gaseous toxics treated in the case of an accident depend, of course, on the product characteristics of the source. For this kind of application fast computational support is mandatory. An important feature of the design of the BALKAN system was therefore the
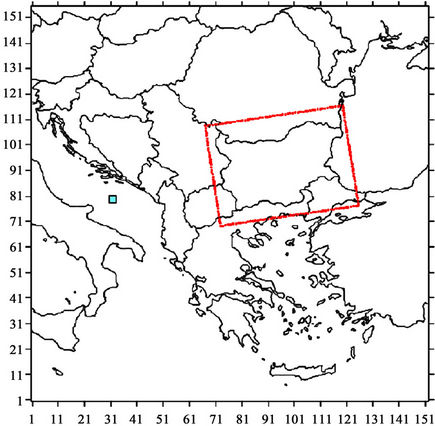
Figure 2. Bulgarian model domain nested into the CWFS domain.
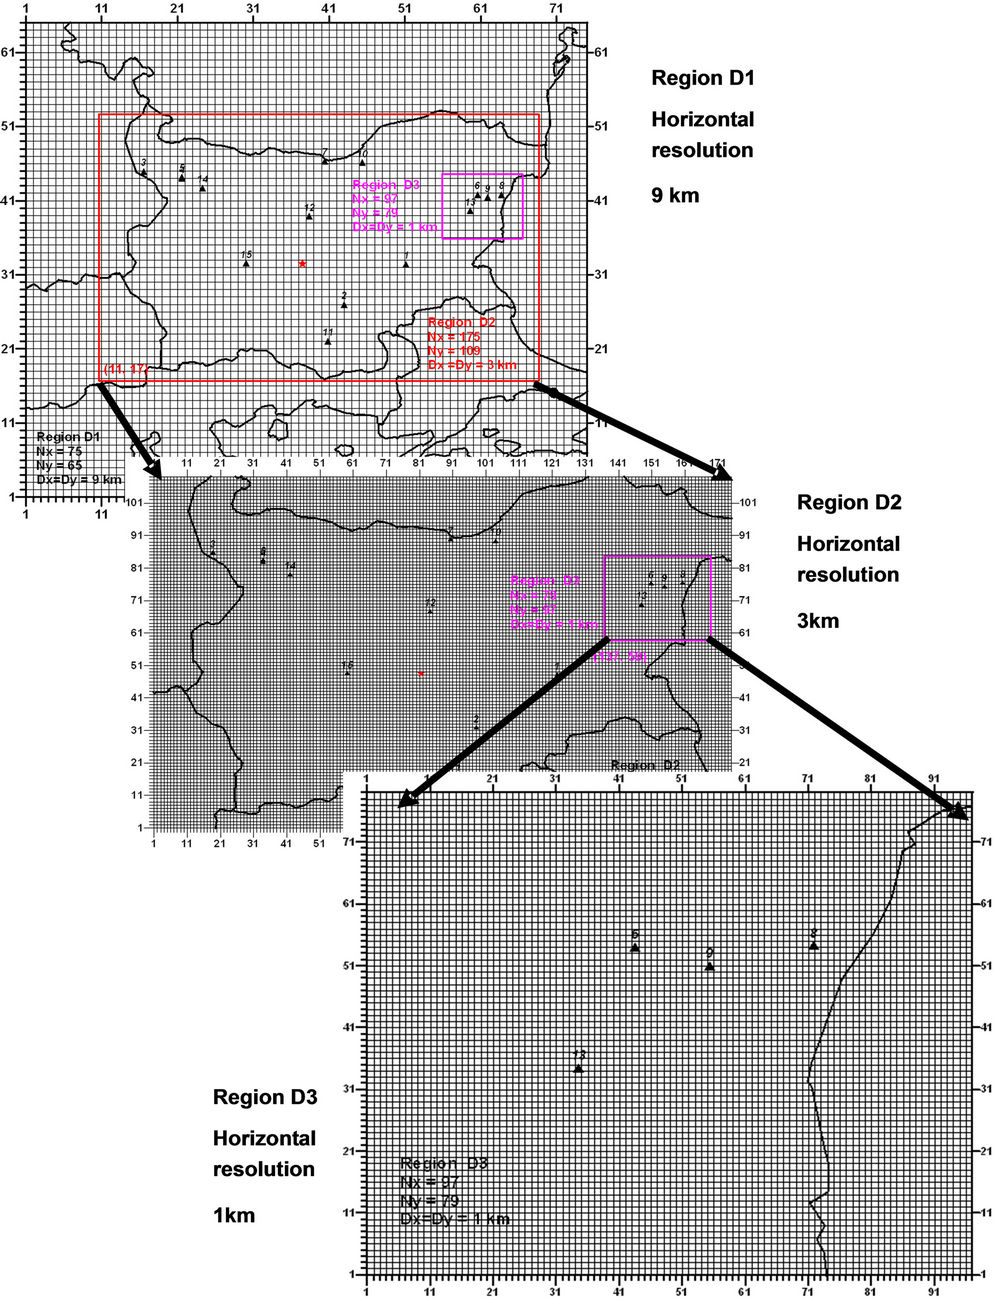
Figure 3. Main potential sources of accidental releases in Bulgaria (black triangles) and the Bulgarian system of nested domains.
setup of efficient computational systems (clusters) at the participating institutions for emergency alarm calculations. This significant technical aspect of the project is not further discussed in this paper.
3. Model Evaluation
All models used in this study are subjected to extensive evaluation procedures. As regards the EURAD model it has been applied to daily air quality forecasts. In this context regular checks are carried out by means of scatter plots as well as bias and RMSE estimates. Two examples of scatter plots are exhibited in Figure 4. PM10 and NO2 daily averages are compared with observations in 2006 from the monitoring network of North Rhine-Westphalia (so-called LUQS stations). The dashed lines indicate the factor of 2 deviation of observation and calculation. Colors indicate different seasons. It is evident that the model accuracy systematically depends on the season. Nevertheless, regular evaluation has shown that the model is well suited for air quality assessment studies. For more information about the performance of the model the reader is referred to the results shown on the EURAD website (www.eurad.uni-koeln.de [20]). The Bulgarian and Romanian components of the BALKAN system are evaluated in a similar way. Evaluation results of the BAS and NMA system will be presented in the follow-up paper about the application of the combined unified system. Here we confine ourselves to an example of statistical evaluations of EURAD simulations and an example of more detailed evaluation of the AUTH MM5-CAMx system.
The evaluation of the Auth system is carried out by comparing simulated ozone concentrations with observations from EMEP stations. Results for the year 2003 (hind cast mode) are shown here. The model was run without nested grids. Figure 5 shows the Taylor plot of the daily surface ozone concentrations simulated by MM5-CAMx over the network of the EMEP stations. A Taylor diagram characterizes the statistical relationship between the observed and the forecasted ozone concentrations quantified in terms of their correlation (R), their root mean square error (RMSE), their amplitude of variation (ratio of modeled over observed standard deviation, i.e. normalized standard deviation) and the skill score of the simulation. As shown in Figure 5 the normalized standard deviations are ranging between 0.8 and 1.2 for the majority of the EMEP stations meaning that the modeled values and the observations have comparable amplitudes of variation (moderately underor overestimated by the modeling system). Correlation coefficients mostly vary between 0.6 - 0.8 and the maximum R is found to be 0.88. The skill score is decreasing with increasing unbiased RMSE.
The seasonal variation of the correlation coefficient, the root mean square error and the mean bias for the daily ozone concentrations at the locations of the EMEP stations is shown in Figure 6. All statistical measures demonstrate better skill as we move from the cold to the warm season. The inter-quartile range reaches the maximum in the summer indicating that there might be meteorological processes (e.g., heat wave) and chemical processes (e.g. absent biomass burning emissions) that were not resolved successfully by the model in its current configuration.
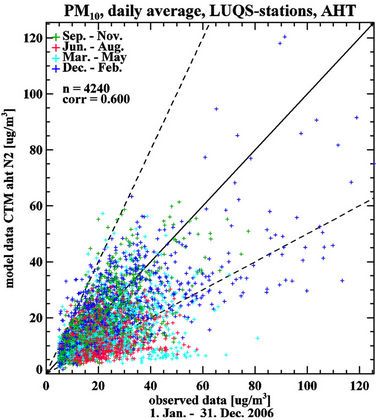
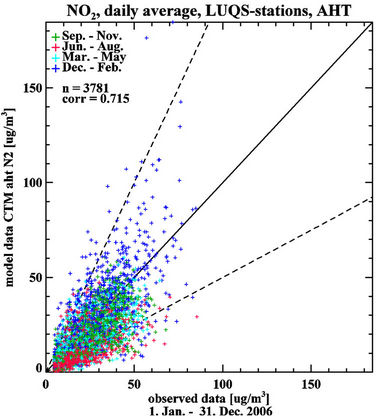
Figure 4. Scatter diagrams for PM10 (left panel) and NO2 concentrations (right panel) comparing observed and calculated daily averages in μg/m³. Simulation with the EURAD model system, measurements from the North Rhine-Westphalia monitoring network (LUQS), 1 January-31 December 2006. Colors: dark blue December-February, light blue March-May, red June-August, green September-November.
Figure 5. Taylor plot of the daily surface ozone simulated by MM5-CAMx over the network of EMEP stations in 2003. Colors indicate the RMSE in ppbV. Normal standard deviation (σn), correlation coefficients and skill score of simulation are indicated by the dotted circles, straight lines and continuous lines, respectively.
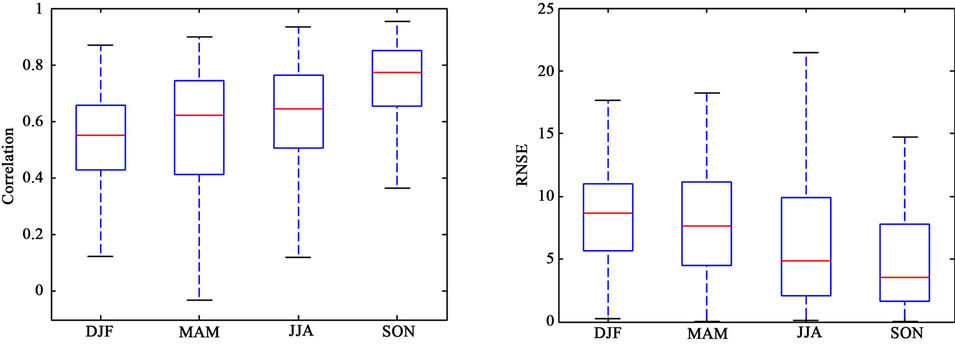
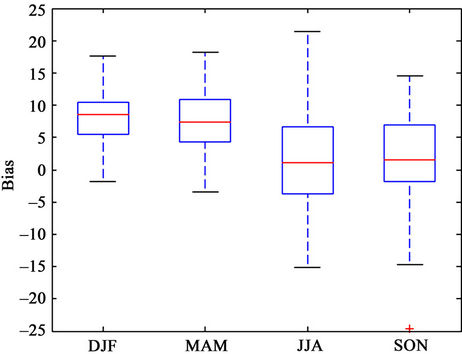
Figure 6. The seasonal variation of the correlation coefficient (upper left panel), the root mean square error (upper right panel) and the mean bias (lower panel) for daily values of ozone concentration (ppbV) in 2003 at the EMEP stations in the Auth CWFS domain.
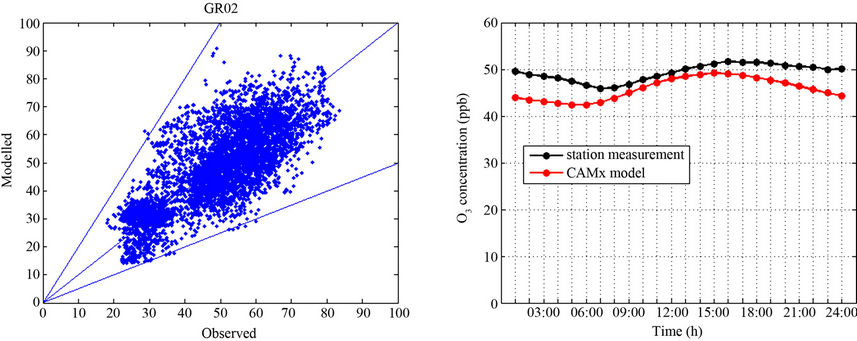
In Figure 7, hourly observed ozone concentrations for a number of the EMEP stations are compared with the results of the modeling system. The forecasted values correspond well to the observed values and the modeling system captures well the diurnal variation of ozone. A common characteristic in Figure 7 is that the gradient of the modeled concentrations is lower than the gradient of the observed ones.
The above plots indicate good forecast ability with a tendency to overpredict the ozone concentrations. The skill scores exhibit seasonal variations and present their best values in the summer and autumn. Finally, the diurnal variation of ozone is captured by the modeling system with lower gradient of changes though.
 Finokalia
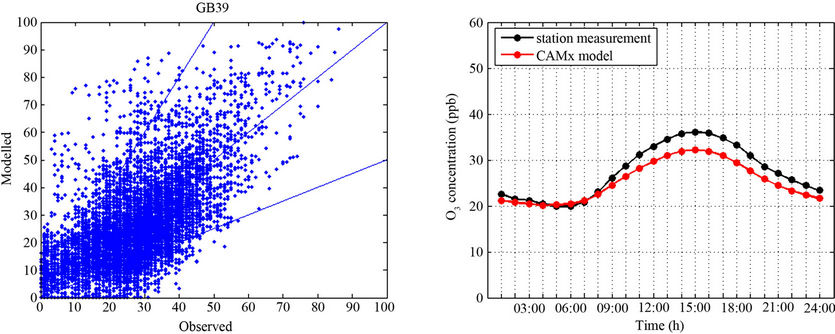 Sibton
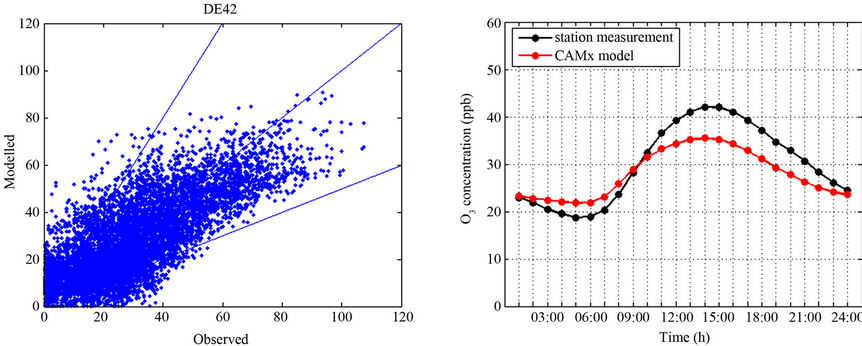 hringen
Figure 7. Scatter plots of the observed versus modeled hourly ozone concentrations and the composite observed (black curves) and modeled (red curves) diurnal variation of ozone (ppbV) in 2003 at three EMEP stations.
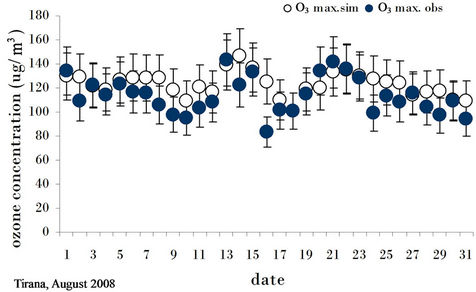
Figure 8. Simulated (open circles) and observed (filled circles) ozone maxima (µg/m³) in Tirana, Albania, 2008.
The performance of the model for Albania is of special interest in the context of this paper and the underlying project. It is demonstrated in Figure 8 choosing the ozone maximum in August 2008 in Tirana as an example. As noted for the EMEP stations in Figure 7, a slight tendency to overprediction is also evident in this case.
4. Strategy of Model Application
Risks exist on a wide range of temporal and spatial scales which require different ways of model application for their analysis and assessment. For instance, the search of sources causing episodic, i.e. short term, air pollution events as well as studies of long-term harmful impacts of background pollution like crop damage have been carried out with episode and long-term integrations of EURAD, in particular, focusing on areas in Central Europe (e.g.
[42]). Similar studies will be conducted with the BALKAN system for the Balkan Peninsula, for which it has been designed for operational application. Yet the special characteristic of it is its design for direct treatment of emergency situations which requires immediate running of the model in order to provide local and national authorities with reliable data on near source dispersion of harmful emissions and expected impacts at intermediate distances of an accident. For this purpose the “fast decision mode” of the BALKAN system is employed by the models run by the Bulgarian and Romanian partners. After identification of potentially harmful locations, socalled “hot spots”, the systems can be used to provide highly accurate and reliable risk analyses as a basis for the design of prevention measures.
As a demonstration of model application two examples will briefly be discussed, where one is showing an attempt to localize an unidentified source of episodic high ozone concentrations and the other one illustrating the assessment of air pollution loads by known strong sources.
4.1. Search for a Possible Air Pollution Source Employing the EURAD Model System
A region where high ozone concentrations frequently have been measured despite a general reduction of precursor emissions is found southwest of Cologne, Germany. The station which often shows critical exceedances of limit values during photo-oxidant episodes is Huerth. This phenomenon is therefore called Huerth effect though it is not necessarily confined to this location alone. Figure 9 shows observations (black curves) and simulations
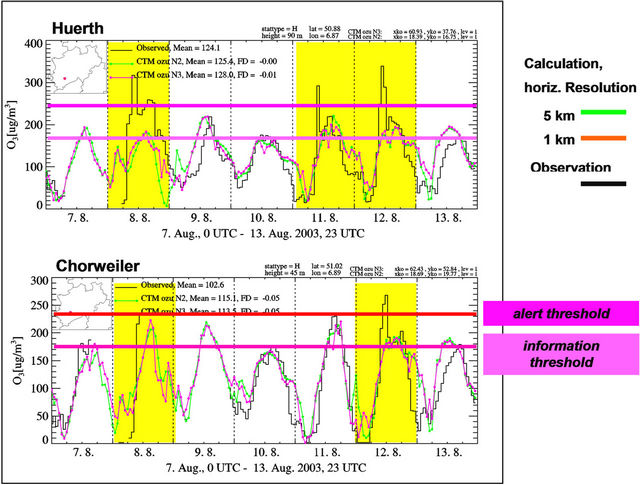
Figure 9. Observation and simulation of ozone concentration (µg/m³) in Huerth and Cologne-Chorweiler, 7-13 August 2003. Black lines: Observation; green: Simulation, 5 km horizontal resolution; red: Simulation, 1 km horizontal resolution. Days with exceedance of the alert threshold by the “Huerth plume” are indicated by yellow background.
(colored curves) from a week with high photooxidant production in August 2003 [44]. The information limit threshold of ozone (180 μg/m³) was reached every day around noon at Huerth (upper panel) and also at a station about 20 km north of it (Chorweiler, lower panel). The warning threshold (240 μg/m³) was exceeded at three days at station Huerth and at two days at station Chorweiler. Suspicion always existed that such exceedances might have been caused by a larger agglomeration of chemical plants, a “hot spot”, in the industrial area of Wesseling about 10 km SSE of Huerth (see Figure 10 for position of the locations).
Using regular emission scenarios identification of particular regionally confined sources is difficult. Therefore model experiments have been carried out with a high emission scenario as a base case and the same scenario, but with emissions from Wesseling set to zero [43]. The simulated curves in Figure 9 show results of the base case. The calculations have been carried out with a horizontal resolution of 1 km and 5 km,respectively. Evidently, the general behavior of ozone is quite well reproduced with both resolutions. As expected there is better agreement of measurements and simulation at station Chorweiler which is more distant from the suspected source. Only slight improvements have been obtained applying the finer grid. Yet the concentration peaks are not met indicating that the emission inventory is failing to reproduce real conditions in the analyzed region. Subtraction the simulation without emissions in Wesseling from the base case shows how the emissions and secondary pollutants from this location are dispersed in the surroundings. The experiment gives clear hints that the Wesseling cloud hits the stations Huerth and Chorweiler at times when the exceedances are observed. A snapshot of dispersion calculations with increased emissions from the Huerth area is exhibited in Figure 10 using ethene as tracer. The difference “increased emission case” minus base case is shown. As consequence of this experiment emissions of the industrial region should be re-evaluated and preferably reduced in practice, whereas the model should be adjusted to existing emission conditions in order to better represent effects like such around Huerth.
4.2. Risk Assessment Employing the BALKAN System
As a precautionary measure several potential sources of accidental releases have been identified on the Balkan Peninsula. Their possible impact on the neighboring environment can be studied with numerical experiments (Level 3 simulations) so that one is prepared for realaccidents. Two examples of larger and smaller scale calcu lations, respectively, are shown.
For the assessment of trans-regional impacts simulations have been carried out employing the Romanian subsystem. As evident from Figure 11 three major sources have been implemented in order to assess the exposure of the wider neighborhood to their emissions.
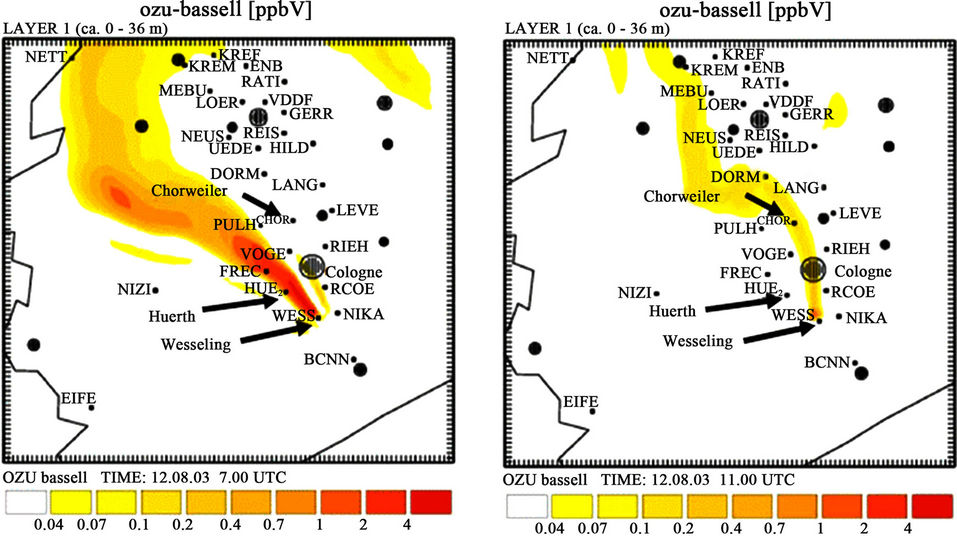
Figure 10. Simulated ethene cloud originating in Wesseling. Concentration in ppbV. 12 August 2003, 08 CET (left) and 12 CET (right). Difference plot of the scenario with increased emissions from the assumed source area and the base scenario.
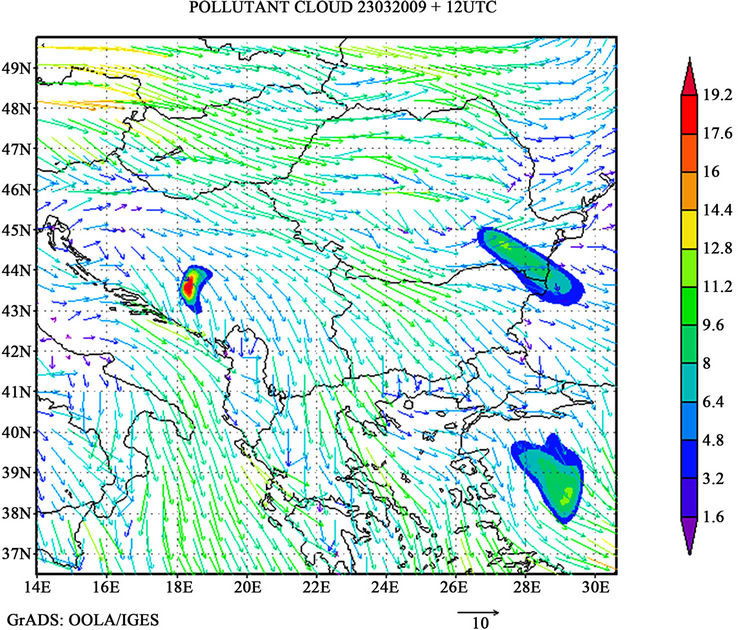
Figure 11. An example of the Romanian sub-system output—simulated wind field (23 March 2009, 12 UTC) and corresponding tracer plumes near the Earth’s surface from potentially dangerous sites, generated after 12 hours of emission. (Length of arrow below the panel corresponds to wind speed of 10 m/s; tracer concentration in arbitrary units).
Turning to the smaller scale with Bulgaria as an example, main sources (hot spots) of harmful pollutants in this country have been marked in Figure 3. Results of sensitivity experiments carried out with the Bulgarian component for a selected spot, namely the VEREA-HIM factory in Yambol, are shown in Figure 12. The simulations are made for the case of accidental release of chlorine. The accident scenario is characterized by an instantaneous release of chlorine near the earth’s surface at 03 am. Sequential nesting was applied for downscaling to a horizontal resolution of 1 km. The concentration evolution at two levels using the meteorology of 1 July 2007 is exhibited in the figure. As it should be expected the concentration has a very steep “Gaussian” shape in the beginning (forming a dense aggressive cloud lasting more than two hours) and then the pollutants gradually spread in horizontal and vertical direction under the impact of the mean wind.
5. Conclusions
Two ways of assessing risks resulting from air pollution in general and from emission hot spots with the help of chemical transport model systems have been presented. Furthermore, possible applications to emergency modeling in case of accidental releases from factories dealing with harmful substances have been indicated. The need of such work has dramatically been underlined by the tragic nuclear power plant accident in Fukushima, Japan. It has been shown that different characteristics of chemical transport model systems may require and enable different strategies of impact and risk assessment. The systems treated in this study are the EURAD model as a single system applicable to larger regions with the possibility of down-scaling by a nesting procedure and the BALKAN model system made up by a combination of models designed for simulations of air quality in subregions of the Balkans.
The results of model evaluation show that the model systems are sufficiently accurate for risk and impact assessment, though there is no doubt that improvement is necessary and can be achieved in future. This concerns the model performance as well as the reliability of model input data, in particular natural and anthropogenic emissions. Numerical experiments as briefly indicated in Section 4 are a first and essential step towards the assessment of risks for the population and natural environment in the neighborhood of harmful emission sources. Extending episodic simulations as employed in this paper to longer periods, e.g. one year, with observed meteorology
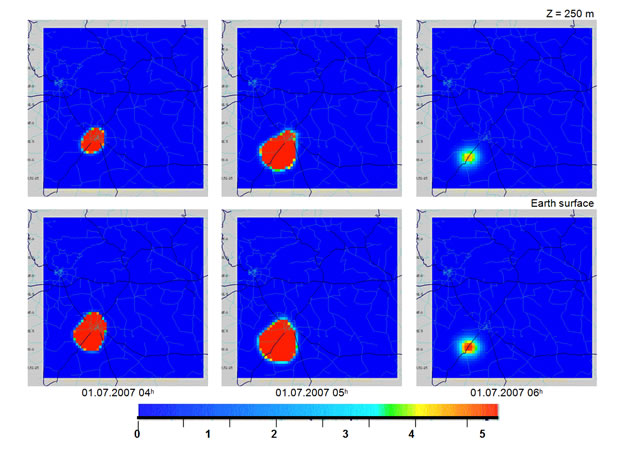
Figure 12. Evolution of concentration [relative units] from instantaneous accidental chlorine release. Surface source, 01 July 2007, 03 am. Horizontal resolution 1 km. Upper row: Level at 250 m; lower row: Earth surface.
maps classifying areas around such sources according to their average exposure to harmful emitted substances could be designed and used for precautionary measures.
More and extended applications to the problem of risk and impact assessment will be presented in a follow-up paper.
6. Acknowledgements
The study has been conducted in the framework of the project “Modeling System for Emergency Response to the Release of Harmful Substances in the Atmosphere”, NATO Science for Peace and Security Programme, ESP.EAP.SFPP 981393. The LAP-AUTh air quality forecast system has been developed in collaboration with the Laboratory of Climatology and Atmospheric Environment in the Department of Geography and Climatology of the National and Kapodistrian University of Athens and was funded by the EU project “Global and regional Earth-system Monitoring using Satellite and insitu data (GEMs)” (Contract No.: 516099). The RIU coauthors gratefully acknowledge the agreement by the NRW environmental agency LANUV to reproduce Figures 9 and 10 in modified and original form, respectively, in this paper.
REFERENCES
- I. Farago, K. Georgiev, A. Havasi, “Advances in Air Pollution Modeling for Environmental Security,” Springer, New York, 2005. doi:10.1007/1-4020-3351-6
- D. Melas, I. Sandu, G. Kostadien and H. Manjola, “Modelling System for Emergency Response to the Release of Harmful Substances in the Atmosphere,” NATO, Brussels, 2006.
- M. Memmesheimer, E. Friese, A. Ebel, H. J. Jakobs, H. Feldmann, C. Kessler and G. Piekorz, “Long-Term Simulations of Particulate Matter in Europe on Different Scales Using Sequential Nesting of a Regional Model,” International Journal of Environment and Pollution, Vol. 22, No. 1-2, 2004, pp. 108-132.
- I. J. Ackermann, H. Hass, M .Memmesheimer, A. Ebel, F. B. Binkowski and U. Shankar, “Modal Aerosol Dynamics Model for Europe: Development and First Applications,” Atmospheric Environment, Vol. 32, No. 17, 1998, pp. 2891-2999. doi:10.1016/S1352-2310(98)00006-5
- B. Schell, I. J. Ackermann, H. Hass, F. S. Binkowski and A. Ebel, “Modeling the Formation of Secondary Organic Aerosol within a Comprehensive Air Quality Modeling System,” Journal of Geophysical Research, Vol. 106, No. D22, 2001, pp. 28275-28293. doi:10.1029/2001JD000384
- F. A. Gifford, “Atmospheric Dispersion Calculations Using the Generalized Gaussian Plume Model,” Nuclear Safety, Vol. 2, No. 2, 1960, pp. 56-68.
- D. B. Turner, “Workbook of Atmospheric Dispersion Estimates: An Introduction to Dispersion Modeling,” 2nd Edition, CRC Press, Boca Raton, 1994.
- W. B. Petersen and L. G. Lavdas, “INPUFF 2.0. A Multiple Source Gaussian Puff Dispersion Algorithm,” User’s Guide, EPA/600/8-86/024, Washington DC, 1986.
- I. Sandu, V. Cuculeanu and N. Romanof, “Statistical Performance of Few Dispersion Schemes for Tracer Experiment Data at a Nuclear Power Plant,” Proceeding of 5th International Conference on Harmonization within Atmosphere Dispersion Model for Regulatory Purposes, Rhodes, 18-21 May 1998.
- M. R. Beychok, “Fundamentals of Stack Gas Dispersion,” 4th Edition, Milton Beychok, Irvine, 2005.
- EMEP/EEA, Air Pollutant Emission Inventory Guidebook, Technical Report, EEA. www.eea.europa.eu/data-andmaps/figures#c15=all&c0=5& bstart=450&c5=air, 2009
- A. G. Grell, J. Dudhia and D. R. Stauffer, “A Description of the Fifth-Generation PennState/NCAR Mesoscale Model (MM5),” NCAR Technical Notes, Boulder, 1993.
- B. C. Skamarock, J. B. Klemp, J. Dudhia, D. O. Gill, D. M. Barker, M. G. Duda, X.-Y. Huang, W. Wang and J. G. Powers, “A Description of the Advanced Research WRF Version 3,” NCAR Technical Notes, Boulder, 2008.
- W. R. Stockwell, F. Kirchern and M. Kuhn, “A New Mechanism for Regional Atmospheric Chemistry Modelling,” Journal of Geophysical Research, Vol. 102, No. D22, 1997, pp. 25847-25879. doi:10.1029/97JD00849
- H. Geiger, I. Barnes, I. Bejan, T. Benter and M. Spitler, “The Tropospheric Degradation of Isoprene: An Updated Module for the Regional Atmospheric Chemistry Mechanism,” Atmospheric Environment, Vol. 37, No. 11, 2003, pp. 1503-1519. doi:10.1016/S1352-2310(02)01047-6
- F. S. Binkowski, “Aerosols in MODELS-3 CMAQ,” in Science Algorithms of the EPA Models-3 Community Multiscale Air Quality (CMAQ) Modelling System,” EPA 600/R-99-030, Washington DC, 1999.
- E. Friese, M. Memmesheimer, I. J. Ackermann, H. Hass, A. Ebel and M. J. Kerschgens, “A Study of Aerosol/ Cloud Interactions with a Comprehensive Air Quality Model,” Journal of Aerosol Science, Vol. 31, S1, 2000, pp. 54-55. doi:10.1016/S0021-8502(00)90061-2
- E. Friese and A. Ebel, “Temperature Dependent Thermodynamic Model of the System H+-NH4+-Na+-
 -
-  -Cl–-H2O,” Journal of Physical Chemistry A, Vol. 114, No. 43, 2010, pp. 11595-11631. doi:10.1021/jp101041j
 - LUA, Landesumweltamt Nordrhein-Westfalen, “Emissionskataster Luft Nordrehin-Westfalen 1996/1997,” Report, LANUV, Recklinghausen, Essen, 1999.
- H. J. Jakobs, “Detailed Air Quality Forecast, Analysis for Yesterday,” 2010. www.eurad.uni-koeln.de
- ENVIRON, “User’s guide CAMx—Comprehensive Air Quality Model with Extensions, Version 4.40,” ENVIRON International Co., Groton, 2006.
- A. J. H. Visschedijk, P. Y. J. Zandveld and H. A. C. A. D. van der Gon, “High Resolution Gridded European Emission Database for the EU Integrate Project GEMS, TNOReport, Bedford, 2007.
- A. Hollingsworth, R. J. Engelen, C. Textor, A. Benedetti, O. Boucher, F. Chevallier, A. Dethof, H. Elbern, H. Eskes, J. Flemming, C. Granier, J. W. Kaiser, J.-J. Morcrette, P. Rayner, V.-H. Peuch, L. Rouil, M. G. Schultz and A. J. Simmons, “Toward a Monitoring and Forecasting System for Atmospheric Composition: The GEMS Project B,” Bulletin of the American Meteorological Society, Vol. 89, No. 8, 2008, pp. 1147-1164. doi:10.1175/2008BAMS2355.1
- R. Friedrich, “GENEMIS—Assessment, Improvement, Temporal and Spatial Disaggregating of European Emission Data,” In: A. Ebel, R. Friedrich and H. Rhode, Eds., Tropospheric Modelling and Emission Estimation, (PART 2). Springer, New York, 1997.
- K. Markakis, A. Poupkou, D. Melas, P. Tzoumaka and M. Petrakakis, “A Computational Approach Based on GIS Technology for the Development of an Anthropogenic Emission Inventory of Gaseous Pollutants in Greece,” Earth and Environmental Science, Vol. 207, No. 1-4, 2010, pp. 157-180. doi:10.1007/s11270-009-0126-5
- K. Markakis, A. Poupkou, D. Melas and C. Zerefos, “A GIS Based Anthropogenic PM10 Emission Inventory for Greece,” Atmospheric Pollution Research, Vol. 1, No. 2, 2010, pp. 71-78. doi:10.5094/APR.2010.010
- I. Kioutsioukis, A. Poupkou, E. Katragkou, T. Giannaros, K. Markakis, D. Balis, D. Melas and C. Zerefos, “An Evaluation of the MM5/CAMx System for Europe,” ESA Atmospheric Science Conference, Barcelona, 7-11 September 2009.
- I. Kioutsioukis, A. Poupkou, E. Katragkou, T. Giannaros, K. Markakis, D. Balis, D. Melas and C. Zerefos, “Performance Evaluation of the MM5/CAMX System for Europe (2003),” 10th International Conference on Meteorology, Climatology and Atmospheric Physics, Patra, 25-28 May 2010.
- I. Kioutsioukis, A. Poupkou, E. Katragkou, T. Giannaros, K. Markakis, D. Balis, D. Melas and C. Zerefos, “Evaluation of the MM5/CAMx System for Europe,” Atmospheric Environment, to be Submitted, 2010.
- A. Poupkou, D. Melas, I. Kioutsioukis, I. Lisaridis, P. Symeonidis and D. Balis, “Regional Air Quality Forecasting over Greece within PROMOTE,” Electronic Proceedings of the Atmospheric Science Conference, Frascati, 8-12 May 2006.
- A. Poupkou, I. Kioutsioukis, I. Lisaridis, K. Markakis, T. Giannaros, E. Katragkou, D. Melas, C. Zerefos and L. Viras, “Evaluation in the Greater Athens Area of an Air Quality Forecast System,” Proceedings of the IX EMTE National-International Conference of Meteorology-Climatology and Atmospheric Physics, Thessaloniki, 28-31 May 2008, pp 759-766.
- A. Poupkou, T. Giannaros, K. Markakis, I. Kioutsioukis, G. Curci, D. Melas and C. Zerefos, “Development of a Biogenic NMVOCs Emission Model,” Environmental Modelling and Software, 2010, in Press.
- P. Symeonidis, A. Poupkou, A. Gkantou, D. Melas, O. D. Yay, E. Pouspourika and D. Balis, “Development of a Computational System for Estimating Biogenic NMVOCs Emissions Based on GIS Technology,” Atmospheric Environment, Vol. 42, No. 8, 2008, pp. 1777-1789. doi:10.1016/j.atmosenv.2007.11.019
- J. Flemming, “Technical Description of the Coupled Forecast System IFS-CTM for Global Reactive Gases Forecast and Assimilation in GEMS, 2008. http://gems.ecmwf.int/do/get/PublicDocuments/1534/1052?showfile
- W. P. L. Carter, “Condensed Atmospheric Photooxidation Mechanisms for Isoprene,” Atmospheric Environment, Vol. 30, No. 24, 1996, pp. 4275-4290. doi:10.1016/1352-2310(96)00088-X
- J. S. Chang, R. A. Brost, I. S. A. Isaksen, S. Madronich, P. Middleton, W. R. Stockwell and C. J. Walcek, “A ThreeDimensional Eulerian Acid Deposition Model: Physical Concepts and Formulation,” Journal of Geophysical Research, Vol. 92, No. D12, 1987, pp. 14681-14700. doi:10.1029/JD092iD12p14681
- A. Nenes, C. Pilinis and S. N. Pandis, “ISORROPIA: A New Thermodynamic Model for Multiphase Multicomponent Inorganic Aerosols,” Aquatic Geochemistry, Vol. 4, No. 1, 1998, pp. 123-152. doi:10.1023/A:1009604003981
- A. Nenes, C. Pilinis and S. N. Pandis, “Continued Development and Testing of a New Thermodynamic Aerosol Module for Urban and Regional Air Quality Models,” Atmospheric Environment, Vol. 33, No. 10, 1999, pp. 1553-1560. doi:10.1016/S1352-2310(98)00352-5
- R. Strader, F. Lurmann and S. N. Pandis, “Evaluation of Secondary Organic Aerosol Formation in Winter,” Atmospheric Environment, Vol. 33, No. 29, 1999, pp. 4849- 4863. doi:10.1016/S1352-2310(99)00310-6
- D. Byun and J. Ching, “Science Algorithms of the EPA Models-3 Community Multiscale Air Quality (CMAQ) Modeling System,” EPA Report, Washington DC, 1999. http://www.epa.gov/asmdnerl/models3/doc/scence/science.html
- D. Byun and K. L. Schere, “Review of the Governing Equations, Computational Algorithms, and Other Components of the Models-3 Community Multiscale Air Quality (CMAQ) Modeling System,” Applied Mechanics Reviews, Vol. 59, No. 2, 2006, pp. 51-77. doi:10.1115/1.2128636
- M. Memmesheimer, H. Feldmann, C. Kessler, E. Friese, H. J. Jakobs, G. Piekorz and A. Ebel, “Ausbreitungsrechnungen zur Ermittlung der Luftqualität in NRW mit einem komplexen Aerosol-Chemie-Transport-Modell (ATLANTIS),” Abschlussbericht Rhein, Institut für Umweltforschung an der Universität zu Köln und Landesumweltamt NRW, Düsseldorf, 2006.
- M. Memmesheimer, E. Friese, H. J. Jakobs, C. Kessler, H. Feldmann, G. Piekorz and A. Ebel, “Lokal Geprägte Ozonspitzenwerte in Nordrhein-Westfalen: Ursachen und Minderungspotential für ein Ausgewähltes Gebiet im Kölner Süden (OZURMI),” Abschlussbericht Rhein, Institut für Umweltforschung an der Universität zu Köln und Landesumweltamt NRW, Düsseldorf, 2005.
- P. Bruckmann, J. Geiger, U. Hartmann and S. Wurzler, “Die Ozonepisode im Juli/August 2003. Vorläufiger Bericht des Landesumweltamtes Nordrhein-Westfalen. Essen, 2003. http://www.lua.nrw.de/luft/immissionen/aktluftqual/eu_o3_akt.htm. 2003