Social Networking
Vol.3 No.1(2014), Article ID:42391,9 pages DOI:10.4236/sn.2014.31004
Simulating the Effect of Social Network Structure on Workflow Efficiency Performance
1Department of MIS, The University of Tulsa, Tulsa, USA
2Department of Computer Science, The University of Tulsa, Tulsa, USA
Email: akhilesh-bajaj@utulsa.edu, sandip-sen@utulsa.edu
Copyright © 2014 Akhilesh Bajaj, Sandip Sen. This is an open access article distributed under the Creative Commons Attribution License, which permits unrestricted use, distribution, and reproduction in any medium, provided the original work is properly cited. In accordance of the Creative Commons Attribution License all Copyrights © 2014 are reserved for SCIRP and the owner of the intellectual property Akhilesh Bajaj, Sandip Sen. All Copyright © 2014 are guarded by law and by SCIRP as a guardian.
Received November 20, 2013; revised December 22, 2013; accepted January 9, 2014
KEYWORDS
Social Networks; Simulation; Workflow Systems; Agent Based Modeling
ABSTRACT
The effect of social network structure on team performance is difficult to investigate using standard field observational studies. This is because social network structure is an endogeneous variable, in that prior team performance can influence the values of structural measures such as centrality and connectedness. In this work we propose a novel simulation model based on agent-based modeling that allows social network structure to be treated as an exogeneous variable but still be allowed to evolve over time. The simulation model consists of experiments with multiple runs in each experiment. The social network amongst the agents is allowed to evolve between runs based on past performance. However, within each run, the social network is treated as an exogenous variable where it directly affects workflow performance. The simulation model we describe has several inputs and parameters that increase its validity, including a realistic workflow management depiction and real-world cognitive strategies by the agents.
1. Introduction
A social network is a structure whose nodes represent members in a social context and whose edges can represent interaction, collaboration or influence between the members [1]. SN analysis has attracted considerable interest from social and behavioral scientists over the last few decades [2,3]. Recently, management researchers have also recognized that organizations can benefit from the interactions within the informal social network amongst its members that can often supplement the official hierarchy imposed by the organizational chart [4,5]. While social networks may be represented in several ways, in this work, we utilize socio-matrices, where the sending members are the rows and the receiving members are the columns [2].
Several measures have been used in the SN literature to characterize a network, from the perspective of either a single actor, or from that of a group. Actor level measures include the centrality and the prestige of the actor in a SN, with finer definitions including degree centrality, closeness centrality and betweenness centrality [6]. Group or team level measures include the centrality of the leader of the team, overall team density (how interconnected are the members?), and a related construct: the overall team cohesiveness, defined as the “forces that act on members to stay in the group” [7].
Workflow modeling is an area that attempts to model organizational tasks that can be executed by actors who require resources to accomplish discrete tasks [8]. [9] pointed out that most Workflow Management Systems (WFMSs) refer to underlying organizational role lists in order to allocate activities to machines accessible by agents who can perform these roles. [10] provided several shortcomings in the activity allocation methods of WFMSs, many of which can be attributed to a lack of organizational knowledge on the part of the WFMS. One of the pioneering attempts to overcome these limitations is presented in [10], with the use of Object Constraint Language (OCL) to model teams of agents and their relationships in an organization. A limitation of this approach is that OCL does not support concepts that are usually used to characterize organizational relationships. Similarly, [11] used an object-oriented language to model organizational constraints, with the same limitations.
Literature in the management area on task performance has focused on contingency theory [12] where task completion performance is based on a good fit between task complexity and resources allocated, which may be information resources or otherwise. There is a broad recognition in the management literature that organizational tasks are performed in a social context [13]. [14,15] indicated that formal organizational structures and informal social networks often influence each other, and both are important factors in completing organizational tasks. [16] pointed out how management efforts to inform and motivate employees can affect strategically aligned behavior that can lead to better task performance. Such efforts can be facilitated using social networks that allow diffusion of information amongst employees and teams. [17] proposed a constructural theory of group formation, where individuals exchange information, form their social network within the organization based on current knowledge and that, in turn, shape their future knowledge. Thus a social network is an evolving variable, based on whom the actor has interacted with in the past. This dynamic view of evolving networks is also recognized in [18] though the network is considered as an endogeneous variable changed by actors based on some objective function.
A basic assumption in all studies investigating the effects of social network metrics on task completion performance has been that social networks serve as conduits for the flow of resources [19]. However, previous work in tying the effects of social network metrics to performance has been correlational with the potential for confounds because of the difficulty of isolating the dynamic aspect of the social network as tasks are executed. Not surprisingly, the findings have been mixed. According to [20], “unresolved empirical questions and theoretical debates persist about whether or not some social network features yield improved task completion…”
For example, [21] found no correlation between a team’s informal social ties and team performance. However, [22] showed how increased cohesiveness results in lower employee absenteeism. In [23], low cohesiveness was found to negatively affect creative group work such as brainstorming, as well as more routine tasks.
Similarly, [24] proposed that a well-connected leader correlated negatively with team performance because of the burden of maintaining social ties, while the traditional view (e.g. [25]) has been that better connected leaders have better performing teams.
A fundamental question in social networks effects has been the causal direction of the impact of the network structure. Does the network structure cause better performance [26], or does better actor/team performance lead to more social network centrality of teams and actors [27]? According to [28], enhanced reputation of actors based on previous performance may positively impact an actor’s centrality within the network which could in turn reinforce future performance of the actors.
Based on the discussion above, data collection in real world organizations cannot address the direction of causality. This work takes an initial step in resolving this issue by proposing a simulation model that uses agents as actors over multiple runs of workflows. For each run, the social network is exogenous. However it is allowed to evolve after each run, so that it is endogenous across runs. This can help our understanding of the direction of causality. Figure 1 captures the essence of the research model addressed by this simulation, using semantically rich agent behaviors to model organizational tasks.
2. Simulation Model
Our model of organizational tasks draws from the workflow and management literatures. Workflows are usually modeled as collections of tasks, connected using control flow operators and performed by actors requiring resources [29,30]. In [31], a canonical list of control flow operators connecting tasks that make up a workflow are described.
In the management area, for example, the PCAN model proposed in [32], uses people, resources and tasks matrices to model organizations. This approach has been further extended into the meta-matrix model and used in [33,34] to study the evolution of terrorist networks. The meta-matrix model [35] recognizes several column vectors such as personnel, tasks, resources and knowledge. Matrices representing relations between these column vectors are used to model views of the organizations. In earlier works, metrics imposed on each of these relations have been used to produce an overall view of the operational risk in the organization. For example, risk increases

Figure 1. Broad research model.
if an employee has exclusive access to a resource, or if there is a mismatch between the people-task matrix and the people-resource matrix, using the task-resource matrix as a reference. We model the organizational tasks in a similar way, and our simulation model aims to extend current work in the area by using Agent Based Modeling Systems (ABMS) based experiments to study the effects of differing network structures on task performance.
2.1. Basket of Independent Tasks
As mentioned in [17,18] social networks evolve as tasks are completed. Our simulation plan consists of several experiments. Each experiment consists of a series of runs. The SN is modeled as an exogenous variable in each run that evolves for the next run. During each run, organizational actors will execute tasks using resources that they possess or that are garnered from their social network. Each experiment ends when an optimal social network has been reached where there is not significant improvement in the task completion efficiency from previous runs.
Each experiment has a task basket that is reset at the start of each run. The SN for a run is derived from the earlier runs, based on the members the actor came in contact with in order to complete their tasks and the cognitive abilities of the actors in the network, which is one of the variables that can be studied in our model. This extends traditional work in social networks, where a study consists of one run, typically in a real world setting, and where actors often change their social network as part of the experiment, thereby making it the dependent or endogenous variable. Because the experiments we propose have multiple runs each, we can allow the social network to evolve in our experiments, but to still be exogenous for each run. Using varying levels of cognitive abilities of actors also extends work in the area of analytical models of agent based economic systems, where each agent is assumed to know every other agent.
The summary of our notation is shown in Figure 2.

Figure 2. Summary of notation used in the formulation.
The set T consists of task instances that make up the task basket for an experiment. We consider task instances as opposed to task types, in order to enable multiple instances of the same task type to be allocated to different members. For example, 500 instances of a task type such as handling a customer call, are handled as 500 different task instances, allocated to different possible members.
The relations in Figure 2 are modeled as matrices in our implementation. The values of cells in the X matrix represent the levels of each of the resources available to a member. Of course, a member may have available resources that they do not need, or excess levels of resources that others may be able to utilize. The X matrix represents the resource power of each actor. More resource-powerful actors have access to more types of resources and/or higher levels of a resource which are consumed in tasks.
The cell values in the Y matrix reflect the levels of each resource that a task needs for completion. Sufficient resources should be made available to the system to perform the task instances that are in the task basket for each run.
The cell values in the Z matrix reflect the expected value of the amount of time a member takes to complete a task. A positive value signifies that a member is assigned to a task instance. In the simple case of independent tasks, a task is only done by one member, and hence only one cell per column will have a positive value, all other cells in that column being 0. The actual time taken to complete a task in a simulation run is based on the expected value and a simulation parameter DT that represents the percentage interval for deviation in performance time for actors on tasks.
The cell values in the S matrix can be either binary or continuous between 0 - 1, depending on whether social links are assumed to be binary or weighted. For nondirectional links, only half the matrix is considered, since the matrix will be symmetric. For directional links, the entire matrix is used.
Each run in an experiment starts with the same task basket that needs to be completed and the same task assignment and mean times. This means that the Y and Z matrices are created at the start of an experiment and reset before each run. At the start of each run, the X matrix (linking actors to resource levels they control) is perturbed, the degree of perturbation P being a simulation parameter. The social network matrix S is created at the start of each experiment and will change at the start of each subsequent run in the experiment, based on the actors’ cognitive abilities. This implies that the S matrix is generated at the start of each run of an experiment, based, broadly speaking, on whom the actor came into contact with in the earlier runs of the experiment.
During each run, actors try to locate resources to perform the next task in their queue. If an actor in their social network has the resource, it is given with a delay = R where R is a simulation parameter representing a percentage of the expected time for the task. If a second degree interaction is required, it is with a time delay = R2, and so on. All resources required for a task have to be reachable by an actor, though some after many degrees of separation.
2.2. Strategies for Adapting Social Network
The goal of agents is to quickly locate most resourceful agents. Agents, therefore strategically choose connections, i.e., adapt their social networks, based on past experience to locate agents who possess the resources needed by most arriving tasks.
2.2.1. Variable Number of Agent Connections
We propose several simple strategies for adapting the social network. In these strategies the number of connections each agent possesses is variable, but bounded by the simulation parameter, S, which represents the maximum number of connections an agent can have in its social network. The maximum size S of each actor’s social network is part of the model of an agent’s cognitive capacity. One simple example is that once an actor is contacted by another, they become part of their social network. If an actor is not used by another for N runs they move out of that actor’s network in the N + 1th run, where N is a simulation parameter. If a weighted network, where the links are not binary but instead represent the strength of ties, is used, then the link weights may be reduced by a degree, D, also a simulation parameter. If an actor’s network approaches S, the social network link used least, or in the most distant past may be eliminated.
2.2.2. Fixed Number of Agent Connections
We propose three strategies for adapting the social network of agents when all agents utilizes the maximum number of connections allowed, S: random mixture, random selection, and rewiring with exploration [36,37]. Random mixture (RM) is the simplest strategy: at each iteration agents randomly reinitialize every connection. Note that the RM strategy does not require any long term memory for the agents and can be used by agents with very limited cognitive capabilities.
When using random selection (RS), an agent first decides whether it should change any of its connections. It keeps an exponential weighted moving average, V, of the utility gained in each iteration. The utility agent i expects to gain in the next iteration, t, is
 , (1)
, (1)
where  is a utility learning parameter and
  is the change in utility for agent i in period t − 1. If the expected gain falls below a utility threshold parameter, Θ , i.e.,
  then the agent chooses to rewire. If it chooses to change some of its connections, it still must choose which connections to rewire. That decision is also based on an exponentially weighted moving average of connection strengths represented by connection weights. If
  is the change in utility that agent i could have received by contacting agent j on iteration t, agent i updates its connection weight
  for the connection to agent j as follows:

where  is a weight learning parameter. The agent changes every connection for which the connection strength falls below a weight threshold parameter
 , i.e.,
 . New connection weights are initialized to the average of the current connection weights.
When using the decaying exploration (DE) strategy, each agent has an initial exploration rate , and this exploration rate is reduced at a rate
  in every iteration, i.e.,
 . The rate of change of connections will be based on
  as well as
 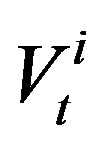 it as described above and the base expected utility,
 . In the DE strategy the probability of an agent rewiring a connection is given by
 . (2)
. (2)
The base expected utility is initialized as the average expected utilities for other connected agents. As in the RS strategy, agents keep track of the weight for each connection, . However, while the RS strategy can change multiple connections in one time step, an agent using the DE strategy is more cautious and changes only the connection with the lowest weight, and only if the corresponding weight satisfies the condition
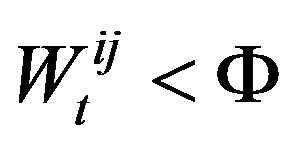 .
.
Variants of these strategies can be developed and evaluated as well which assume varying degrees of agent cognitive abilities, based on our experimental results with these three strategies for adapting the social network in an organization to more effectively process assigned tasks. Table 1 lists the simulation parameters for our model.
While the time taken to complete the task basket is one measure of interest, we are also interested in the number of runs it takes to evolve to an optimal social network, where each actor can complete their task with minimal second or higher order interactions with members outside their network. The run with the optimal social network will provide the most efficient completion time for the task basket for an experiment.
Next, we highlight some changes to the model when

Table 1. List of simulation parameters.
investigating interdependent tasks, or workflows, performed by people working in teams.
2.3. Interdependent Tasks and Teams
A basket of workflow instances (interdependent tasks) is generated at the start of each experiment, and the same basket would be used in each run of the experiment. We draw from the workflow modeling literature, where workflows are modeled as tasks (or activities) that are combined using a canonical set of control flow operators. These operators are precedence, AND-split, AND-join, OR-split, OR-join and an XOR-split [31].
When modeling interdependent tasks, we use the same sets and matrices as in Figure 2. However, an additional set of workflow instances W is needed, where each task instance in T is linked to one instance in W, though each workflow instance can be linked to many task instances. The average number of tasks per workflow will be Q, an additional simulation parameter. An algorithm for creating the interdependence between the tasks for each workflow is shown in Figure 3.
The rest of the simulation model is similar to the one for independent tasks. The primary difference here is that some tasks have to wait for other tasks based on interdependence. As part of the simulation implementation, a workflow execution engine would be needed that will implement the control flow so that certain tasks are on the wait queue of the workflow engine until other tasks are finished.
Again one can examine the effects of beginning social network structure on workflow completion efficiency, as well as the evolution of the SN over multiple runs. Additionally, team level SN measures can be used such as
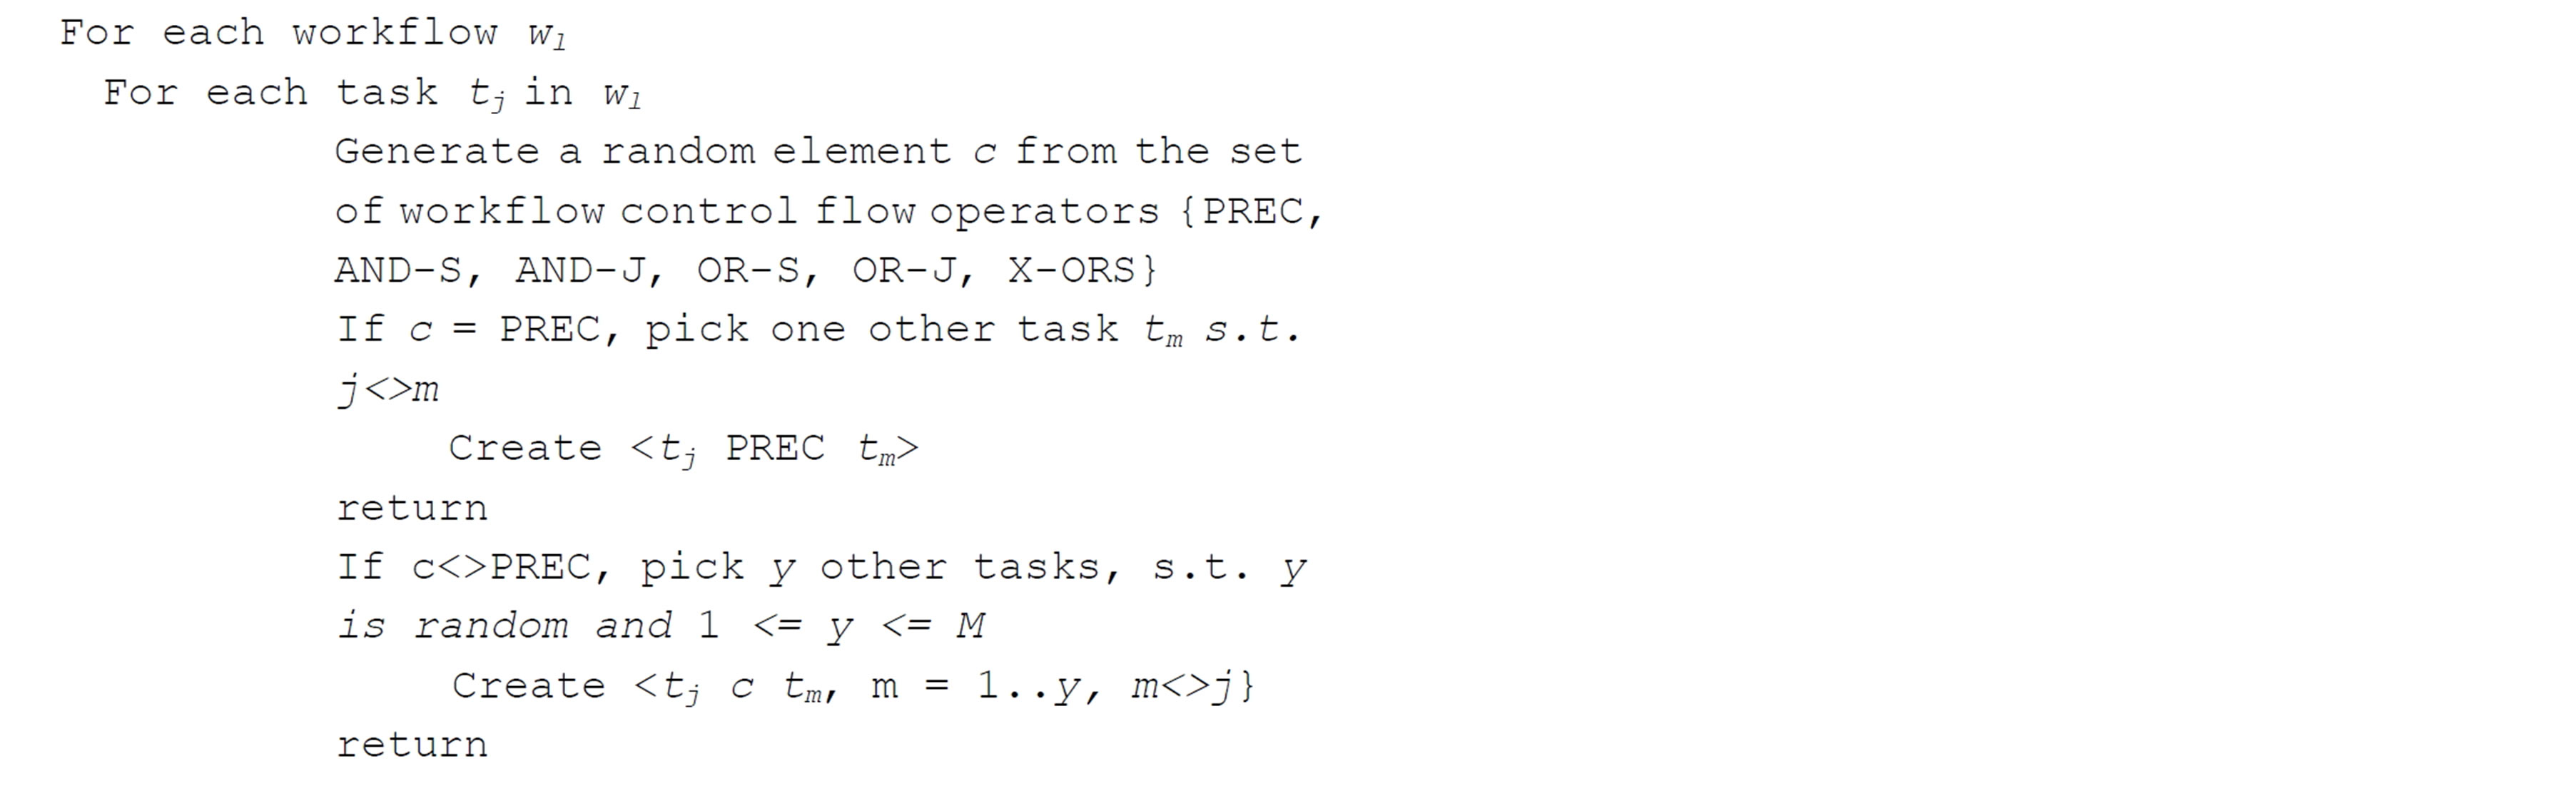
Figure 3. Algorithm to generate interdependent tasks or workflow instances.
mean team cohesion, mean connectedness of team with outside resources to characterize different types of starting social networks for experiments.
2.4. Operationalization of Variables for Experiments
We now describe how independent variables shown in Figure 1 are operationalized for different experiments. Figure 4 depicts a sample list of operationalizations for each of the independent variables whose effects can be tested as the goal of each experiment.
The task characteristics variable has been described above. For the cognitive ability of actors or agents, the maximum degree of each actor will reflect their cognitive capacity and can be varied. We also propose two other levels: one with limited working memory and one with working as well as long term memory. With only short term memory, actors will only remember the history of the current run and the social network will be updated based on the degree of usage of each link, with maximum number of links being a constraint. With long term memory, agents will remember the history from previous runs in an experiment and be able to optimize their social network based on longer histories as well as memories of optimal networks from the past.
The social network variable is the main variable of interest and several characterizations are possible for creating starting social networks. The average degree reflects the average number of links to which an actor is connected [38]. The small world topology [39] is one where all actors are connected to a few actors but long links go out across the network, so the degrees of separation are usually small.
The transitivity of a network is a measure of the likelihood of whether the friend of a friend is also your friend. A transitivity coefficient for each vertex is the ratio of the number of triangles connected to vertex v and the number of triples centered on v [39].

Figure 4. Operationalization of independent variables for different experiments.
Measures like centrality and network density can be used to characterize networks, based on individual links between members (nodes) of that group. Centrality of each member can be characterized by the number of other nodes to which the member is linked [40]. Network density reflects how reachable a node is, on average, from any other node in the network.
The level of mismatch between resource and social links can be used to test hypotheses drawn from the management literature [12,32,35] where resource allocations are not aligned with the conduits to harness resources (social networks).
The team for a workflow instance will be all the members assigned to execute the task instances for a workflow. We define the cohesiveness as the number of links between members of the team, divided by the theoretical maximum number of links possible between the members [41]. Similarly, team connectedness with outside members can be defined as the number of links going out from team members to those outside the team, divided by the expected number of such links. The expected number of links can be computed in several ways, including the average number of links between any two members in the organization.
The discussion above illustrates the different experiments that can be run, based on selecting one operationalization for each independent variable. In addition, the interaction effects between these variables can be studied.
2.5. Simulation Platform
Several multi-agent simulation tool-kits are available for deploying our model. One example is MASON (Multi-Agent Simulator Of Networks), a multi-agent simulation environment available at http://cs.gmu.edu/~eclab/projects/mason/. MASON is a general purpose, domain agnostic, lightweight framework that provides easily modifiable objects, stochastic event ordering, inspection of simulation objects, visualization of 2D and 3D, graphs, and charts. Repast (http://repast.sourceforge.net/) and Netlogo (http://ccl.northwestern.edu/netlogo/) are general purpose object-oriented frameworks that make simulating natural and social phenomena relatively easy for inexperienced users. MASON is more flexible, faster, and lightweight compared to RePast and Netlogo. JADE (Java Agent DEvelopment Framework), available at http://jade.tilab.com/ is a high-level software framework that enables the modeling of multi-agent systems. Two important features of Jade are: 1) it complies with the FIPA specifications (available at http://www.fipa.org/) and 2) its portability to many environments such as J2EE, J2SE, and J2ME. JADE allows each agent to dynamically discover other agents and to communicate with them according to the peer-to-peer paradigm. Though Jade is more sophisticated than MASON, the latter is more suitable for our need of a simulation environment that allows us to develop our own model.
When compared to other agent-based simulation platforms, MASON is fast, easily extensible, and efficient and can support up to a million agents over many iterations. Long-running simulations may be suspended and resumed later. MASON defines agents as computational entities that can be scheduled explicitly to perform some actions and change the environment. Steppable objects can be scheduled to occur at any given timestep. Various agents can be grouped together to perform in parallel. To enable visualization, MASON relates the objects with locations in 2D or 3D grids or network graphs.
In our experimental scenarios, a group of agents are assigned either individual or team-level organizational tasks at each timestep. To simulate such scenarios effectively, a teamwork generator agent is required that would generate tasks, determine groups, and assign these tasks to the agents in the group. If resource requirements for tasks are not met by local resources, the owners of tasks would search for resource provider agents in their environment to supply missing resources. Once agents with the required resources are located, the task owner agents will update their knowledge with the corresponding information. Agents can thus change their social networks after locating more resourceful agents in the organization. One can visualize the network of the agents and the changes in the topology of the network by using the visualization tools of MASON.
3. Discussion
The broad research questions we seek to address in this work are as follows. First, is it possible to create semantically rich agent based simulations of organizational task execution where simple behaviors lead to emergent patterns? Our approach differs from other studies in the social science area in that we model agent behaviors representing the area of organizational task completion drawing from both the workflow modeling literature and management literature. Second, how do different types of social networks in an organization affect task completion efficiency, and how do they evolve to converge to an “optimal” network over multiple runs of the simulation in different situations? While we include task types and agent cognitive makeup in our list of variables that affect task completion efficiency, we are primarily interested in the effect of different types of social networks. A unique feature of our proposal is that the social network is viewed as an exogenous variable in each run of an experiment, but at the same time dynamically evolves through multiple runs of an experiment.
4. Conclusions
Overall, we expect the primary contribution of this research to add significantly to the body of knowledge on the effects of social network characteristics on organizational work. The immediate impact of the ABMS infrastructure developed in this work will provide a realistic setting to test several social network based hypotheses related to organizational work processes that are difficult to measure using real world data collection. More importantly, in the long run, the semantically rich infrastructure developed in this project will allow the validation of analytical models that predict emergent behaviors in the network. It will allow the study of non-linear behavior amongst agents, using threshold level if-then decision making, which is intractable using differential equations.
The infrastructure will also allow the creation of semantically realistic experiments in other areas of sociology and management, where data collection has typically been onerous and often allowed for only correlational analysis, e.g., the effects of power and trust levels on task performance [42,43].
REFERENCES
- D. Liben-Nowell and J. Kleinberg, “The Link Prediction Problem for Social Networks,” 12th Annual ACM International Conference on Information & Knowledge Management (CIKM), 2003, pp. 556-559.
- S. Wasserman and K. Faust, “Social Network Analysis: Methods and Applications,” Cambridge University Press, Cambridge, 1999.
- J. l. Moreno, “Who Shall Survive? A New Approach to the Problems of Human Interrelations,” Nervous and Mental Disease Publishing Co., Washington DC, 1934. http://dx.doi.org/10.1037/10648-000
- H. Kautz, B. Selman and M. Shah, “ReferralWeb: Combining Social Networks and Collaborative Filtering,” Communications of the ACM, Vol. 30, No. 5, 1997, pp. 390- 402.
- P. Raghavan, “Social Networks: From the Web to the Enterprise,” IEEE Internet Computing, Vol. 6, No. 1, 2002, pp. 91-94. http://dx.doi.org/10.1109/4236.989007
- L. C. Freeman, “Cenrtality in Social Networks,” Social Networks, Vol. 1, No. 3, 1979, pp. 215-239. http://dx.doi.org/10.1016/0378-8733(78)90021-7
- L. Festinger, “Informal Social Communication,” Psychological Review, Vol. 57, No. 5, 1950, pp. 271-282. http://dx.doi.org/10.1037/h0056932
- D. Hollingsworth, “The Workflow Reference Model, WFMC,” TC, Vol. 1003, 1995.
- G. Governatori, A. Rotolo and S. Sadiq, “A Model of Dynamic Resource Allocation in Workflow Systems,” Fifteenth Australasian Database Conference, Dunedin, 18- 22 January 2004, pp. 197-206.
- A. Kumar, W. M. V. D. Aalst and E. M. Verbeek, “Dynamic Work Distribution in Workflow Management systems: How to Balance Quality and Performance?” Journal of Management Information Systems, Vol. 18, 2001, pp. 129-157.
- M. Momotko and K. Subieta, “Dynamic Changes in Workflow Participant Assignment,” East European Conference on Advances in Databases and Information Systems, Bratislava, 8-11 September 2002.
- R. T. Keller, “Technology-Information Processing Fit and the Performance of R&D Project Groups: A Test of Contingency Theory,” Academy of Management Journal, Vol. 37, No. 1, 1994, pp. 167-179. http://dx.doi.org/10.2307/256775
- S.-K. Han, “Structuring Relations in On-The-Job Networks,” Social Networks, Vol. 18, No. 1, 1996, pp. 47-67. http://dx.doi.org/10.1016/0378-8733(95)00255-3
- D. Krackhardt, “Cognition, and Power in Organizations,” Administrative Science Quarterly, Vol. 35, No. 2, 1990, pp. 342-369. http://dx.doi.org/10.2307/2393394
- L. F. Brajkovich, “Sources of Social Structure in a StartUp Organization: Work Networks, Work Activities, and Job Status,” Social Networks, Vol. 16, No. 3, 1994, pp. 191-212. http://dx.doi.org/10.1016/0378-8733(94)90005-1
- C. B. M. V. Riel, G. Berens and M. Dijkstra, “Stimulating Strategically Aligned Behavior amongst Employees,” Journal of Management Studies, Vol. 46, No. 7, 2009, pp. 1197-1226. http://dx.doi.org/10.1111/j.1467-6486.2009.00837.x
- K. Carley, “A Theory of Group Stability,” American Sociological Review, Vol. 56, No. 3, 1991, pp. 331-354. http://dx.doi.org/10.2307/2096108
- T. A. B. Snijders, G. G. V. D. Bunt and C. E. G. Steglich, “Introduction to Stochastic Actor-Based Models for Network Dynamics,” Social Networks, Vol. 32, No. 1, 2010, pp. 44-60. http://dx.doi.org/10.1016/j.socnet.2009.02.004
- H. Ibarra, “Personal Networks of Women and Minorities in Management: A Conceptual Framework,” Academy of Management Journal, Vol. 36, 1993, pp. 56-87.
- P. Balkundi and D. A. Harrison, “Ties, Leaders and Time in Teams: Strong Inference about Network Structure’s Effects on Team Viability and Performance,” Academy of Management Journal, Vol. 49, No. 1, 2006, pp. 49-68. http://dx.doi.org/10.5465/AMJ.2006.20785500
- R. Sparrowe, R. C. Liden, S. J. Wayne and M. L. Kramer, “Social Networks and the Performance of Individuals and Groups,” Academy of Management Journal, Vol. 44, No. 2, 2001, pp. 316-325. http://dx.doi.org/10.2307/3069458
- K. Sanders and A. Nauta, “Social Cohesiveness and Absenteeism: The Relationship between Characteristics of Employees and Short-Term Absenteeism within an Organization,” Small Group Research, Vol. 35, No. 6, 2004, pp. 724-741. http://dx.doi.org/10.1177/1046496404267186
- R. Steinmark, “Group Cohesiveness and Extrinsic Motivation in Virtual Groups: Lessons from an Action Case Study of Electronic Brainstorming,” 35th Hawaii International Conference on System Sciences (HICSS), Hawaii, 7-10 January 2002, p. 16b. http://dx.doi.org/10.1109/HICSS.2002.993873
- N. G. Boyd and R. R. Taylor, “A Development Approach to the Examination of Friendships in Leader-Follower Relationships,” Leadership Quarterly, Vol. 9, No. 1, 1998, pp. 1-25. http://dx.doi.org/10.1016/S1048-9843(98)90040-6
- M. Levi, P. E. Torrance and O. G. Pletts, “Sociometric Studies of Combat Air Crews in Survival Training,” Sociometry, Vol. 17, 1954, pp. 304-328. http://dx.doi.org/10.2307/2785962
- D. L. Rulke and J. Galaskiewicz, “Distribution of Knowledge, Group Network Structure and Group Performance,” Management Science, Vol. 46, No. 5, 2000, pp. 612-625. http://dx.doi.org/10.1287/mnsc.46.5.612.12052
- W. W. Powell, K. W. Koput and L. Smith-Doerr, “Interorganizational Collaboration and Locus of Innovation: Netowrks of Learning in Biotechnology,” Administrative Science Quarterly, Vol. 41, No. 1, 1996, pp. 116-145. http://dx.doi.org/10.2307/2393988
- P. Hinds, K. Carley and D. Krackhardt, “Choosing Work Group Members: Balancing Similarity, Competence, and Familiarity,” Organizational Behavior and Human Decision Processes, Vol. 81, No. 2, 2000, pp. 226-251. http://dx.doi.org/10.1006/obhd.1999.2875
- W. Coalition, “The Workflow Reference Model,” 1995.
- A. Bajaj and S. Ram, “A Content Specification for Business Process Models,” Australian Journal of Information Systems, Vol. 4, No. 1, 1996, pp. 22-31.
- B. Kiepuszewski, A. H. M. T. Hofstede and W. M. P. V. D. Aalst, “Fundamentals of Control Flow in Workflows,” Acta Informatica, Vol. 39, No. 3, 2003, pp. 143-209. http://dx.doi.org/10.1007/s00236-002-0105-4
- D. Krackhardt and K. Carley, “A PCANS Model of Structure in Organizations,” Proceedings of the 1998 International Symposium on Command and Control Research and Technology, Monterrey, June 1998, pp. 113-119.
- M. Tsvetovat and K. Carley, “Computational Modeling of Terrorist and Covert Networks,” Conference on Science and Technology in Context, Washington DC, 1 December 2004.
- K. Carley and N. Kamneva, “A Network Optimization Approach for Improving Organizational Design,” PA Technical Report CMU-ISRI-04-102, Carnegie Mellon University, Pittsburgh, 2004.
- R. Dattero, S. D. Galup and J. Quan, “The Knowledge Audit: Meta-Matrix Analysis,” Knowledge Management: Research and Practice, Vol. 5, No. 3, 2007, pp. 213-221. http://dx.doi.org/10.1057/palgrave.kmrp.8500142
- M. Gaston and M. des Jardins, “Agent-Organized Networks for Multi-Agent Production and Exchange,” 20th National Conference on Artificial Intelligence (AAAI 2005), Pittsburgh, 9-13 July 2005, pp. 77-82.
- J. Porter, K. Chakraborty and S. Sen, “Learning to Locate Trading Partners in Agent Networks,” In: M. E. Taylor and K. Tuyls, Eds., Adaptive Agents and Multi-Agent Systems IV. Lecture Notes in Computer Science, Vol. 5924, Springer-Verlag, Berlin, 2010, pp. 107-122.
- M. E. J. Newman, “The Structure and Function of Complex Networks,” SIAM Review, Vol. 45, No. 2, 2003, pp. 167-256. http://dx.doi.org/10.1137/S003614450342480
- D. J. Watts and S. H. Strogatz, “Collecive Dynamics of ‘Small World’ Networks,” Nature, Vol. 393, 1998, pp. 440-442. http://dx.doi.org/10.1038/30918
- D. J. Brass, “Being in the Right Place: A Structural Analysis of Individual Influence in an Organization,” Administrative Science Quarterly, Vol. 29, No. 4, 1984, pp. 518- 539. http://dx.doi.org/10.2307/2392937
- A. Bajaj and R. Russell, “Leveraging Group Cohesiveness to Form Workflow Teams,” Proceedings of the Americas Conference on Information Systems (AMCIS), Toronto, 2008.
- S. Aryee, P. Budhwar and Z. X. Chen, “Trust as a Mediator of the Relationship between Organizational Justice and Outcomes: Test of a Social Exchange Model,” Journal of Organizational Behavior, Vol. 23, No. 3, 2002, pp. 267-285. http://dx.doi.org/10.1002/job.138
- Y. K. Shetty, “Managerial Power and Organizational Effectiveness: A Contingency Analysis,” Journal of Management Studies, Vol. 15, No. 2, 1978, pp. 176-186. http://dx.doi.org/10.1111/j.1467-6486.1978.tb00918.x