Open Journal of Air Pollution
Vol.04 No.02(2015), Article ID:57066,12 pages
10.4236/ojap.2015.42009
Trace Metals Concentrations at the Atmosphere Particulate Matters in the Southeast Asian Mega City (Dhaka, Bangladesh)
Md. Faridul Islam1, Syada Sanjida Majumder1, Abdullah Al Mamun1,2, Md. Badiuzzaman Khan3,4, Mohammad Arifur Rahman1, Abdus Salam1*
1Department of Chemistry, University of Dhaka, Dhaka, Bangladesh
2Department of Chemistry, University of Louisville, Louisville, USA
3Department of Environment Sciences Informatics and Statistics, Cà Foscari University of Venice, Venice, Italy
4Department of Environment Science, Bangladesh Agricultural University, Mymensingh, Bangladesh
Email: *asalam@gmail.com
Copyright © 2015 by authors and Scientific Research Publishing Inc.
This work is licensed under the Creative Commons Attribution International License (CC BY).
http://creativecommons.org/licenses/by/4.0/


Received 16 May 2015; accepted 8 June 2015; published 11 June 2015
ABSTRACT
Atmospheric particulate matters were collected on quartz fibre filters for 24 hours with a low volume sampler from January 2014 to March 2014 at the Southeast Asian mega city (Dhaka, Bangladesh). Particulate matters samples were analysed for eleven trace metals with inductively coupled plasma mass spectrometer (ICP-MS) at Cà Foscari University of Venice, Italy. Trace metals were extracted from filters with digestion method using a mixture of HNO3 and H2O2. The average concentration of the determined trace metals of As, Cd, Ni, Cu, Pb, Cr, Fe, Mn, Zn, Sband Se were 3.06, 6.28, 3.77, 11.98, 305.6, 9.2, 2057.0, 42.2, 303.3, 5.47 and 2.43 ng∙m−3, respectively. Arsenic concentration is much lower in the atmosphere of Dhaka, though Bangladesh has severe arsenic problem in the ground water. Lead and cadmium concentrations showed decreasing trend in Dhaka compared than previous measurements―but still they have very high levels compared than Europe and USA. There is very limited information for Mn, Sb and Se concentrations in Dhaka air. Correlation studies showed that several trace metals had potential joint sources of origin, e.g., manganese is highly correlated with iron (r2 = 0.97) and nickel (r2 = 0.84), copper (r2 = 0.86); lead with arsenic (r2 = 0.79) and antimony (r2 = 0.78). Enrichment factors analysis was also done with the data base for the respective metals in earth crust and coal fly ash. As and Cu both have combined sources, whereas Cd, Pb and Zn were from coal fly ash.Trace metals concentrations in Dhaka city air were much higher than Europe and USA but comparable or slightly lower than other south Asian countries. This is the first extensive study for the eleven trace metals with ICP-MS in Dhaka, Bangladesh.
Keywords:
Atmospheric Aerosol, Particulate Matter, Trace Metals, Arsenic, Lead and Cadmium

1. Introduction
Atmospheric particulate matter (PM) has significant impact on human health, climate change, visibility reduction, agriculture and atmospheric chemistry. Aerosol particles may include a range of chemical species, ranging from metals to organic and inorganic compounds [1] [2] . Among the inorganic compounds, most important ones are the trace metals, which are emitted by various natural and anthropogenic sources such as crustal materials, road dust, construction activities, motor vehicles, coal and oil combustion, incineration and other industrial activities [3] - [7] . Health impacts associated with particulate matters are linked to respiratory, cardiovascular problems, premature mortality, lung cancer, heart diseases and also damage to other organs [8] - [11] . Several studies have indicated that different transition metals may act as possible mediators of particle induced injury and inflammation [12] [13] . The attention has often been focused on transition metals such as iron, nickel, chromium, copper, and zinc, based on their ability to generate reactive oxygen species (ROS) in biological tissues [14] . Using single-component regression analysis, Gurgueira et al. [15] described that the content of Fe, Mn, Cu, and Zn was strongly associated with the oxidative stress generated in the lung, whereas Fe, Al, Si, and Ti were associated with the effects observed in the heart. The spatial and temporal variation in the risk of particulate matters is partially explained by chemical composition [16] .
Atmospheric pollution is a serious public health problem in the developing countries especially Dhaka, Bangladesh due to the unplanned rapid growth of the city [17] . Dhaka, with about 17 million people and 8% increase of population per year [18] , is exposed to the high levels of trace metal pollutions from a variety of sources [17] . Due to the presence of high-level toxic elements, Dhaka has been considered as one of the most polluted cities in the world [18] . Air pollution in Bangladesh is mainly caused by traffics, brick kilns, industries, biomass burning, construction activity, soil dust, and also long range transport, etc. [19] . Trace metals levels have the high exceedances of WHO guideline values in South Asian countries (e.g., India and Pakistan) [20] . The present environmental condition especially atmospheric pollution in Bangladesh is not at all equilibrium. Severe air, water and noise pollution are threatening human health, ecosystems and economic growth of Bangladesh. Several thousand people were died each year due to air pollution problemin Bangladesh. Thus, the monitoring of trace metals in atmospheric particulate matters in Dhaka city has become an essential part of environmental planning and control programmes in Bangladesh.
With this objective, we aimed for assessing particulate matters with respect to eleven trace metals (As, Cd, Ni, Cu, Pb, Cr, Fe, Mn, Zn, Sb and Se) between January and February 2014 in University of Dhaka, Bangladesh. Results from this work can provide useful information on trace metal composition of particulate matters. The results can also be used to support further studies on the impacts of traffic and industries generated pollutants on human health in the highly populated Dhaka City, Bangladesh.
2. Experimental Method
2.1. Description of the Sampling Location
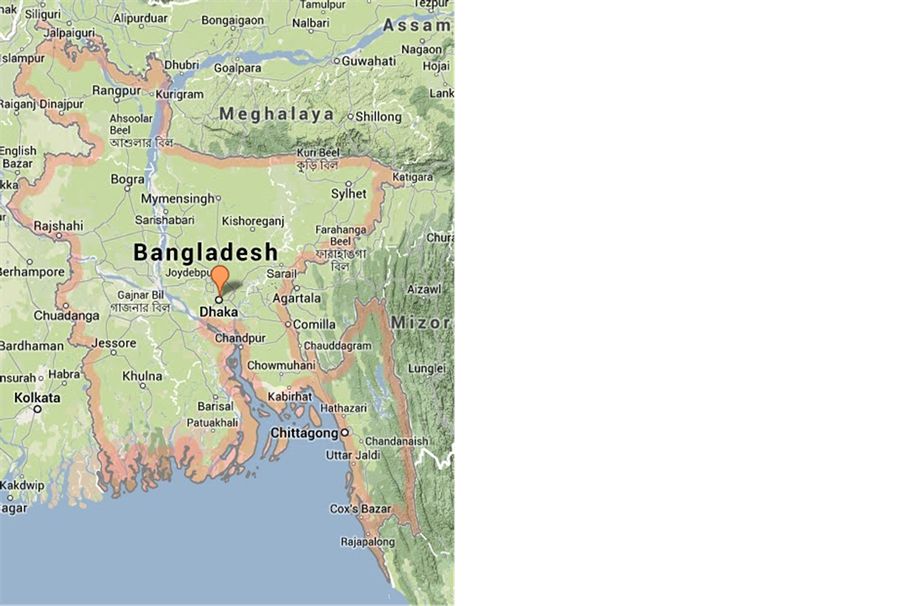
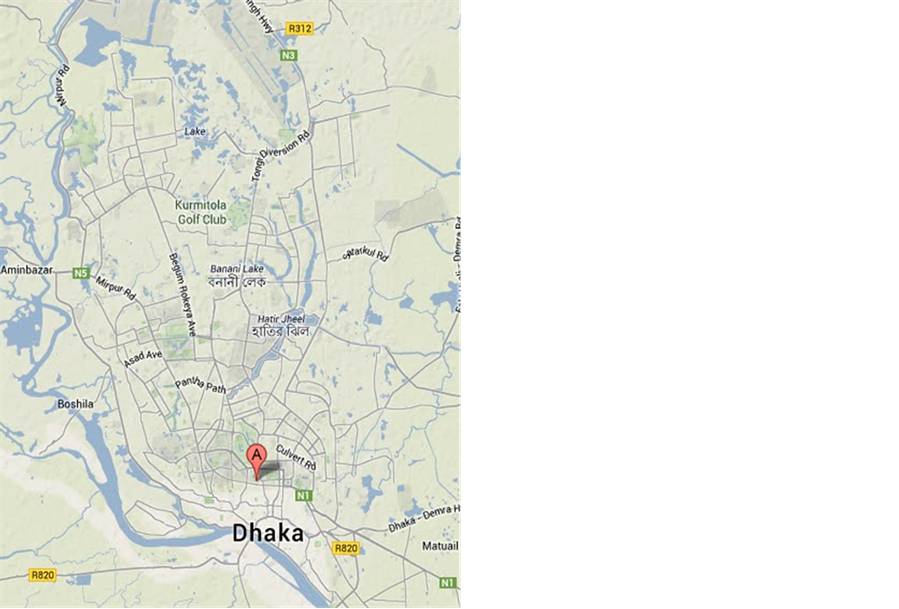
Bangladesh is situated in the eastern part of south Asia. It is surrounded by India on the west, the north and the northeast, Myanmar on the southeast, and the Bay of Bengal on the south (Figure 1). Dhaka (Latitude: 23.72839˚ North, Longitude: 90.39819˚ East, Elevation: 34.0 Meters), the capital of Bangladesh, is the centre of commerce and industries for the country. Dhaka is growing rapidly and faces all the problems associated with mega-city. Dhaka is situated on flat land surrounded by rivers. The exact sampling location is situated on the roof of Mukarram Hussain Khundkur Science Building, Department of Chemistry, University of Dhaka, Bangladesh.
 (a) (b)
Figure 1. (a) Dhaka city map; (b) Map of Bangladesh.
2.2. Meteorology of the Sampling Location
The climate in Bangladesh is characterized by high temperature and high humidity most of the year with a distinct seasonal variation of precipitation. The year can be divided into four seasons, pre-monsoon (March-May), monsoon (June-September), post monsoon (October-November) and winter (December-February) in Bangladesh [21] . On average, approximately 80% of the yearly rainfall occurs during May to September monsoon. Wind direction in Dhaka city is mainly from west and south-west direction at pre-monsoon, and from north and north-west at winter [22] .
2.3. Particulate Matters Sampling
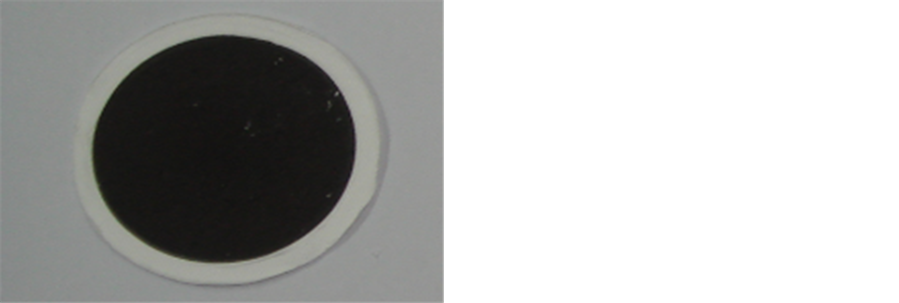
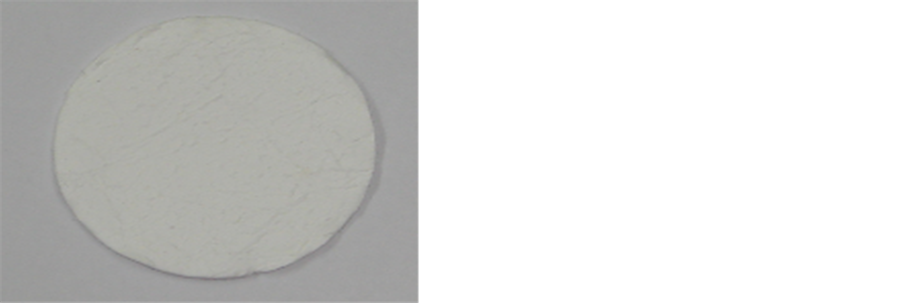
Air sampling is defined as determining quantities and types of atmospheric contaminants by measuring and evaluating a representative sample of air. The most numerous environmental hazards are chemical, ones which can be conveniently divided into a) the particulates and b) the gases or vapours. In filtration process, the air is passed through a filter medium (normally a paper for solid contaminants and a sorbent for gases). The volume of air is measured against the amount of contaminant captured. This gives the concentration, which is expressed either as Nano gram per meter cube (ng∙m−3). Figure 2 is a typical example of the unloaded and loaded filters in Dhaka, Bangladesh. We were collected particulate matters with Gelman, Membrane Filters, Type TISSUQUARTZ, TISSUQUARTZ2500QAT-UP, 47mm diameter for both loaded and unloaded filters.
2.4. Sampling Instruments
The sampling was conducted by filtration technique and particulate sampler SPM machine was used for this sampling. Quartz fibre filters were used for air collection. Filtration sampling, which is actually a combination of filtration/impaction sampling, is the most widely used approach for the collection of atmospheric particulates. Filter-based sampling methods are widely used since filters are relatively low in cost, easily stored, and used for subsequent simple and/or complex analyses of collected SPM. Figure 3 is a flow chart for showing the air fil-
 (a) (b)
Figure 2. Loaded and unloaded filters at MHK Bhavan, Department of Chemistry, Dhaka, Bangladesh from January 2014 to March 2014. (a) 24-hour loaded filter; (b) Unloaded (blank) filter.
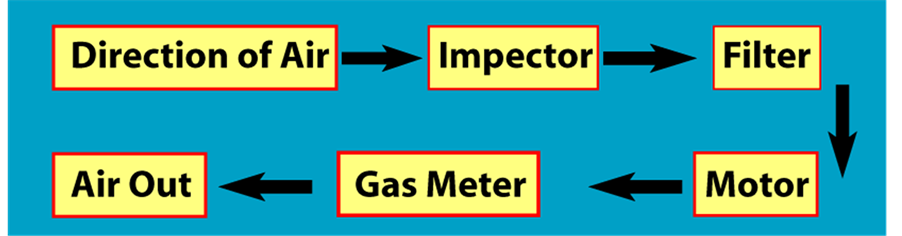
Figure 3. Flow chart of the air filtering system to collect particulate matter.
tering process on the sampling filters.
2.5. Description of Filtering of the Sample
Aerosol samples of SPM were collected daily in Dhaka from January to March in the winter and spring of 2014, using a low volume homemade sampler (Vienna, Austria). All samples were collected on the roof of the Mukarram Hussain Kkundkur Science Building, Department of Chemistry, Dhaka University using Quartz filter paper. The duration time of sampling was about 24-hour. The filters before and after sampling were weighed using an analytical balance with a reading precision 0.10mg after stabilizing under constant temperature (20˚C ± 1˚C). All the procedures were strictly quality controlled to avoid the possible contamination of the samples.
2.6. Conditioning and Weighing of Filters
All the filters that were used to collect sample were kept in a desiccator for 2 hours for conditioning. The weight of the conditioned filters was measured by a microbalance before exposure. The loaded quartz filters were kept in freeze at 4oC until chemical analysis to limit losses of volatile components. To reduce the organic species background level from filters, quartz filters were pre-treated at 800˚C for 200 min and then placed in clean polyethylene Petri dishes. The Petri dishes were kept in the desiccator for two hours and finally stored in a freezer until field measurement. The loaded filters were sent to the Analytical Chemistry Laboratory for trace metals analysis with ICP-MS at the Department of Environment Sciences Informatics and Statistics, CàFoscari University of Venice, Italy.
2.7. Microwave Digestion and Elements Analysis
The half of the filter was digested by microwave digestion system (MARSX CEM Corporation USA) in a Teflon vessel with 8 ml 69% HNO3 and 2 ml H2O2. The sample mixture was digested according to the CEN. EN 14902:2005 standards [23] . The digested solution was diluted to 50 ml with ultrapure water and stored at 4˚C in PTFE bottles. Elemental analysis of As, Cd, Ni, Mn, Cu, Fe, Pb, Zn, Cr, Sb and Se were performed using inductively coupled plasma mass spectrometer (ICP-MS), model: 7700 Agilent, USA. Filter blanks and field blanks (filter kept inside the sampler but not used for air filtering) were prepared and analyzed together with the samples, following the same procedures and the values obtained were routinely subtracted from those of the samples. The limit of detection (LODs) was calculated for each ion and element as the three times the standard deviation of the blank values for each analyzed period, the limit of quantification (LOQ) is the lowest point of the calibration curve. The standards for the calibration curve were obtained by dilution from ICP multi element Standard Solution IV Merk and single element standard of VWR. The quality and accuracy of quantitative analysis were routinely checked analyzing the NIST SRM 1648 standard for air particulate. The recoveries of ions and elements were in the range of 80% - 110%.
3. Result and Discussion
All the collected samples from Dhakawere sent for analyses at the Air Pollution Laboratory, Regional Environmental Protection Agency (ARPAV), Venice, Italy. An inductively coupled plasma mass spectrometer (ICP-MS) was used to determine the concentrations of the trace metals (As, Cd, Cu, Fe, Pb, Zn, Cr, Se, Sb, Ni, Mn). The concentrations of these trace metals with average values have given in Table 1.
3.1. Arsenic
Arsenic (As) and its compounds are ubiquitous in nature and exhibit both metallic and nonmetallic properties. It is a major ground water pollutant in many parts of Bangladesh. Millions of people are affected by As-related diseases in Bangladesh due to contaminated drinking water. It is therefore very important to check the As concentrations in the air of Bangladesh. The total average As concentration found at Dhaka was 3.06 ng∙m−3 varying from 1.50 to 4.20 ng∙m−3 (Table 1), which was about compared than the previously reported concentration (6.3 ng∙m−3) in Dhaka by Salam et al. 2008.The allowable range for Arsenic in the United States was from 1.0 to 3.0 ng∙m−3 for remote areas and 20 - 30 ng∙m−3 for urban areas [24] . In England, the mean concentration was 5.4 ng∙m−3 with a declining trend over the period 1957-1974 [25] . Arsenic in air is present mainly in particulate forms as inorganic arsenic. It is assumed that methylated arsenic is a minor component in the air of suburban, urban and industrial areas, and that the major inorganic portion is a variable mixture of the trivalent and pentavalent forms, the latter being predominant. Particulate arsenic compounds may be inhaled, deposited in the respiratory tract and absorbed into the blood. Arsenic is mostly coming from geogenic sources through it has some

Table 1. Concentration of atmospheric trace metals in the particulate matters in Dhaka, Bangladesh for the period January 2014 to March 2014. All units are in ng∙m−3.
other sources. Arsenic may also introduce in the air of Dhaka city through tobacco smoke and using pesticides containing Arsenic compound. It is estimated that the arsenic content of mainstream cigarette smoke is in the range 40 - 120 ng per cigarette. If consumption is 20 cigarettes per day, the daily intake from this source would amount to 0.8 - 2.4 μg. Moreover around the Dhaka city there are hundreds of Brick industries which also burning arsenic compound containing coal. Unexpectedly high As concentrations (325 ng∙m−3) were also observed at all four sites in Bangkok, Thailand [26] .
3.2. Cadmium
Average Cd concentration was found 6.28 ng∙m−3 varying from 1.8 to 12.9 ng∙m−3 (Table 1). The guideline value for Cadmium by WHO is 5.0 ng∙m−3 which is slightly lower than the average value and may be comparable with our values, but three to fourfold lower than the values reported for other Southeast Asian sites [27] ranging from 0.2 to 34.9 ng∙m−3. The total average of Cd concentration in Dhaka city was 13 ng∙m−3 reported by Salam et al. [28] , which is about two times higher than the current value. The sludge processing is one of the important sources for Cd. This lower value is indicating recent improvement of the sludge processing system in Dhaka city, Bangladesh. Cadmium in ambient air represents the majority of total airborne cadmium. Inputs from different categories of cadmium may affect human Cdintake and human health, but the levels and the transfer mechanisms to humans are substantially different among them. Whereas cadmium from occupational environments and cadmium from cigarette smoke are transferred directly to humans, cadmium in ambient air is generally deposited onto waters or soils, then eventually transferred to plants and animals, and finally enter the human body through the food chain. Cadmium has high toxic effects. It affects kidneys and responsible for accumulating stones in kidneys.
3.3. Nickel
Nickel (Ni) is the 24th most abundant element in the Earth’s crust, comprising about 3% of the composition of the earth. Nickel and nickel compounds have many industrial and commercial uses. Most of the Ni is used for the production of stainless steel and other nickel alloys with high corrosion and temperature resistance. Nickel metal and its alloys are used widely in the metallurgical, chemical and food processing industries, especially as catalysts and pigments. The sources of nickel are the paints and varnishes, dye, building material, electrical equipment and telephone cable, etc. The concentration of nickel is higher than any other location may causes of construction materials, paint and varnishes. Nickel is also uses for the galvanizing of metal plate. This may also be the cause of higher amount of nickel. In this study the average Nickel concentration was 3.77 ng∙m−3 varying from 2.1 to 5.5 ng∙m−3 (Table 1), which is similar to the reported Nickel concentration in many parts of the world. In a remote area of Canadian Arctic, the Ni levels of 0.38 - 0.62 ng∙m−3 were recorded (Hoff and Barrie 1986), as compared to 124.0 ng∙m−3 in the vicinity of a nickel smelter [29] . In northern Norway, a level of about 1.0 ng∙m−3 was recorded in an unpolluted area as compared to about 5.0n gm−3 some 5 km distant from a nickel smelter (average values 1990-1991). The highest recorded value was 64 ng∙m−3 [30] [31] . Concentrations of 18 - 42 ng∙m−3 were recorded in eight United States cities [32] . These values correspond to the average value of 37 ng∙m−3 for 30 United States Urban Air National Surveillance Network Stations for the period 1957-1968. This average decreased from 47 ng∙m−3 for 1957-1960 to 26 ng∙m−3 for 1965-1968. The mean (arithmetic) value for 1970-1974 was 13 ng∙m−3 [33] . Ranges of 10 - 50 ng∙m−3 and 9 - 60 ng∙m−3 have been reported in European cities. Higher values (110 - 180 ng∙m−3) have been reported from heavily industrialized areas [34] . At Islamabad, Pakistan nickel concentration in TSP was 9.0 ng∙m−3 and at Beijing, China nickel concentration in TSP was 51.0 ng∙m−3 [35] . The nickel concentration in TSP at Yamaguchi, Japan was 16.0 ng∙m−3 [36] . The average concentration of nickel observed in the air at Dhaka city is higher than the other Asian cities.
3.4. Copper
The main environmental issues for the primary copper production are the potential emission to air of dust and metals/metal compounds and of sulphur dioxide from roasting and smelting sulphide concentrates or using sulphur-containing fuels or other materials. The average Cu concentration was 11.98 ng∙m−3 varying from 7.0 to 18.9 ng∙m−3 (Table 1). Previously, Salam et al. [28] reported that the average concentration of copper at Dhaka University 31.0 ng∙m−3, which is about two and half times higher than the current finding. The average copper concentration is showing decreasing tendency in Dhaka, the value of on 2003 was 54 ng∙m−3 [21] , which is twofold higher than the 2008 and fivefold higher than the current finding. However, it is a clear indication of decreasing Cu concentration in the air of Dhaka city. The high concentration of Cu (65 ng∙m−3) was also observed at four sites in Bangkok, Thailand [26] .
3.5. Lead
The main sources of lead are combustion of fossil fuels, paints and varnish, production of batteries, lead containing waste water. The average Pb concentration found in this current study 305.75 ng∙m−3 varying from 88.6 to 539 ng∙m−3 (Table 1). Lead compounds accumulate with PM in the atmosphere and gradually settle on the Earth’s surface. Scientists at the Bangladesh Atomic Energy Commission (BAEC) previously observed that Dhaka was the most Pb polluted city in the world for a part of 1996. A 17-month survey conducted by the scientists of BAEC detected 463 ng∙m−3 Pb for PM2.5 in Dhaka air during the dry months (between November 1994 and January 1996) [37] . However, the atmospheric Pb concentration in Dhaka is decreasing gradually, presumably due to the ban on leaded gasoline in Bangladesh, although it is still higher than that found in European cities and Far East Asian sites Taiwan (133 ng∙m−3) [38] . However, it is lower than that reported for Southeast Asian Sites such as Karachi, Pakistan, and Delhi, Mumbai, and Kanpur, India [39] .
3.6. Chromium
Chromium (Cr) is a grey, hard metal most commonly found in the trivalent state in nature. Hexavalent chromium compounds are also found in small quantities. Chromite (FeOCr2O3) is the only ore containing a significant amount of chromium. The ore has not been found in the pure form; its highest grade contains about 55% chromic oxide. Chromium is used in metal alloys and pigments for paints, cement, paper, rubber, and other materials. Due to the lot of tanneries in the vicinity of Dhaka city, chromium is relatively higher in Dhaka city. The concentration of chromium found in this study was 9.2 ng∙m−3 varying from 4.4 to 15.2 ng∙m−3 (Table 1 and Table 2). Information on concentrations of total and speciated chromium in the atmosphere is limited. Measure ments carried out above the North Atlantic, north of latitude 30˚ N, several thousands of kilometers from major land masses, showed concentrations of chromium of 0.07 - 1.1 ng∙m−3 [40] . The concentrations above the South Pole were slightly lower. The following chromium concentrations have also been reported: 0.7 ng∙m−3 in the Shetland Islands and Norway, 0.6 ng∙m−3 in northwest Canada, 1 - 140 ng∙m−3 in continental Europe, 20 - 70 ng∙m−3 in Japan, and 45 - 67 ng∙m−3 in Hawaii [41] . Monitoring of the ambient air during the period of 1977- 1980 in many urban and rural areas of the United States of America showed chromium concentrations ranged
Table 2. Comparison of the average concentration of the determined trace metals with other locations of the world.
aMori et al., 2003; bKhillare et al., 2004; cGoforth et al., 2006; dWanga et al., 2005; eShaheen et al. 2005; fKim et al. 2002; gHarrison et al. 1996.
from 5.2 ng∙m−3 (24-hour background level) to 156.8 ng∙m−3 (urban annual average) with the maximum concentration was about 684 ng∙m−3 (24-hour average). Ranges of chromium levels in Member States of the European Union were given in a survey as follows: remote areas 0 - 3 ng∙m−3; urban areas: 4 - 70 ng∙m−3, and industrial areas 5 - 200 ng∙m−3. From the point of view of toxicity and carcinogenicity, chromium (VI) compounds are of much greater significance for workers and the general population than are trivalent and other valence states of chromium compounds. Therefore, chromium (VI) and chromium (III) have to be considered separately. This is, however, difficult to do when only total chromium is measured.
3.7. Iron (Fe)
Mining activities and other geochemical processes often result in the generation of acid mine drainage (AMD), a phenomenon commonly associated with mining activities. It is generated when pyrite (FeS2) and other sulphide minerals in the aquifer and present and former mining sites are exposed to air and water in the presence of oxidizing bacteria, such as Thiobacillusferrooxidans, and oxidised to produce metal ions, sulphate and acidity. The average Fe concentration found in this study is 2057.0 ng∙m−3varying from 1242 to 3207 ng∙m−3 (Table 1). Iron exhibited relatively higher values because Fe may originate from soil dusts, poorly managed transport, and building construction, among others, the major sources of Fe are both anthropogenic and crustal in origin, including iron and steel manufacturing units and the weathering of exposed Fe in urban areas.
3.8. Manganese (Mn)
Manganese (Mn) is an element widely distributed in the earth’s crust. It is considered to bethe twelfth most abundant element and the fifth most abundant metal. Manganese does not occur naturally in a pure state; oxides, carbonates and silicates are the most important manganese-containing minerals. The most common manganese mineral is pyrolusite (MnO2), usually mined in sedimentary deposits by open-cast techniques. Manganese occurs in most iron ores. Its content in coal ranges from 6.0 to 100 μgg−1; it is also present in crude oil, but at substantially lowers concentrations. The average concentration of Mn found in this study was 42.2 ng∙m−3 varying from 22.2 to 65.1 ng∙m−3 (Table 1), which is slightly higher than the average concentration found in some developed countries of the world. In the Federal Republic of Germany, annual mean concentrations of manganese ranged between 3 and 16 ng∙m−3 in Frankfurt, Main and Munich [42] ; in Belgium over the period 1972-1977, annual mean manganese concentrations of between 42 ng∙m−3 and 456 ng∙m−3were reported [43] . The Environmental Agency of Japan reported an annual mean manganese concentration of about 20 - 800 ng∙m−3 in Japanese cities, with maximum 24-hour concentrations of 2 - 3 μgm−3 [44] .
3.9. Zinc (Zn)
Zinc is an element commonly found in the Earth's crust. It is released to the environment from both natural and anthropogenic sources; however, releases from anthropogenic sources are greater than those from natural sources. The primary anthropogenic sources of zinc in the environment (air, water, soil) are related to mining and metallurgic operations involving zinc and use of commercial products containing zinc. The average value of Zn was 303.3 ng∙m−3 varying from 88.1 to 497.7 ng∙m−3 (Table 1), which is much lower than the value (801 ng∙m−3) obtained at a previous measurement [21] for SPM. Elevated concentrations of Zn have also been observed for other Southeast Asian sites. The Zn concentration at Dhaka was much lower than that at Delhi [39] and Kanpur [45] , India, but much higher than that found in Norway [46] .
3.10. Antimony
Antimony is a silvery-white metal. Antimony oxide is used to produce fire retardants, paints, ceramics and fireworks. Antimony is released to the environment from natural sources and from its industrial processing. In the air, antimony is attached to very small particles. It may stay in the air for many days. The average concentration of Antimony found 5.47 ng∙m−3 varying from 1.5 to 10.7 ng∙m−3 (Table 1), which is slightly lower than the average value found in various cities of USA and higher than United Kingdom. In Chicago, the concentrations of antimony in air ranging from 1.4 to 55 ng∙m−3 with an average value of 32 ng∙m−3 whereas somewhat lower levels (0.4 to 4 ng∙m−3) were reported from seven different sites in the United Kingdom [47] .
3.11. Selenium
Selenium is commonly found as selenide minerals in rocks that also contain sulphides of silver, copper, lead, and nickel―and in other forms in water and dry soils. Selenium is used in electronic and photographic equipment, glass, pigments, rubber, pesticides, dietary supplements, and livestock and poultry feed. Trace amounts of selenium are present in coal and oil. When electric utilities burn these fuels at their power plants, selenium is released in very small amounts. Selenium is released into the air by soils as they erode in wind. Breathing large amounts of selenium dust can irritate the lungs, and cause headaches and dizziness. In this study the average concentration of Selenium was found 2.43 ng∙m−3varying from 1.2 to 3.4 ng∙m−3 (Table 1). It is satisfactory to say that the level of selenium in the air of Dhaka city is very relatively low. There is no previous measurement for selenium in atmosphere of Dhaka so far as we know.
3.12. Comparison of the Trace Metals in Dhaka with Other Cities of the World
The highest average concentrations for the measured trace elements were observed for iron, followed by lead, Zinc, Manganese, copper, Chromium, Cadmium, Antimony, Nickel, Arsenic, Selenium. Compared with other South Asian cities the determined concentrations of trace elements at urban Dhaka exhibited typically lower levels for some trace elements than observed in Lahore, Pakistan and Calcutta, India but for some trace elements it exhibited much higher values (Table 2). The average arsenic concentration in Dhaka is 3.06 ng∙m−3 below the orientation value of the German TA-Luft of 13 ng∙m−3 (German TA-Luft). Still, the average arsenic concentration in Dhaka is lower than at other south Asian polluted cities such as, Lahore, Mumbai and Calcutta. Average cadmium concentrations were close to the WHO [19] guideline value (5 ng∙m−3) for the annual mean. The trace metal concentration in Dhaka is relatively low compared than other south East Asian cities―maybe there are not many metal processing industries in and around Dhaka city. But the concentration levels may be higher at other cities in Bangladesh with many metal and steel manufacturing industries e.g., Chittagong.
3.13. Correlation Factor
Correlation coefficient is a measure of the linear correlation between two variables and giving a value between +1 and −1. Where 1 is total positive correlation, 0 is no correlation, and −1 is the total negative correlation. It is widely used in the sciences as a measure of the degree of linear dependences between two variables. However, the correlation factor for various metals were derived and shown in the Table 3. As for the metal to metal corre- lation Manganese is highly correlated with Nickel (r2 = 0.84), Iron (r2 = 0.97) and Copper (r2 = 0.86). Zinc is correlated with Cadmium (r2 = 0.77), Chromium with Zinc (r2 = 0.65), Iron with Nickel (r2 = 0.84), Antimony with Arsenic (r2 = 0.92), Selenium with Arsenic (r2 = 0.73) and Antimony (r2 = 0.66), Lead with Arsenic (r2 =
Table 3. Correlation coefficient of various metals with metals (r2 ≥ 0.65 is in bold).
0.79) and Antimony (r2 = 0.78) indicating a common source of these metals as also manifested in strong correlations.
3.14. Enrichment Factor (EF)
Iron is a major constituent in the earth crust but also immaterial derived from the crust such as soil dust, road dust, dust from construction activities, etc., and also coal fly ash. The relative amount of Fe in the earth crusts is 5.0% m/m [48] . In dust from soil, shale, and other crust-related material the Fe content is not far from the crustal abundance. Also the inorganic material in coal is crust-related. The average Fe content in coal fly ash (total emitted dust) is around 8.5% m/m [49] . To roughly separate trace elements from crustal and non-crustal sources, crustal enrichment factors (EFs) were applied to the results. In Table 3 the enrichment factors were derived for the Dhaka urban aerosol (averages) relative to the composition of the earth crust and of coal fly ash using Fe as the reference element. The enrichment factor (EF) [50] is defined as the double ratio of the concentration of the determined element (X) to that of Fe in aerosol and in the reference sources e.g. earth crust or coal fly ash.

By convention, an arbitrary average EF value < 10 indicates that a trace element in particulate matter has a significant crustal source, and in contrast, an EF value of >10 is considered as a significant proportion of an element with a non-crustal source [51] . The enrichment factors of trace element with respect to the levels of the
crustal enrichments are presented in Table 4. Cd, Pb and Zn are crustal elements (EF < 10) and others are non crustal elements (EF > 10). Non-crustal elements associated with particulate matter near the highways mostly come from vehicle emissions [52] [53] . Concentrations of some trace elements (Cd, Pb, Zn) are considerably enriched in relation to the crustal abundances. The combustion of coal is the source for Cd, Cu, Pb and Zn, while tire rubber abrasion and brakes are found to be major contributors to Cd, Pb, Cu and Zn in the ambient air near high-traffic zones [54] . Zn could come from multiple sources, such as vehicle emissions, tire tread [55] [56] , diesel soot, oil industries and coal combustion [57] . However, similarities are found between the abundance of most elements relative to coal fly ash. In particular EFs for the aerosol relative to coal fly ash for Cd, Cu, Pb, Zn, are not too far from one (within a factor of around 5, Table 4). The EF for As is 4 and for Cu is 5 relative to earth crust, and for coal 0 and 2 pointing to a potential geogenic as well as anthropogenic source. The highest enrichment factor for Cd, Pb, Zn showed that they are not from geogenic sources but they really introduced into the environment from anthropogenic sources such as coal fly ash.
4. Conclusion
People from all over the world are concerned more about the air pollution aspects due to the increased rate of mortality and morbidity and also multifarious affects of particulate pollution on our environment. In this regard it is imperative to have a systematic study ascertaining the facts concerning the nature, sources, and trends of the particulate pollution in city Dhaka. This study was undertaken especially to look into these aspects. During the study period it was found that the average concentration of some metals viz. Fe, Pb, Zn, Cu to be of higher order can most likely be attributed to rapid development, increased vehicle emissions to the atmosphere, and to the
Table 4. Enrichment factor [50] analysis for the selected trace metals in Dhaka, Bangladesh.
Enrichment factors “EF” (reference element Fe) for Dhaka urban aerosol relative to earth crust and to coal fly ash.
lack of sophisticated management of wastes and effluents from factories. Although for some metals like Ni, Cu, Se, Sb contamination is not as severe as in other developed cities of the world. Metals like Fe, Zn, Se, Pb, Cu showed strong inter correlations indicating isogenic source in nature, whereas As, Cd, Ni are neither correlated with any metal indicating different sources of emission. Enrichment factor analysis also enabled to identify the actual sources for the metals. Enrichment factors based on Fe as a reference element indicate that coal combustion is a major contributor to Fe, Cu, Pb and Zn in the Dhaka particulate matters. The comparison study also presents an alarming picture of airborne trace metals in Dhaka city. Therefore, it is high time to develop an air pollution abatement strategy to protect people from the hazardous effects arising from elevated atmospheric trace metal levels by the systematic study of air pollution.
Acknowledgements
Authors acknowledge the Department of Environment Sciences Informatics and Statistics, CàFoscari University of Venice, Italy for helping with chemical analysis. Authors also acknowledge the help of Md. Halim during Sampling.
References
- Tsai, Y.I. and Cheng, M.T. (2004) Characterization of Chemical Species in Atmospheric Aerosols in a Metropolitan Basin. Chemosphere, 54, 1171-1181. http://dx.doi.org/10.1016/j.chemosphere.2003.09.021
- Park, S.S. and Kim, Y.J. (2005) Source Contributions to Fine Particulate Matter in an Urban Atmosphere. Chemosphere, 59, 217-226. http://dx.doi.org/10.1016/j.chemosphere.2004.11.001
- Watson, J.G., Zhu, T., Chow, J.C., Engelbrecht, J., Fujita, E.M. and Wilson, W.E. (2002) Receptor Modelling Application Framework for Particle Source Apportionment. Chemosphere, 49, 1093-1136. http://dx.doi.org/10.1016/S0045-6535(02)00243-6
- Quiterio, S.L., da Silva, C.R.S., Arbilla, G. and Escaleira, V. (2004) Metals in Airborne Particulate Matter in the Industrial District of Santa Cruz, Rio de Janeiro, in an Annual Period. Atmospheric Environment, 38, 321-331. http://dx.doi.org/10.1016/j.atmosenv.2003.09.017
- Arditsoglou, A. and Samara, C. (2005) Levels of Total Suspended Particulate Matter and Major Trace Elements in Kosovo: A Source Identification and Apportionment Study. Chemosphere, 59, 669-678. http://dx.doi.org/10.1016/j.chemosphere.2004.10.056
- Shah, M.H. (2009) Atmospheric Particulate Matter: Trace Metals and Size Fractionation. VDM Verlag Dr. Muller, Saarbrucken, 228.
- Shaheen, N., Shah, M.H. and Jaffar, M. (2005) A Study of Airborne Selected Metals and Particle Size Distribution in Relation to Climatic Variables and Their Source Identification. Water, Air, and Soil Pollution, 164, 275-294. http://dx.doi.org/10.1007/s11270-005-3542-1
- Callen, M.S., de la Cruz, M.T., Lopez, J.M., Navarro, M.V. and Mastral, A.M. (2009) Comparison of Receptor Models for Source Apportionment of the PM10 in Zaragoza (Spain). Chemosphere, 76, 1120-1129. http://dx.doi.org/10.1016/j.chemosphere.2009.04.015
- Prieditis, H. and Adamson, I.Y.R. (2002) Comparative Pulmonary Toxicity of Various Soluble Metals Found in Urban Particulate Dusts. Experimental Lung Research, 28, 563-576. http://dx.doi.org/10.1080/01902140290096782
- Magas, O.K., Gunter, J.T. and Regens, J.L. (2007) Ambient Air Pollution and Daily Pediatric Hospitalizations for Asthma. Environmental Science and Pollution Research, 14, 19-23. http://dx.doi.org/10.1065/espr2006.08.333
- Wild, P., Bourgkard, E. and Paris, C. (2009) Lung Cancer and Exposure to Metals: The Epidemiological Evidence. Method Molecular Biology, 472, 139-167. http://dx.doi.org/10.1007/978-1-60327-492-0_6
- Dreher, K.L., Jaskot, R.H., Lehmann, J.R., Richards, J.H., McGee, J.K., Ghio, A.J. and Costa, D.L. (1997) Soluble Transition Metals Mediate Residualoil Fly Ash Induced Acute Lung Injury. Journal of Toxicology Environmental Health, 50, 285-305.
- Schaumann, F., Borm, P.J., Herbrich, A., Knoch, J., Pitz, M., Schins, R.P., Luettig, B., Hohlfeld, J.M., Heinrich, J. and Krug, N. (2004) Metal-Rich Ambient Particles (Particulate Matter 2.5) Cause Airway Inflammation in Healthy Subjects. American Journal of Respiratory and Critical Care Medicine, 170, 898-903. http://dx.doi.org/10.1164/rccm.200403-423OC
- Schwarze, P.E., Totlandsdal, A., Herseth, I.J., Holme, A.J., Låg, M., Refsnes, M., Øvrevik, J., Sandberg, W. and Bøl- ling, K.A. (2010) Importance of Components and Sources for Health Effects of Particulate Air Pollution. Vanda Villanyi.
- Gurgueira, S.A., Lawrence, J., Coull, B., Murthy, G.G. and Gonzalez-Flecha, B. (2002) Rapid Increases in the Steady- State Concentration of Reactive Oxygen Species in the Lungs and Heart after Particulate Air Pollution Inhalation. Environmental Health Perspective, 110, 749-755. http://dx.doi.org/10.1289/ehp.02110749
- Bell, L.M., Ebisu, K., Peng, D.R., Samet, M.J. and Dominici, F. (2009) Hospital Admissions and Chemical Composition of Fine Particle Air Pollution. American Journal of Respiratory and Critical Care Medicine, 179, 1115-1120. http://dx.doi.org/10.1164/rccm.200808-1240OC
- Fiaz, A. and Strum, P.J. (2000) New Directions: Air Pollutions and Road Traffic in Developing Countries. Atmospheric Environment, 34, 4745-4746. http://dx.doi.org/10.1016/S1352-2310(00)00255-7
- Salam, A., Al Mamoon, H., Ullah, M.B. and Ullah, S.M. (2012) Measurement of the Atmospheric Aerosol Particle Size Distribution in a Highly Polluted Mega-City in Southeast Asia (Dhaka-Bangladesh). Atmospheric Environment, 59, 338-343. http://dx.doi.org/10.1016/j.atmosenv.2012.05.024
- WHO (2000) Cadmium. Air Quality Guidelines for Europe, 2nd Edition, World Health Organization Regional Office for Europe, Copenhagen.
- Rahman, M.A., Rahim, A., Siddique, N.A. and Alam, A.M.S. (2013) Studies on Selected Metals and Other Pollutants in Urban Atmosphere in Dhaka Bangladesh. Dhaka University Journal of Science, 61, 41-46. http://dx.doi.org/10.3329/dujs.v61i1.15094
- Salam, A., Bauer, H., Kassin, K., Ullah, S.M. and Puxbaum, H. (2003) Aerosol Chemical Characteristics of a Mega- City in Southeast Asia (Dhaka-Bangladesh). Atmospheric Environment, 37, 2517-2528. http://dx.doi.org/10.1016/S1352-2310(03)00135-3
- Salam, A., Ullah, M.B., Islam, M.D., Salam, M.A. and Ullah, S.M. (2011) Carbonaceous Species in Total Suspended Particulate Matters at Different Urban and Suburban Locations in the Greater Dhaka Region, Bangladesh. Air Quality, Atmosphere and Health, 6, 239-245. http://dx.doi.org/10.1007/s11869-011-0166-z
- CEN (2005) Ambient Air Quality-Standard Gravimetric Measurement Method for the Determination of the PM2.5 Mass Fraction of Suspended Particulate Matter. EN 14907:2005.
- Mondol, M.N., Khaled, M., Chamon, A.S. and Ullah, S.M. (2014) Trace Metal Concentration in Atmospheric Aerosols in Some City Areas of Bangladesh. Bangladesh Journal of Scientific and Industrial Research, 49, 263-270.
- Huang, X.D., Olmez, I., Aras, N.K. and Gordon, G.E. (1994) Emissions of Trace Elements from Motor Vehicles: Potential Marker Elements and Source Composition Profile. Atmospheric Environment, 28, 1385-1391. http://dx.doi.org/10.1016/1352-2310(94)90201-1
- Chuersuwan, N., Nimrat, S., Lekphet, S. and Kerdkumrai, T. (2008) Levels and Major Sources of PM2.5 and PM10 in Bangkok Metropolitan Region. Environment International, 34, 671-677.
- Sharma, V.K. and Patil, R.S. (1992) Chemical Composition and Source Identification of Bombay Aerosol. Environmental Technology, 13, 1043-1052. http://dx.doi.org/10.1080/09593339209385241
- Salam, A., Hossain, T., Siddique, M.N.A. and Alam, A.M.S. (2008) Characteristics of Atmospheric Trace Gases, Particulate Matter, and Heavy Metal Pollution in Dhaka, Bangladesh. Air Quality Atmosphere Health, 1, 101-109. http://dx.doi.org/10.1007/s11869-008-0017-8
- Chan, W.H and Lusis, M.A. (1986) Smelting Operations and Trace Metals in Air and Precipitation in the Sudbury Basin. Advances in Environmental Science and Technology, 17, 113-143.
- Norseth, T. (1994) Environmental Pollution around Nickel Smelters in the Kola Peninsula (Russia). Science of the Total Environment, 148, 103-108. http://dx.doi.org/10.1016/0048-9697(94)90389-1
- Sivertsen, B. (1991) Air Pollution in the Border Areas of Norway/Soviet Union January 1990-March 1991. Lillestrøm, Norwegian Institute for Air Research, (NILU OR: 69/91; Ref:0-8976). Analytik, Institut fur Anorganische und AngewandteChemie, Universit at Hamburg, Germany.
- Saltzman, B.E., Cholak, J. and Schafer, L.J. (1985) Concentrations of Six Metals in the Air of Eight Cities. Environmental Science and Technology, 19, 328-333. http://dx.doi.org/10.1021/es00134a004
- Schmidt, J.A. and Andren, A.W. (1990) The Atmospheric Chemistry of Nickel. In: Nriagu, J.O., Ed., Nickel in the Environment, Vol. 1999, Wiley, New York, 93-137.
- Bennett, B.J. (1994) Environmental Nickel Pathways to Man. In: Sunderman Jr., F.W., Ed., Nickel in the Human Environment, Lyon International Agency for Research on Cancer, Lyon, 487-495.
- Smith, D.J.T., Harrison, R.M., Luhana, L., Pio, C.A., Castro, L.M., Tariq, M.N., Hayat, S. and Quraishi, T. (1996) Concentrations of Particulate Airborne Polycyclic Aromatic Hydrocarbons and Metals Collected in Lahore, Pakistan. Atmospheric Environment, 30, 4031-4040. http://dx.doi.org/10.1016/1352-2310(96)00107-0
- Mori, I., Nishikawa, M., Tanimura, T. and Quan, H. (2003) Change in Size Distribution and Chemical Composition of Kosa (Asian Dust) Aerosol during Long Range Transport. Atmospheric Environment, 37, 4253-4263. http://dx.doi.org/10.1016/S1352-2310(03)00535-1
- Khaliquzzaman, M., Biswas, S.K., Tarafdar, S.A., Islam, A. and Khan, A.H. (1997) Trace Element Composition of Size Fractionated Airborne Particulate Matter in Urban and Rural Areas in Bangladesh. Report, Accelerator Facilities Division and Chemistry Division, Atomic Energy Centre, Dhaka.
- Fung, Y.S. and Wong, L.W.Y. (1995) Apportionment of Air Pollution Sources by Receptor Models in Hong Kong. At- mospheric Environment, 29, 2041-2048. http://dx.doi.org/10.1016/1352-2310(94)00239-H
- Balachandran, S., Meena, B.R. and Khillare, P.S. (2000) Particle Size Distribution and Its Elemental Composition in the Ambient Air of Delhi. Environment International, 26, 49-54. http://dx.doi.org/10.1016/S0160-4120(00)00077-5
- Duce, R.A., Hoffman, G.L. and Zoller, W.H. (1975) Atmospheric Trace Metals at Remote Northern and Southern He- misphere sites. Pollution or Natural Science, 187, 59-61.
- Bowen, H.J.M. (1979) Environmental Chemistry of the Elements. Academic Press, London.
- Georgii, H.W. and Müller, J. (2004) Schwermetallaerosole in der Großstadtluft (Heavy Metal). In: Godish, T., Ed., Air Quality, 4th Edition.
- Kretzschmar, J.G., Delespaul, I. and De Rijck, T. (1980) Heavy Metal Levels in Belgium: A Five Year Survey. Science of the Total environment, 14, 85-97. http://dx.doi.org/10.1016/0048-9697(80)90128-X
- Wang, X.L., Sato, T., Xing, B.S., Tamamura, S. and Tao, S. (2005) Source Identification, Size Distribution and Indica- tor Screening of Airborne Trace Metals in Kanazawa, Japan. Aerosol Science, 36, 197-210. http://dx.doi.org/10.1016/j.jaerosci.2004.08.005
- Sharma, M. and Maloo, S. (2005) Assessment of Ambient Air PM10 and PM2.5 and Characterization of PM10 in the City of Kanpur, India. Atmospheric Environment, 39, 6015-6026. http://dx.doi.org/10.1016/j.atmosenv.2005.04.041
- NILU (Norwegian Institute of Air Research) (2002) Heavy Metals and POPS within the EMEP Region 2000. Report -EMEP/CCC-9/ 2002, Norwegian Institute of Air Research, Kjeller.
- Goforth, M.R. and Christoforou, C.S. (2006) Particle Size Distribution and Atmospheric Metals Measurements in a Rural Area in the South Eastern USA. Science of the Total Environment, 217-227. http://dx.doi.org/10.1016/j.scitotenv.2005.03.017
- Mason, B. and Moore, C. (1982) Principles of Geochemistry. Wiley, New York.
- Steiger, M. (1991) Die anthropogenen und natürlichen Quellenurbaner und mariner Aerosol charakterisiert und quantifiziertdurch Multielementanalyse und chemische Receptormodelle, Schriftenreihe Angewandte.
- Puxbaum, H. (1993) Luftchemie. Schriftenreihe “Modern Analytical Chemie,” Band 5. Institutfür Analytical Chemie, Technische Universät Wien.
- Chester, R., Nimmo, M. and Preston, M.R. (1999) The Trace Metal Chemistry of Atmospheric Dry Deposition Samples Collected at Cap Ferrat: A Coastal Site in the Western Mediterranean. Marine Chemistry, 68, 15-30. http://dx.doi.org/10.1016/S0304-4203(99)00062-6
- Weckwerth, G. (2001) Verification of Traffic Emitted Aerosol Components in the Ambient Air of Cologne (Germany). Atmospheric Environment, 35, 5525-5536. http://dx.doi.org/10.1016/S1352-2310(01)00234-5
- Sternbeck, J., Sjodin, A.A. and Andersson, K. (2002) Metal Emissions from Road Traffic and the Influence of Resuspension-Results from Two Tunnel Studies. Atmospheric Environment, 36, 4735-4744. http://dx.doi.org/10.1016/S1352-2310(02)00561-7
- Singh, M., Jaques, P.A. and Sioutas, C. (2002) Size Distribution and Diurnal Characteristics of Particle-Bound Metals in Source and Receptor Sites of the Los Angeleles Basin. Atmospheric Environment, 36, 1675-1689. http://dx.doi.org/10.1016/S1352-2310(02)00166-8
- Rogge, W.F., Hildemann, L.M., Mazurek, M.A., Cass, G.R. and Simoneit, B.R.T. (1993) Sources of Fine Organic Ae- rosols: 3 Road Dust, Tire Debris, and Organometallic Brake Lining Dust: Roads as Sources and Sinks. Environmental Science and Technology, 27, 1892-1904. http://dx.doi.org/10.1021/es00046a019
- Nriagu, J.O. and Pacyna, J.M. (1988) Quantitative Assessment of Worldwide Contamination of Air, Water and Soils by Trace Metals. Nature, 333, 134-199. http://dx.doi.org/10.1038/333134a0
- Pacyna, J.M. (1998) Source Inventories for Atmospheric Trace Metals. In: Harrison, R.M. and van Grieken, R.E., Eds., Atmospheric Particles, IUPAC Series on Analytical and Physical Chemistry of Environmental Systems, Vol. 5, Wiley, Chichester, 385-423.
NOTES

*Corresponding author.