 Open Journal of Physical Chemistry, 2013, 3, 189-200 Published Online November 2013 (http://www.scirp.org/journal/ojpc) http://dx.doi.org/10.4236/ojpc.2013.34023 Open Access OJPC Proton Exchange in Water/Mycelium System: Transdisciplinary Out-of-Equilibrium Thermodynamic Approach Using Potentiometric Titration Vicente R. de Almeida, Bruno Szpoganicz Equlibrium Laboratory, Chemistry Department, Universidade Federal de Santa Catarina, Florianópolis, Brazil Email: vicentebra@hotmail.com Received October 26, 2013; revised November 19, 2013; accepted November 26, 2013 Copyright © 2013 Vicente R. de Almeida, Bruno Szpoganicz. This is an open access article distributed under the Creative Commons Attribution License, which permits unrestricted use, distribution, and reproduction in any medium, provided the original work is properly cited. ABSTRACT In this study, we used potentiometric titration to investigate the interaction of the saprophytic fungus Trametes villosa in an aqueous environment. The study of this biological complex system allowed us to observe the evolution of out-of- equilibrium hydrogen ion potential states after systematic perturbations. The responses of the complex system to per- turbations were interpreted from relations that provided qualitative response patterns for mycelium in agreement with their basic structural and organizational characteristics. We consider this to be a transdisciplinary example of the be- havior of general systems with thermodynamic properties of great ecological relevance, being specifically related to the negentropic properties of heterogeneous systems. Keywords: Transdisciplinarity; Fungi; Proton Exchange; Out-of-Equilibrium Thermodynamics; pH; Ecological Relations 1. Introduction While the importance of water in biosphere development is recognized, the complex aspects of the relations be- tween (in)organic systems and water require broad and intense scientific transdisciplinary study [1,2]. Many modern problems such as those associated with the envi- ronment and public health are intimately related to eco- system responses to perturbations. In this regard, culture appears to be of primary importance in human-environ- ment interrelations [3-5], but in this context, in our view, ecosystem studies (e.g. soil and water dynamics) and the development of viable monitoring techniques play the role of clarifying the effects of many human cultural practices on natural emergence or the evolution of natu- ral systems. A great number of different cultures have contributed to these clarifications since the beginnings of human knowledge development. Among them is the re- cent development of the modern thermodynamics and out-of-equilibrium theories [6]. Considering that any natural system can be understood as a dynamic system with free energy in an out-of-equi- librium space-time state (such as the solar system or a living cell and its neighborhood), it seems reasonable to interpret the problems and study the subject placed in question in this work—with the clarity of theoretical/em- pirical/technical/methodological limitations and without neglecting other disciplinary, cultural, political and socio- economical points of view—from the thermodynamic perspective of forces and fluxes that compose energy. The simple example of great systemic relevance which we will approach in this work is the study of proton ex- change between mycelium (the somatic structure of fun- gus) and water. As previously mentioned, the idealization and realization of this work form part of a body of wide and deep epistemological reflections, in an attempt to bring scientific questions closer to or fuse them with lo- cal/global issues related to different cultures and human societies (dependent and determinant players in the evo- lution of natural systems). Specifically, in this study, we will approach the physical-chemical aspects of myce- lium/water interactions which involve a vast web of other implications, some of which will be discussed herein. 2. Theoretical Background An appropriate starting point is to explain the picture we 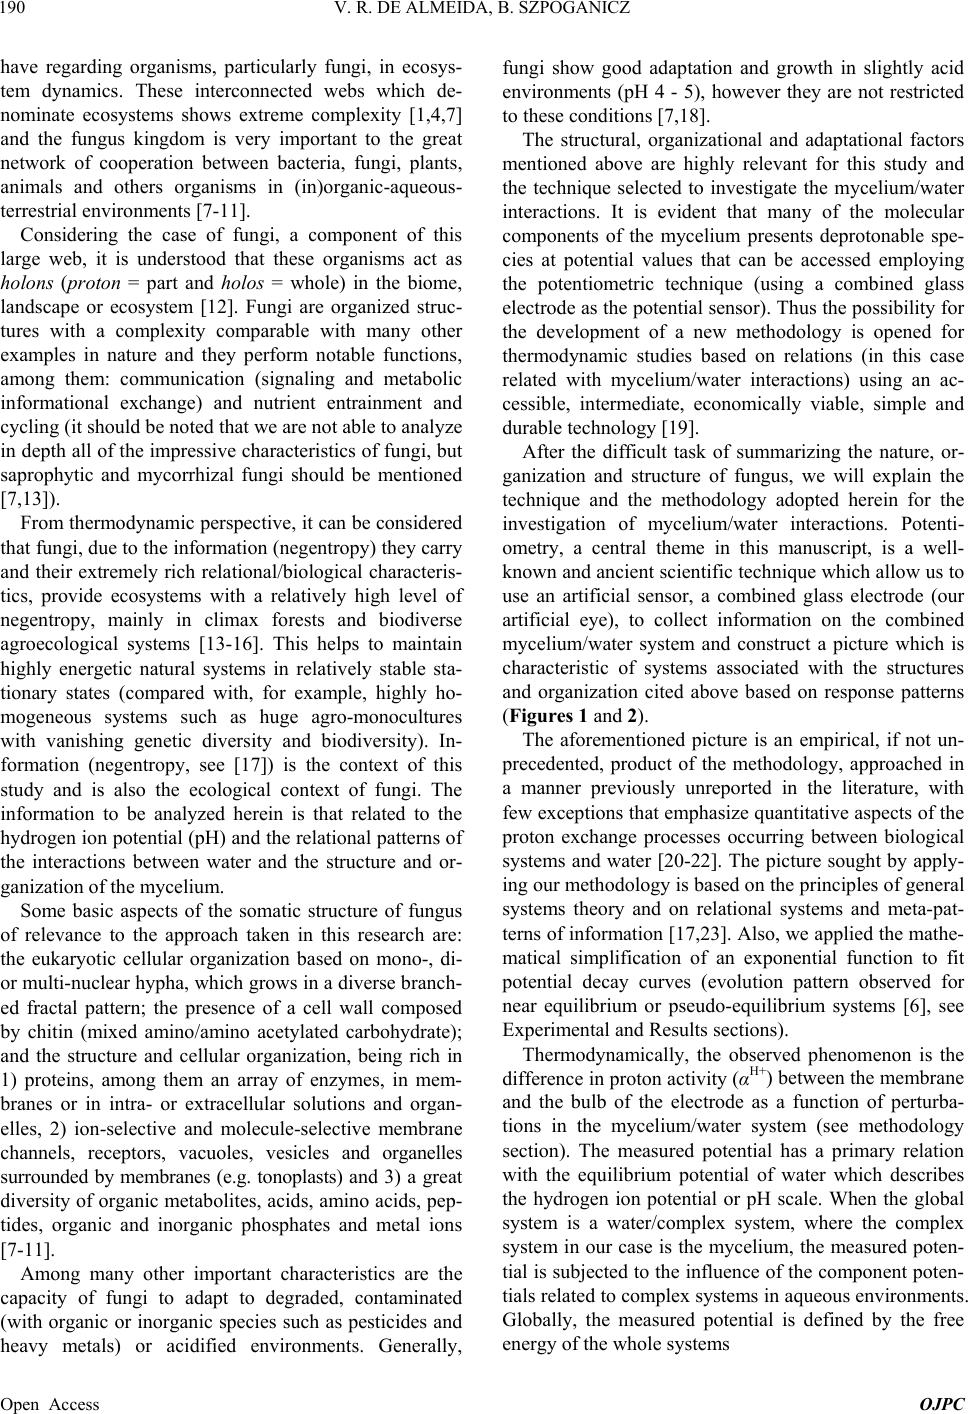 V. R. DE ALMEIDA, B. SZPOGANICZ 190 have regarding organisms, particularly fungi, in ecosys- tem dynamics. These interconnected webs which de- nominate ecosystems shows extreme complexity [1,4,7] and the fungus kingdom is very important to the great network of cooperation between bacteria, fungi, plants, animals and others organisms in (in)organic-aqueous- terrestrial environments [7-11]. Considering the case of fungi, a component of this large web, it is understood that these organisms act as holons (proton = part and holos = whole) in the biome, landscape or ecosystem [12]. Fungi are organized struc- tures with a complexity comparable with many other examples in nature and they perform notable functions, among them: communication (signaling and metabolic informational exchange) and nutrient entrainment and cycling (it should be noted that we are not able to analyze in depth all of the impressive characteristics of fungi, but saprophytic and mycorrhizal fungi should be mentioned [7,13]). From thermodynamic perspective, it can be considered that fungi, due to the information (negentropy) they carry and their extremely rich relational/biological characteris- tics, provide ecosystems with a relatively high level of negentropy, mainly in climax forests and biodiverse agroecological systems [13-16]. This helps to maintain highly energetic natural systems in relatively stable sta- tionary states (compared with, for example, highly ho- mogeneous systems such as huge agro-monocultures with vanishing genetic diversity and biodiversity). In- formation (negentropy, see [17]) is the context of this study and is also the ecological context of fungi. The information to be analyzed herein is that related to the hydrogen ion potential (pH) and the relational patterns of the interactions between water and the structure and or- ganization of the mycelium. Some basic aspects of the somatic structure of fungus of relevance to the approach taken in this research are: the eukaryotic cellular organization based on mono-, di- or multi-nuclear hypha, which grows in a diverse branch- ed fractal pattern; the presence of a cell wall composed by chitin (mixed amino/amino acetylated carbohydrate); and the structure and cellular organization, being rich in 1) proteins, among them an array of enzymes, in mem- branes or in intra- or extracellular solutions and organ- elles, 2) ion-selective and molecule-selective membrane channels, receptors, vacuoles, vesicles and organelles surrounded by membranes (e.g. tonoplasts) and 3) a great diversity of organic metabolites, acids, amino acids, pep- tides, organic and inorganic phosphates and metal ions [7-11]. Among many other important characteristics are the capacity of fungi to adapt to degraded, contaminated (with organic or inorganic species such as pesticides and heavy metals) or acidified environments. Generally, fungi show good adaptation and growth in slightly acid environments (pH 4 - 5), however they are not restricted to these conditions [7,18]. The structural, organizational and adaptational factors mentioned above are highly relevant for this study and the technique selected to investigate the mycelium/water interactions. It is evident that many of the molecular components of the mycelium presents deprotonable spe- cies at potential values that can be accessed employing the potentiometric technique (using a combined glass electrode as the potential sensor). Thus the possibility for the development of a new methodology is opened for thermodynamic studies based on relations (in this case related with mycelium/water interactions) using an ac- cessible, intermediate, economically viable, simple and durable technology [19]. After the difficult task of summarizing the nature, or- ganization and structure of fungus, we will explain the technique and the methodology adopted herein for the investigation of mycelium/water interactions. Potenti- ometry, a central theme in this manuscript, is a well- known and ancient scientific technique which allow us to use an artificial sensor, a combined glass electrode (our artificial eye), to collect information on the combined mycelium/water system and construct a picture which is characteristic of systems associated with the structures and organization cited above based on response patterns (Figures 1 and 2). The aforementioned picture is an empirical, if not un- precedented, product of the methodology, approached in a manner previously unreported in the literature, with few exceptions that emphasize quantitative aspects of the proton exchange processes occurring between biological systems and water [20-22]. The picture sought by apply- ing our methodology is based on the principles of general systems theory and on relational systems and meta-pat- terns of information [17,23]. Also, we applied the mathe- matical simplification of an exponential function to fit potential decay curves (evolution pattern observed for near equilibrium or pseudo-equilibrium systems [6], see Experimental and Results sections). Thermodynamically, the observed phenomenon is the difference in proton activity (αH+) between the membrane and the bulb of the electrode as a function of perturba- tions in the mycelium/water system (see methodology section). The measured potential has a primary relation with the equilibrium potential of water which describes the hydrogen ion potential or pH scale. When the global system is a water/complex system, where the complex system in our case is the mycelium, the measured poten- tial is subjected to the influence of the component poten- tials related to complex systems in aqueous environments. Globally, the measured potential is defined by the free energy of the whole systems Open Access OJPC 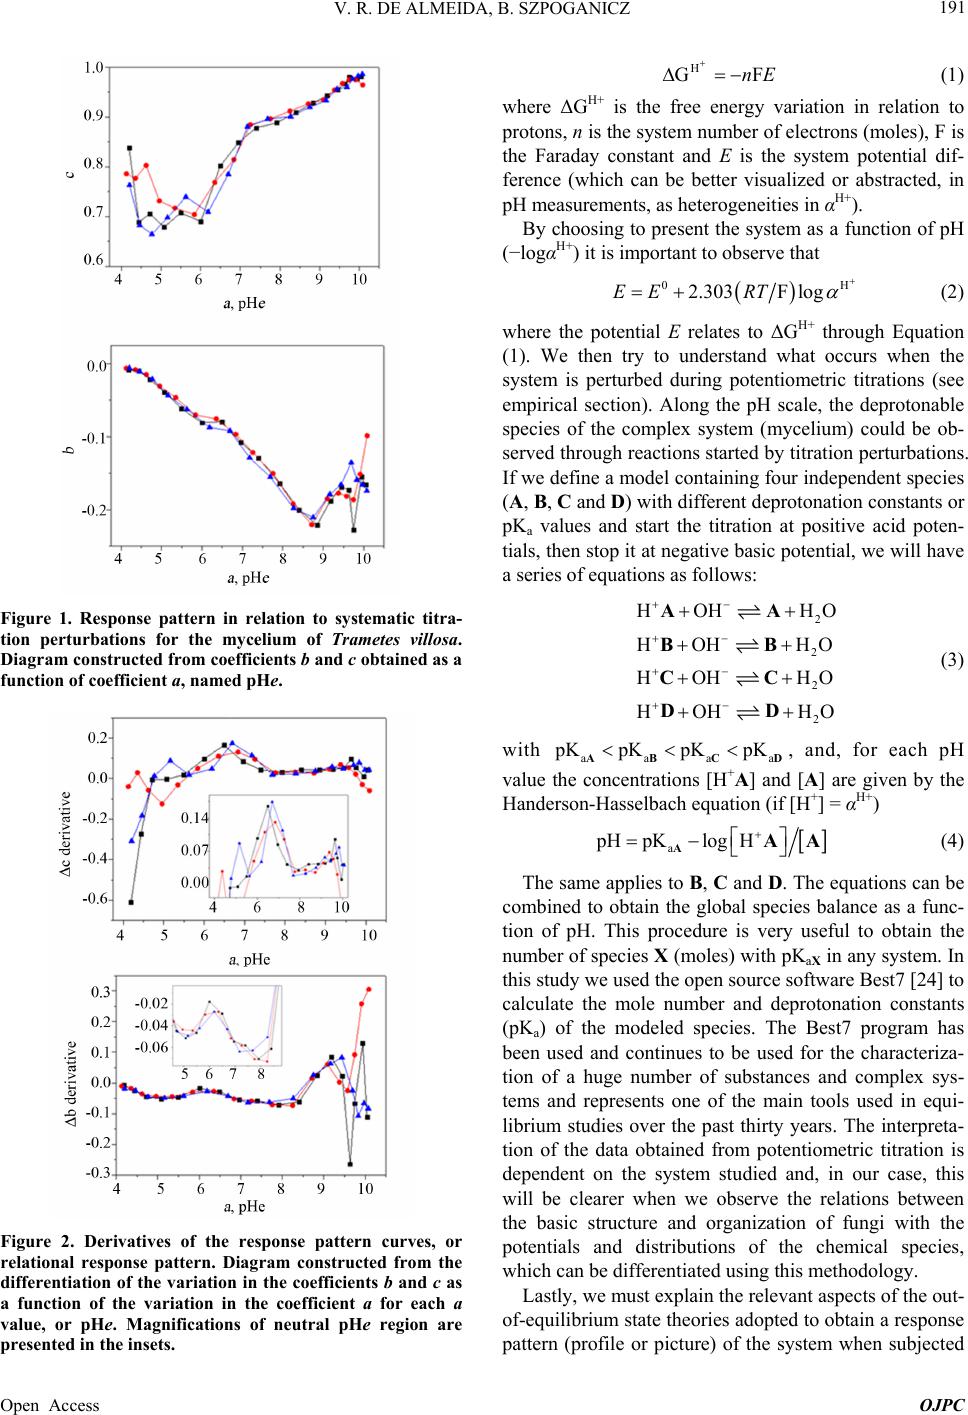 V. R. DE ALMEIDA, B. SZPOGANICZ 191 Figure 1. Response pattern in relation to systematic titra- tion perturbations for the mycelium of Trametes villosa. Diagram constructed from coefficients b and c obtained as a function of coefficient a, named pHe. Figure 2. Derivatives of the response pattern curves, or relational response pattern. Diagram constructed from the differentiation of the variation in the coefficients b and c as a function of the variation in the coefficient a for each a value, or pHe. Magnifications of neutral pHe region are presented in the insets. H GnE F (1) where ΔGH+ is the free energy variation in relation to protons, n is the system number of electrons (moles), F is the Faraday constant and E is the system potential dif- ference (which can be better visualized or abstracted, in pH measurements, as heterogeneities in αH+). By choosing to present the system as a function of pH (−logαH+) it is important to observe that 02.303F logEE RT (2) where the potential E relates to ΔGH+ through Equation (1). We then try to understand what occurs when the system is perturbed during potentiometric titrations (see empirical section). Along the pH scale, the deprotonable species of the complex system (mycelium) could be ob- served through reactions started by titration perturbations. If we define a model containing four independent species (A, B, C and D) with different deprotonation constants or pKa values and start the titration at positive acid poten- tials, then stop it at negative basic potential, we will have a series of equations as follows: 2 2 2 2 HOH H HOH HO HOH HO HOHH AA BB CC DD O O a (3) with aaa KpKpKpK ABCD , and, for each pH value the concentrations [H+A] and [A] are given by the Handerson-Hasselbach equation (if [H+] = αH+) a pHpKlogH AAA (4) The same applies to B, C and D. The equations can be combined to obtain the global species balance as a func- tion of pH. This procedure is very useful to obtain the number of species X (moles) with pKaX in any system. In this study we used the open source software Best7 [24] to calculate the mole number and deprotonation constants (pKa) of the modeled species. The Best7 program has been used and continues to be used for the characteriza- tion of a huge number of substances and complex sys- tems and represents one of the main tools used in equi- librium studies over the past thirty years. The interpreta- tion of the data obtained from potentiometric titration is dependent on the system studied and, in our case, this will be clearer when we observe the relations between the basic structure and organization of fungi with the potentials and distributions of the chemical species, which can be differentiated using this methodology. Lastly, we must explain the relevant aspects of the out- of-equilibrium state theories adopted to obtain a response pattern (profile or picture) of the system when subjected Open Access OJPC  V. R. DE ALMEIDA, B. SZPOGANICZ 192 to perturbations during potentiometric titration. Primordial theoretical definitions are coherent with the evolution of non-equilibrium systems as observed below. The mycelium system responses to perturbations ob- served during the experiments presented behavior ho- mologous to thermodynamic near pseudo-equilibrium (or stationary states) systems. The main feature shared by these systems is the characteristic evolution of the per- turbed state toward maximum entropy, generally evolve- ing to a stationary state through deceleration of the en- tropy production, consuming free energy generated by perturbation. This evolution normally shows a potential (free energy) decay profile from the perturbed state to- ward the nearest stationary state. It is interesting to note that if the perturbation is too intense, that is, beyond the system response capacity, the system could collapse and will probably evolve to another system with distinct characteristics [6], which is not exactly our case as we shall see. Formally, the evolution of out-of-equilibrium systems can be defined through entropy function, S. At near pseudo-equilibrium, or stationary state, the system tends to produce entropy at a value that tends to a maximum and then enters the stationary state. As we know that en- tropy variation can be defined by the sum of the internal entropy variation of the system (diS) and external entropy variation of the neighborhood (deS), we have ie SSdddS (5) where, after perturbation with , eS0d iS0d The system evolution to the nearest stationary state, as a function of evolution coordinate, time (t), is given by iSddt0 (6) and the entropy function, S, can be defined by the Taylor series [6] 2 eq SS SS2 (7) It is important to highlight that in the thermodynamic formalization of this work, the combined mycelium/wa- ter system is composed of the mycelium defined as the internal system and water defined as the external neighborhood. Finally, the entropy variation will be po- tentiometrically observed as a function of the evolution coordinate t, time, by combining Equations (1), (2) and (4) with the following equation: H i GTd S (8) where T is the absolute temperature in degrees Kelvin. System responses (diS) to neighborhood perturbations (deS) by strong base additions evolve in appreciable agreement with near pseudo-equilibrium thermodynamic systems (see Figure 3 and [6]). Theoretical considerations and correlations with the phenomena addressed will become clearer with the for- mal methodological description and, in our interpretation, this work deals with important aspects of transdiscipli- narity in physical-chemistry and ecology, both in terms of research and in the pedagogical context of science, based on the subject of interactive study (such as bio- logical structures) and simple experiments which are presented herein. 3. Experimental Section: Materials and Methods 3.1. Complex System For this study, which involves the thermodynamic and ecological aspects of biology, the mycelium (somatic Figure 3. Potential stabilization curves selected to demon- strate the variation in the system response in relation to perturbations with KOH (0.05 mL 0.0971 mol·L−1) addition. The values for coefficients a, b and c were used to fit the po- tential decay curves with the asymptotic function of Equa- tion (9). Open Access OJPC 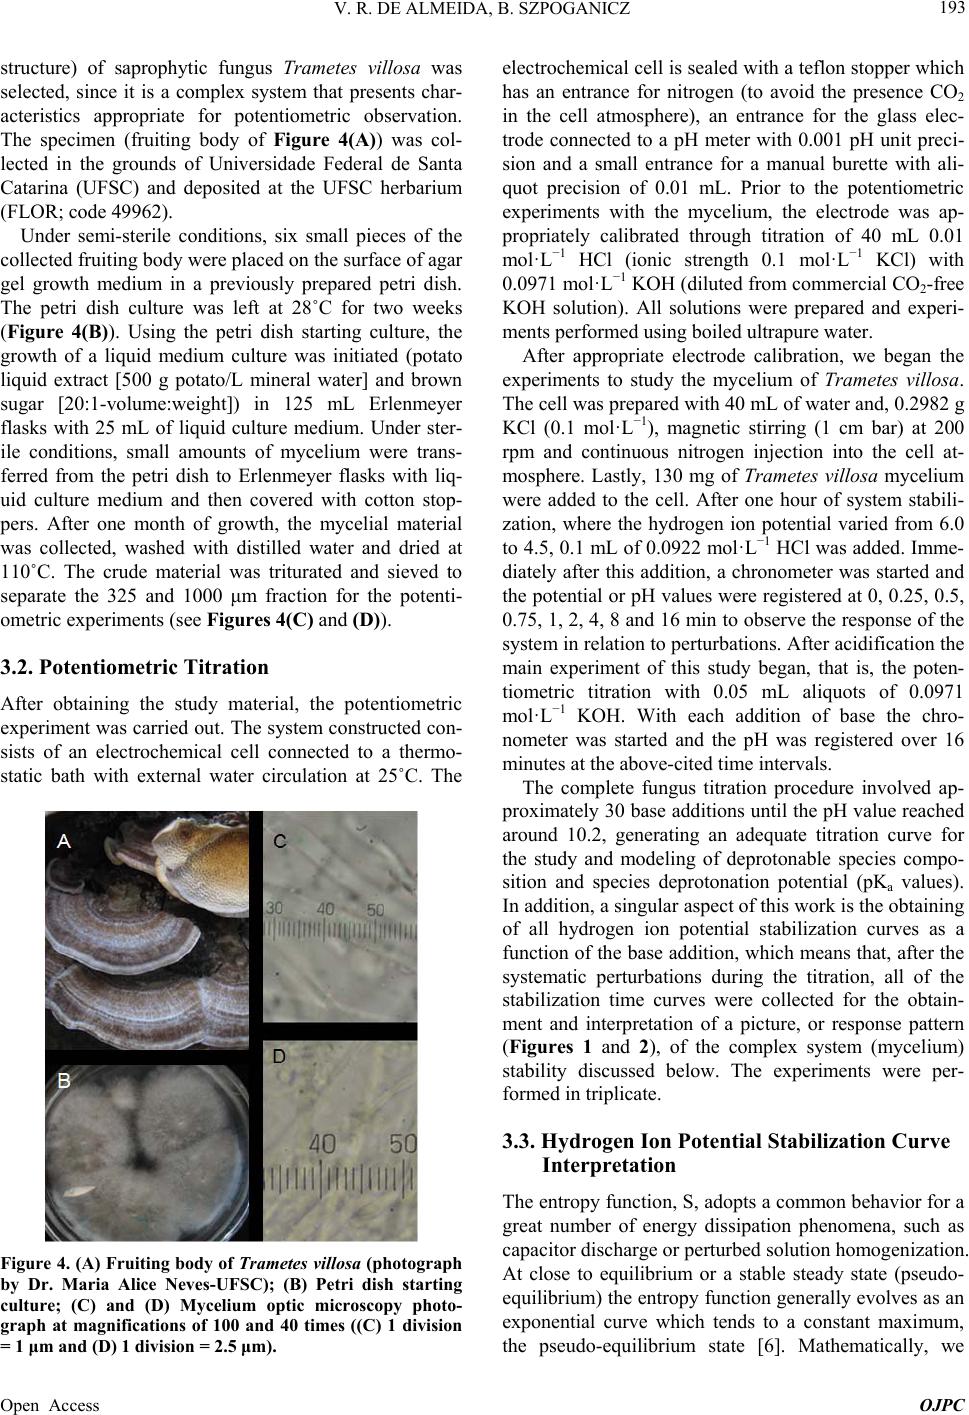 V. R. DE ALMEIDA, B. SZPOGANICZ 193 structure) of saprophytic fungus Trametes villosa was selected, since it is a complex system that presents char- acteristics appropriate for potentiometric observation. The specimen (fruiting body of Figure 4(A)) was col- lected in the grounds of Universidade Federal de Santa Catarina (UFSC) and deposited at the UFSC herbarium (FLOR; code 49962). Under semi-sterile conditions, six small pieces of the collected fruiting body were placed on the surface of agar gel growth medium in a previously prepared petri dish. The petri dish culture was left at 28˚C for two weeks (Figure 4(B)). Using the petri dish starting culture, the growth of a liquid medium culture was initiated (potato liquid extract [500 g potato/L mineral water] and brown sugar [20:1-volume:weight]) in 125 mL Erlenmeyer flasks with 25 mL of liquid culture medium. Under ster- ile conditions, small amounts of mycelium were trans- ferred from the petri dish to Erlenmeyer flasks with liq- uid culture medium and then covered with cotton stop- pers. After one month of growth, the mycelial material was collected, washed with distilled water and dried at 110˚C. The crude material was triturated and sieved to separate the 325 and 1000 μm fraction for the potenti- ometric experiments (see Figures 4(C) and (D)). 3.2. Potentiometric Titration After obtaining the study material, the potentiometric experiment was carried out. The system constructed con- sists of an electrochemical cell connected to a thermo- static bath with external water circulation at 25˚C. The Figure 4. (A) Fruiting body of Trametes villosa (photograph by Dr. Maria Alice Neves-UFSC); (B) Petri dish starting culture; (C) and (D) Mycelium optic microscopy photo- graph at magnifications of 100 and 40 times ((C) 1 division = 1 μm and (D) 1 division = 2.5 μm). electrochemical cell is sealed with a teflon stopper which has an entrance for nitrogen (to avoid the presence CO2 in the cell atmosphere), an entrance for the glass elec- trode connected to a pH meter with 0.001 pH unit preci- sion and a small entrance for a manual burette with ali- quot precision of 0.01 mL. Prior to the potentiometric experiments with the mycelium, the electrode was ap- propriately calibrated through titration of 40 mL 0.01 mol · L −1 HCl (ionic strength 0.1 mol·L−1 KCl) with 0.0971 mol·L−1 KOH (diluted from commercial CO2-free KOH solution). All solutions were prepared and experi- ments performed using boiled ultrapure water. After appropriate electrode calibration, we began the experiments to study the mycelium of Trametes villosa. The cell was prepared with 40 mL of water and, 0.2982 g KCl (0.1 mol·L−1), magnetic stirring (1 cm bar) at 200 rpm and continuous nitrogen injection into the cell at- mosphere. Lastly, 130 mg of Trametes villosa mycelium were added to the cell. After one hour of system stabili- zation, where the hydrogen ion potential varied from 6.0 to 4.5, 0.1 mL of 0.0922 mol·L−1 HCl was added. Imme- diately after this addition, a chronometer was started and the potential or pH values were registered at 0, 0.25, 0.5, 0.75, 1, 2, 4, 8 and 16 min to observe the response of the system in relation to perturbations. After acidification the main experiment of this study began, that is, the poten- tiometric titration with 0.05 mL aliquots of 0.0971 mol · L −1 KOH. With each addition of base the chro- nometer was started and the pH was registered over 16 minutes at the above-cited time intervals. The complete fungus titration procedure involved ap- proximately 30 base additions until the pH value reached around 10.2, generating an adequate titration curve for the study and modeling of deprotonable species compo- sition and species deprotonation potential (pKa values). In addition, a singular aspect of this work is the obtaining of all hydrogen ion potential stabilization curves as a function of the base addition, which means that, after the systematic perturbations during the titration, all of the stabilization time curves were collected for the obtain- ment and interpretation of a picture, or response pattern (Figures 1 and 2), of the complex system (mycelium) stability discussed below. The experiments were per- formed in triplicate. 3.3. Hydrogen Ion Potential Stabilization Curve Interpretation The entropy function, S, adopts a common behavior for a great number of energy dissipation phenomena, such as capacitor discharge or perturbed solution homogenization. At close to equilibrium or a stable steady state (pseudo- equilibrium) the entropy function generally evolves as an exponential curve which tends to a constant maximum, the pseudo-equilibrium state [6]. Mathematically, we Open Access OJPC 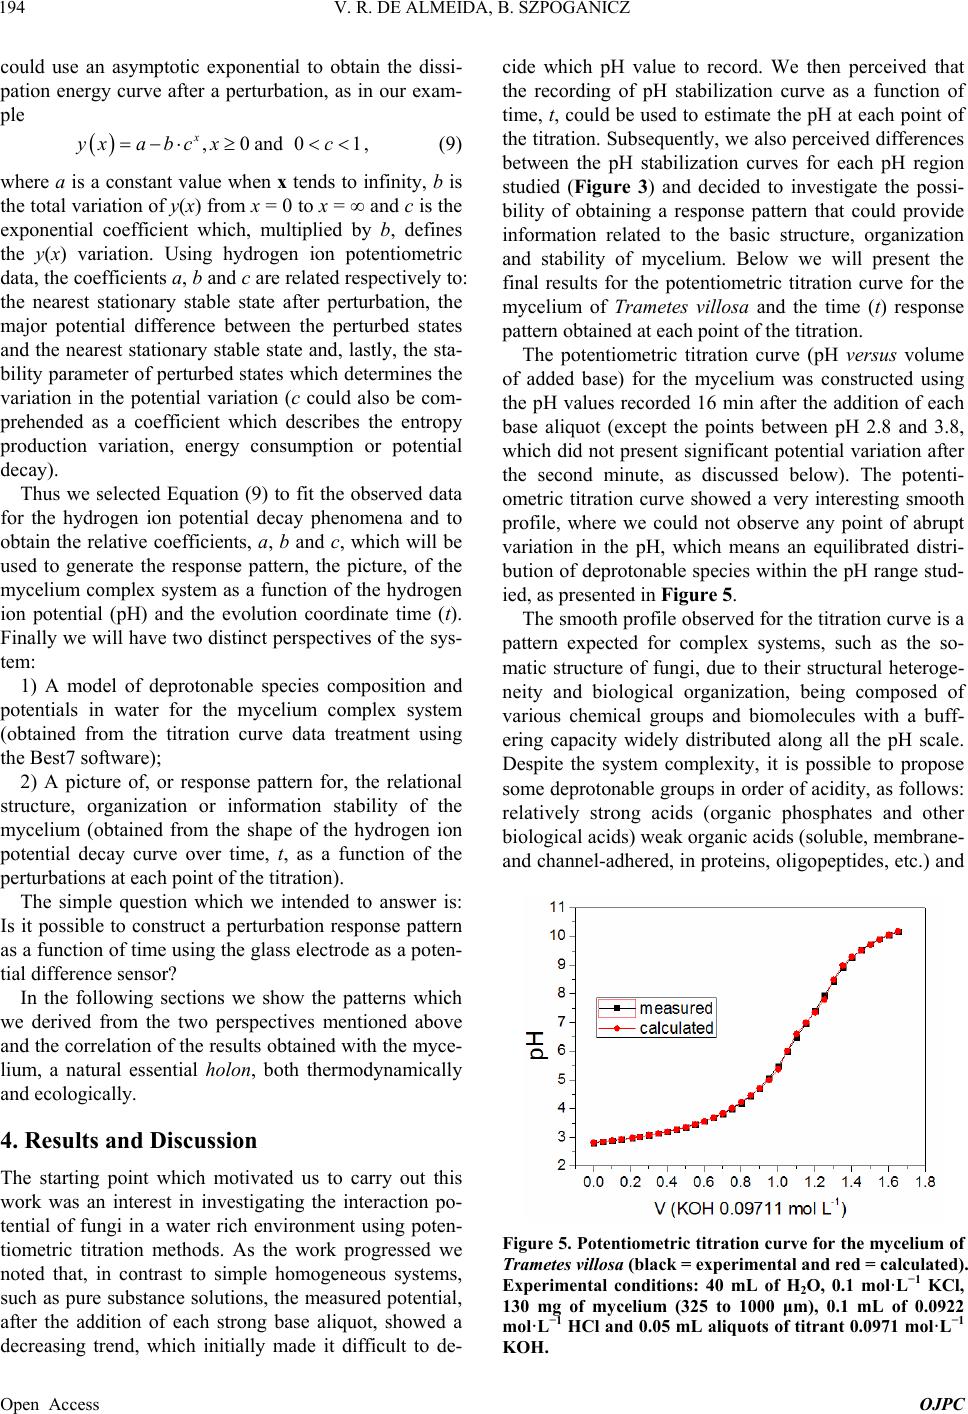 V. R. DE ALMEIDA, B. SZPOGANICZ 194 could use an asymptotic exponential to obtain the dissi- pation energy curve after a perturbation, as in our exam- ple ,0and0 x yxa bc xc1, (9) where a is a constant value when x tends to infinity, b is the total variation of y(x) from x = 0 to x = ∞ and c is the exponential coefficient which, multiplied by b, defines the y(x) variation. Using hydrogen ion potentiometric data, the coefficients a, b and c are related respectively to: the nearest stationary stable state after perturbation, the major potential difference between the perturbed states and the nearest stationary stable state and, lastly, the sta- bility parameter of perturbed states which determines the variation in the potential variation (c could also be com- prehended as a coefficient which describes the entropy production variation, energy consumption or potential decay). Thus we selected Equation (9) to fit the observed data for the hydrogen ion potential decay phenomena and to obtain the relative coefficients, a, b and c, which will be used to generate the response pattern, the picture, of the mycelium complex system as a function of the hydrogen ion potential (pH) and the evolution coordinate time (t). Finally we will have two distinct perspectives of the sys- tem: 1) A model of deprotonable species composition and potentials in water for the mycelium complex system (obtained from the titration curve data treatment using the Best7 software); 2) A picture of, or response pattern for, the relational structure, organization or information stability of the mycelium (obtained from the shape of the hydrogen ion potential decay curve over time, t, as a function of the perturbations at each point of the titration). The simple question which we intended to answer is: Is it possible to construct a perturbation response pattern as a function of time using the glass electrode as a poten- tial difference sensor? In the following sections we show the patterns which we derived from the two perspectives mentioned above and the correlation of the results obtained with the myce- lium, a natural essential holon, both thermodynamically and ecologically. 4. Results and Discussion The starting point which motivated us to carry out this work was an interest in investigating the interaction po- tential of fungi in a water rich environment using poten- tiometric titration methods. As the work progressed we noted that, in contrast to simple homogeneous systems, such as pure substance solutions, the measured potential, after the addition of each strong base aliquot, showed a decreasing trend, which initially made it difficult to de- cide which pH value to record. We then perceived that the recording of pH stabilization curve as a function of time, t, could be used to estimate the pH at each point of the titration. Subsequently, we also perceived differences between the pH stabilization curves for each pH region studied (Figure 3) and decided to investigate the possi- bility of obtaining a response pattern that could provide information related to the basic structure, organization and stability of mycelium. Below we will present the final results for the potentiometric titration curve for the mycelium of Trametes villosa and the time (t) response pattern obtained at each point of the titration. The potentiometric titration curve (pH versus volume of added base) for the mycelium was constructed using the pH values recorded 16 min after the addition of each base aliquot (except the points between pH 2.8 and 3.8, which did not present significant potential variation after the second minute, as discussed below). The potenti- ometric titration curve showed a very interesting smooth profile, where we could not observe any point of abrupt variation in the pH, which means an equilibrated distri- bution of deprotonable species within the pH range stud- ied, as presented in Figure 5. The smooth profile observed for the titration curve is a pattern expected for complex systems, such as the so- matic structure of fungi, due to their structural heteroge- neity and biological organization, being composed of various chemical groups and biomolecules with a buff- ering capacity widely distributed along all the pH scale. Despite the system complexity, it is possible to propose some deprotonable groups in order of acidity, as follows: relatively strong acids (organic phosphates and other biological acids) weak organic acids (soluble, membrane- and channel-adhered, in proteins, oligopeptides, etc.) and Figure 5. Potentiometric titration curve for the mycelium of Trametes villosa (black = experimental and red = calculated). Experimental conditions: 40 mL of H2O, 0.1 mol·L−1 KCl, 130 mg of mycelium (325 to 1000 μm), 0.1 mL of 0.0922 mol·L−1 HCl and 0.05 mL aliquots of titrant 0.0971 mol·L−1 KOH. Open Access OJPC 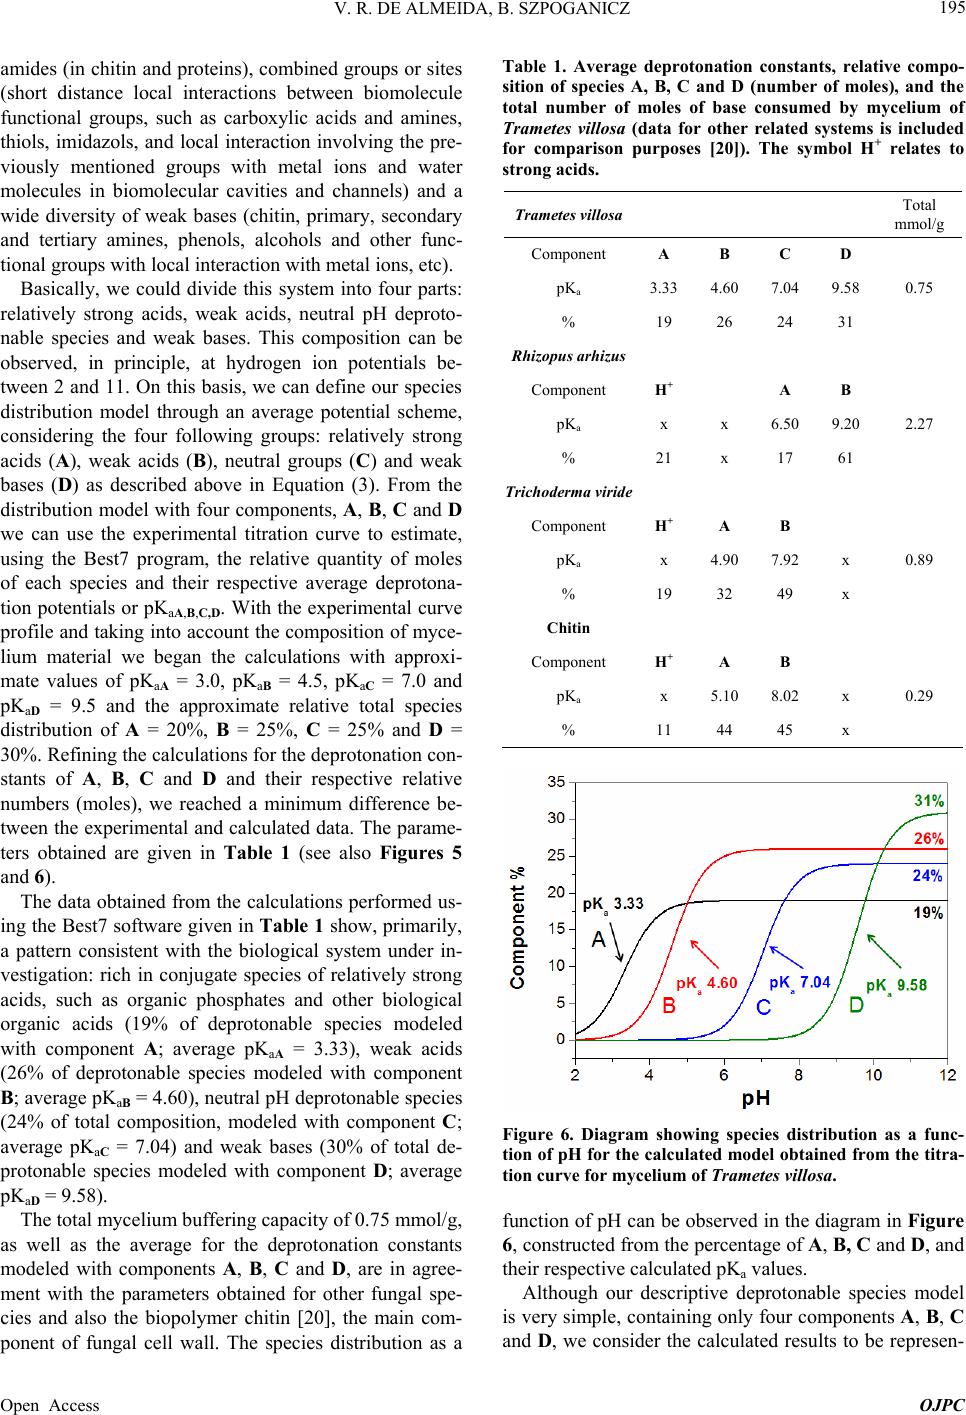 V. R. DE ALMEIDA, B. SZPOGANICZ 195 amides (in chitin and proteins), combined groups or sites (short distance local interactions between biomolecule functional groups, such as carboxylic acids and amines, thiols, imidazols, and local interaction involving the pre- viously mentioned groups with metal ions and water molecules in biomolecular cavities and channels) and a wide diversity of weak bases (chitin, primary, secondary and tertiary amines, phenols, alcohols and other func- tional groups with local interaction with metal ions, etc). Basically, we could divide this system into four parts: relatively strong acids, weak acids, neutral pH deproto- nable species and weak bases. This composition can be observed, in principle, at hydrogen ion potentials be- tween 2 and 11. On this basis, we can define our species distribution model through an average potential scheme, considering the four following groups: relatively strong acids (A), weak acids (B), neutral groups (C) and weak bases (D) as described above in Equation (3). From the distribution model with four components, A, B, C and D we can use the experimental titration curve to estimate, using the Best7 program, the relative quantity of moles of each species and their respective average deprotona- tion potentials or pKaA,B,C,D. With the experimental curve profile and taking into account the composition of myce- lium material we began the calculations with approxi- mate values of pKaA = 3.0, pKaB = 4.5, pKaC = 7.0 and pKaD = 9.5 and the approximate relative total species distribution of A = 20%, B = 25%, C = 25% and D = 30%. Refining the calculations for the deprotonation con- stants of A, B, C and D and their respective relative numbers (moles), we reached a minimum difference be- tween the experimental and calculated data. The parame- ters obtained are given in Table 1 (see also Figures 5 and 6). The data obtained from the calculations performed us- ing the Best7 software given in Table 1 show, primarily, a pattern consistent with the biological system under in- vestigation: rich in conjugate species of relatively strong acids, such as organic phosphates and other biological organic acids (19% of deprotonable species modeled with component A; average pKaA = 3.33), weak acids (26% of deprotonable species modeled with component B; average pKaB = 4.60), neutral pH deprotonable species (24% of total composition, modeled with component C; average pKaC = 7.04) and weak bases (30% of total de- protonable species modeled with component D; average pKaD = 9.58). The total mycelium buffering capacity of 0.75 mmol/g, as well as the average for the deprotonation constants modeled with components A, B, C and D, are in agree- ment with the parameters obtained for other fungal spe- cies and also the biopolymer chitin [20], the main com- ponent of fungal cell wall. The species distribution as a Table 1. Average deprotonation constants, relative compo- sition of species A, B, C and D (number of moles), and the total number of moles of base consumed by mycelium of Trametes villosa (data for other related systems is included for comparison purposes [20]). The symbol H+ relates to strong acids. Trametes villosa Total mmol/g Component A B C D pKa 3.33 4.60 7.04 9.58 0.75 % 19 26 24 31 Rhizopus arhizus Component H+ A B pKa x x 6.50 9.20 2.27 % 21 x 17 61 Trichoderma viride Component H+ A B pKa x 4.90 7.92 x 0.89 % 19 32 49 x Chitin Component H+ A B pKa x 5.10 8.02 x 0.29 % 11 44 45 x Figure 6. Diagram showing species distribution as a func- tion of pH for the calculated model obtained from the titra- tion curve for mycelium of Trametes villosa. function of pH can be observed in the diagram in Figure 6, constructed from the percentage of A, B, C and D, and their respective calculated pKa values. Although our descriptive deprotonable species model is very simple, containing only four components A, B, C and D, we consider the calculated results to be represen- Open Access OJPC  V. R. DE ALMEIDA, B. SZPOGANICZ 196 tative and close to the experimental results (see Figure 5). Also, these results elucidate the subject under study, that is, the composition of a complex system, in particular, the deprotonable species present. These are revealing aspects of the interaction between fungi and environment conditions in pseudo-equilibrium with water and, ulti- mately, they are relevant in terms of the thermodynamic and ecological relations that these interactions could im- ply. It is important to note that most studies on fun- gus/water interactions involving the potentiometric titra- tion technique adopt simple descriptive models, normally using two components, weak acids and weak bases, and strong acids (labeled as H+ in Table 1) [20,21]. In this work, using four components to model the sys- tem allowed us to obtain relative data for relatively strong acids and neutral pH deprotonable species (com- ponents A and C, respectively). This possibility increases the elucidative character of our methodology to investi- gate the contribution of acid species and neutral pKa spe- cies to the characteristics of biological systems, for ex- ample, the relatively strong soluble acids exuded by fungi in natural environments and the neutral active sites of hydrolytic enzymes, catalytic cavities, mixed sites with the interaction of multiple functional groups or biomolecular semi-isolated environments with localized hydrogen ion potential. Clearly, with only the titration curve data and calculations, we could not address in- depth the molecular specificities. Therefore, we will try to correlate our results with the basic aspects of the boil- ogy and molecular biochemistry of fungi. In the mi- cro-structural arrangement of fungi, chitin is the major component of the cell wall of the hyphae (filaments that form the network of mycelium branches, see Figures 4(C) and (D)), and proteins and oligopeptides (adhered to membranes, channels, cavities and vesicles, as structural components or in solution) are also components present in large quantities in this complex, organized and coher- ent fungal system. The basic structural, relational-organizational charac- teristics of fungi systems (a huge research focus in varied disciplines including membrane biology and complex biological networks [7,10,25]) could be studied using our methodology, initially through the observation of the complete system titration curve (Figure 5) and posteri- orly through the investigation of the time (t) response pattern of the hydrogen ion potential at each point of the titration. Once all of the potential stabilization curves had been collected for each point of the titration, it was pos- sible to observe differences in the responses to perturba- tions with 0.05 mL of 0.0971 mol·L−1 KOH (see meth- odology section) within the pH range studied. The re- sponses to perturbations showed similar patterns to those of pseudo-equilibrium systems, as reported in theoretical section, which can be explained in a simple way. Firstly, since the variation in free energy, at constant pressure and temperature, is a function of the concentra- tion variation and chemical potentials [6], we assume that the potential variation is dominated by diffusion proc- esses and liquid proton fluxes between the internal com- plex system (mycelium) and its neighborhood (water). The observed differences in the potential decay profiles (see Figures 1-3) were interpreted as differences in the accessibility of the system protons to its neighborhood. For example, substances such as soluble acids, amino acids or phosphates will probably present higher rates of pH stabilization and faster homogenization of the proton concentration (between mycelium and water) when com- pared with proteins adhered to membranes or the interior of vesicles and organelles, or deprotonable groups in the cavities of supramolecular biological structures, among other heterogeneous subsystems with a large store of biological relational information. Secondly, the terms, ‘heterogeneity of accessibility’ and ‘heterogeneity of potential decay velocity’, were here comprehended as system information (free energy or negentropy), which varies as a function of the evolu- tion coordinate, time (t), after a perturbation, which re- veals the relative stability of the system organization. The total potential variation and the variation in the po- tential variation of the mycelium/water system under out-of-pseudo-equilibrium conditions are represented by the coefficients b and c of the asymptotic exponential function (equation 9), which was chosen to describe the temporal evolution of the hydrogen ion potential function. The greater the total potential decay (the higher coeffi- cient b modulus value) and the lesser the variation in the potential variation (with coefficient c tending to 1) the greater the relative stability of systems subjected to per- turbations will be. On the other hand, the lower the coef- ficient b modulus value and lower the value of c (tending to zero) the lower the relative stability of systems sub- jected to perturbations will be. The values for the total potential variation and the variation in the potential variation could be obtained from the first and the second derivatives of Equation (9) at any x (time) value, as we can see in the Taylor series for the entropy function (S) in Equation (7). Although the coefficients a, b and c, of each curve did not offer molecular elucidations regarding the system studied, the pattern for the relation between coefficients a, b and c, obtained during the potentiomet- ric titration provided us with a picture, a response pattern related to the system organization mentioned above. Let us look at the following results. In Figure 3 we show three potential decay curves se- lected to demonstrate the observed differences in the curve shape at each point of the potentiometric titration after KOH addition. For each curve we obtained the val- ues for the coefficients a, b and c and constructed the Open Access OJPC 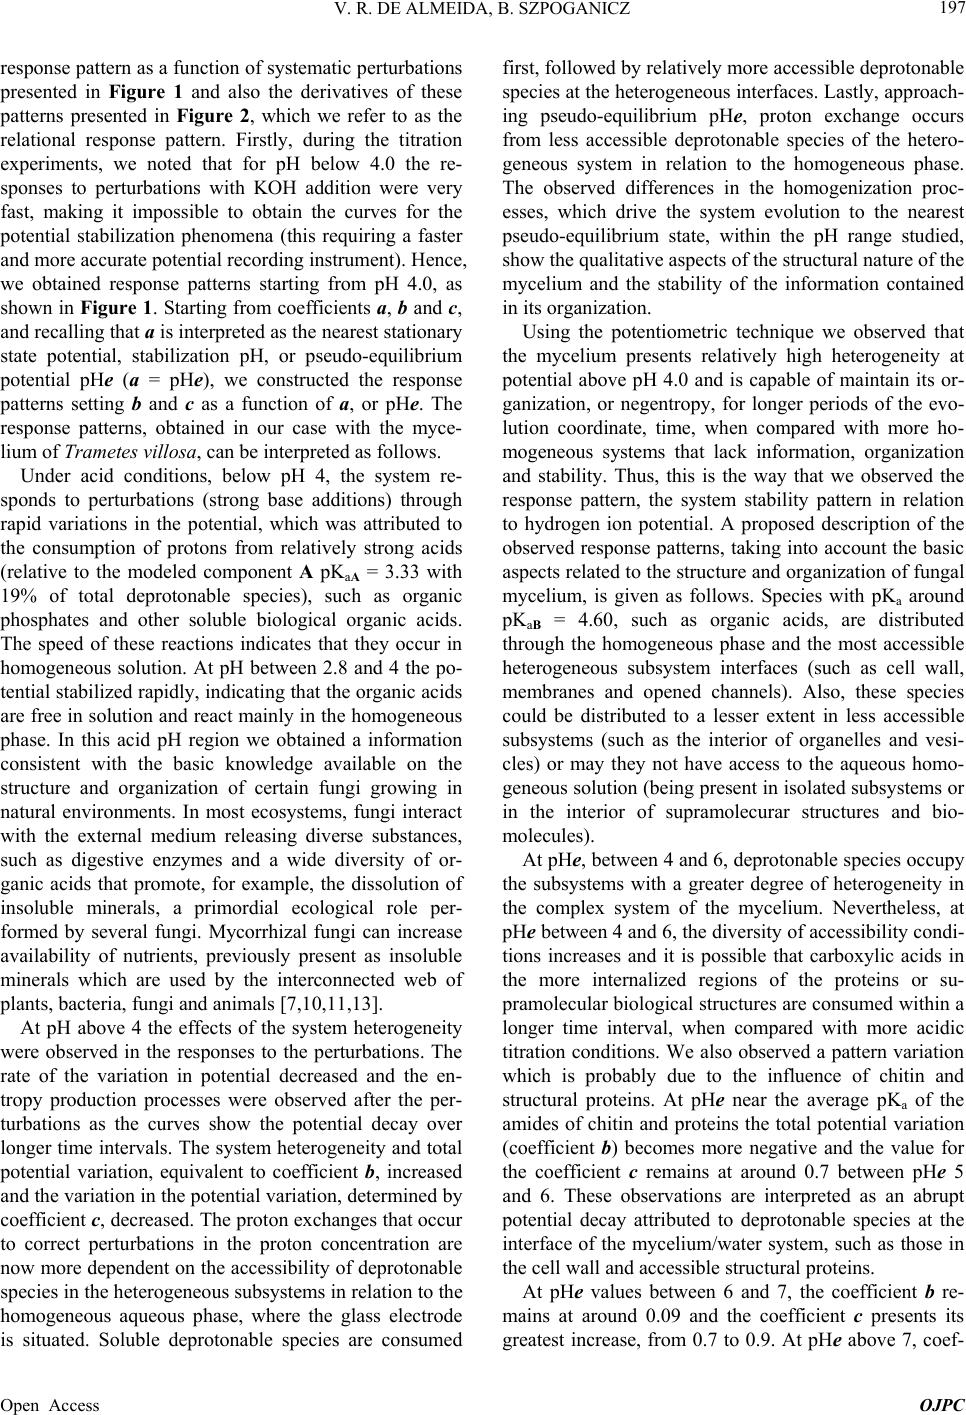 V. R. DE ALMEIDA, B. SZPOGANICZ 197 response pattern as a function of systematic perturbations presented in Figure 1 and also the derivatives of these patterns presented in Figure 2, which we refer to as the relational response pattern. Firstly, during the titration experiments, we noted that for pH below 4.0 the re- sponses to perturbations with KOH addition were very fast, making it impossible to obtain the curves for the potential stabilization phenomena (this requiring a faster and more accurate potential recording instrument). Hence, we obtained response patterns starting from pH 4.0, as shown in Figure 1. Starting from coefficients a, b and c, and recalling that a is interpreted as the nearest stationary state potential, stabilization pH, or pseudo-equilibrium potential pHe (a = pHe), we constructed the response patterns setting b and c as a function of a, or pHe. The response patterns, obtained in our case with the myce- lium of Trametes villosa, can be interpreted as follows. Under acid conditions, below pH 4, the system re- sponds to perturbations (strong base additions) through rapid variations in the potential, which was attributed to the consumption of protons from relatively strong acids (relative to the modeled component A pKaA = 3.33 with 19% of total deprotonable species), such as organic phosphates and other soluble biological organic acids. The speed of these reactions indicates that they occur in homogeneous solution. At pH between 2.8 and 4 the po- tential stabilized rapidly, indicating that the organic acids are free in solution and react mainly in the homogeneous phase. In this acid pH region we obtained a information consistent with the basic knowledge available on the structure and organization of certain fungi growing in natural environments. In most ecosystems, fungi interact with the external medium releasing diverse substances, such as digestive enzymes and a wide diversity of or- ganic acids that promote, for example, the dissolution of insoluble minerals, a primordial ecological role per- formed by several fungi. Mycorrhizal fungi can increase availability of nutrients, previously present as insoluble minerals which are used by the interconnected web of plants, bacteria, fungi and animals [7,10,11,13]. At pH above 4 the effects of the system heterogeneity were observed in the responses to the perturbations. The rate of the variation in potential decreased and the en- tropy production processes were observed after the per- turbations as the curves show the potential decay over longer time intervals. The system heterogeneity and total potential variation, equivalent to coefficient b, increased and the variation in the potential variation, determined by coefficient c, decreased. The proton exchanges that occur to correct perturbations in the proton concentration are now more dependent on the accessibility of deprotonable species in the heterogeneous subsystems in relation to the homogeneous aqueous phase, where the glass electrode is situated. Soluble deprotonable species are consumed first, followed by relatively more accessible deprotonable species at the heterogeneous interfaces. Lastly, approach- ing pseudo-equilibrium pHe, proton exchange occurs from less accessible deprotonable species of the hetero- geneous system in relation to the homogeneous phase. The observed differences in the homogenization proc- esses, which drive the system evolution to the nearest pseudo-equilibrium state, within the pH range studied, show the qualitative aspects of the structural nature of the mycelium and the stability of the information contained in its organization. Using the potentiometric technique we observed that the mycelium presents relatively high heterogeneity at potential above pH 4.0 and is capable of maintain its or- ganization, or negentropy, for longer periods of the evo- lution coordinate, time, when compared with more ho- mogeneous systems that lack information, organization and stability. Thus, this is the way that we observed the response pattern, the system stability pattern in relation to hydrogen ion potential. A proposed description of the observed response patterns, taking into account the basic aspects related to the structure and organization of fungal mycelium, is given as follows. Species with pKa around pKaB = 4.60, such as organic acids, are distributed through the homogeneous phase and the most accessible heterogeneous subsystem interfaces (such as cell wall, membranes and opened channels). Also, these species could be distributed to a lesser extent in less accessible subsystems (such as the interior of organelles and vesi- cles) or may they not have access to the aqueous homo- geneous solution (being present in isolated subsystems or in the interior of supramolecurar structures and bio- molecules). At pHe, between 4 and 6, deprotonable species occupy the subsystems with a greater degree of heterogeneity in the complex system of the mycelium. Nevertheless, at pHe between 4 and 6, the diversity of accessibility condi- tions increases and it is possible that carboxylic acids in the more internalized regions of the proteins or su- pramolecular biological structures are consumed within a longer time interval, when compared with more acidic titration conditions. We also observed a pattern variation which is probably due to the influence of chitin and structural proteins. At pHe near the average pKa of the amides of chitin and proteins the total potential variation (coefficient b) becomes more negative and the value for the coefficient c remains at around 0.7 between pHe 5 and 6. These observations are interpreted as an abrupt potential decay attributed to deprotonable species at the interface of the mycelium/water system, such as those in the cell wall and accessible structural proteins. At pHe values between 6 and 7, the coefficient b re- mains at around 0.09 and the coefficient c presents its greatest increase, from 0.7 to 0.9. At pHe above 7, coef- Open Access OJPC 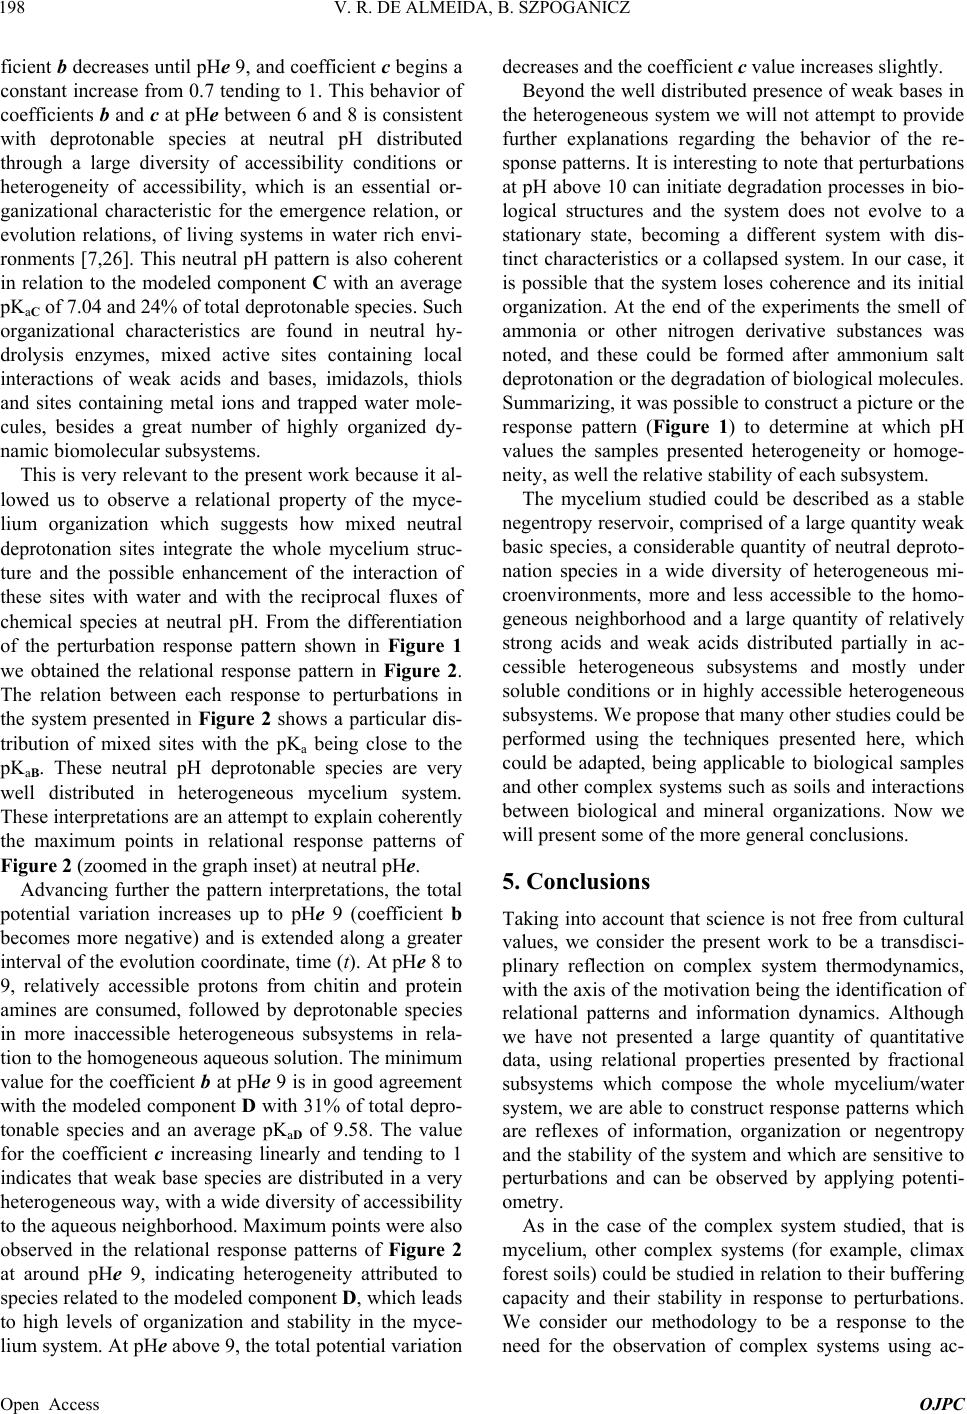 V. R. DE ALMEIDA, B. SZPOGANICZ 198 ficient b decreases until pHe 9, and coefficient c begins a constant increase from 0.7 tending to 1. This behavior of coefficients b and c at pHe between 6 and 8 is consistent with deprotonable species at neutral pH distributed through a large diversity of accessibility conditions or heterogeneity of accessibility, which is an essential or- ganizational characteristic for the emergence relation, or evolution relations, of living systems in water rich envi- ronments [7,26]. This neutral pH pattern is also coherent in relation to the modeled component C with an average pKaC of 7.04 and 24% of total deprotonable species. Such organizational characteristics are found in neutral hy- drolysis enzymes, mixed active sites containing local interactions of weak acids and bases, imidazols, thiols and sites containing metal ions and trapped water mole- cules, besides a great number of highly organized dy- namic biomolecular subsystems. This is very relevant to the present work because it al- lowed us to observe a relational property of the myce- lium organization which suggests how mixed neutral deprotonation sites integrate the whole mycelium struc- ture and the possible enhancement of the interaction of these sites with water and with the reciprocal fluxes of chemical species at neutral pH. From the differentiation of the perturbation response pattern shown in Figure 1 we obtained the relational response pattern in Figure 2. The relation between each response to perturbations in the system presented in Figure 2 shows a particular dis- tribution of mixed sites with the pKa being close to the pKaB. These neutral pH deprotonable species are very well distributed in heterogeneous mycelium system. These interpretations are an attempt to explain coherently the maximum points in relational response patterns of Figure 2 (zoomed in the graph inset) at neutral pHe. Advancing further the pattern interpretations, the total potential variation increases up to pHe 9 (coefficient b becomes more negative) and is extended along a greater interval of the evolution coordinate, time (t). At pHe 8 to 9, relatively accessible protons from chitin and protein amines are consumed, followed by deprotonable species in more inaccessible heterogeneous subsystems in rela- tion to the homogeneous aqueous solution. The minimum value for the coefficient b at pHe 9 is in good agreement with the modeled component D with 31% of total depro- tonable species and an average pKaD of 9.58. The value for the coefficient c increasing linearly and tending to 1 indicates that weak base species are distributed in a very heterogeneous way, with a wide diversity of accessibility to the aqueous neighborhood. Maximum points were also observed in the relational response patterns of Figure 2 at around pHe 9, indicating heterogeneity attributed to species related to the modeled component D, which leads to high levels of organization and stability in the myce- lium system. At pHe above 9, the total potential variation decreases and the coefficient c value increases slightly. Beyond the well distributed presence of weak bases in the heterogeneous system we will not attempt to provide further explanations regarding the behavior of the re- sponse patterns. It is interesting to note that perturbations at pH above 10 can initiate degradation processes in bio- logical structures and the system does not evolve to a stationary state, becoming a different system with dis- tinct characteristics or a collapsed system. In our case, it is possible that the system loses coherence and its initial organization. At the end of the experiments the smell of ammonia or other nitrogen derivative substances was noted, and these could be formed after ammonium salt deprotonation or the degradation of biological molecules. Summarizing, it was possible to construct a picture or the response pattern (Figure 1) to determine at which pH values the samples presented heterogeneity or homoge- neity, as well the relative stability of each subsystem. The mycelium studied could be described as a stable negentropy reservoir, comprised of a large quantity weak basic species, a considerable quantity of neutral deproto- nation species in a wide diversity of heterogeneous mi- croenvironments, more and less accessible to the homo- geneous neighborhood and a large quantity of relatively strong acids and weak acids distributed partially in ac- cessible heterogeneous subsystems and mostly under soluble conditions or in highly accessible heterogeneous subsystems. We propose that many other studies could be performed using the techniques presented here, which could be adapted, being applicable to biological samples and other complex systems such as soils and interactions between biological and mineral organizations. Now we will present some of the more general conclusions. 5. Conclusions Taking into account that science is not free from cultural values, we consider the present work to be a transdisci- plinary reflection on complex system thermodynamics, with the axis of the motivation being the identification of relational patterns and information dynamics. Although we have not presented a large quantity of quantitative data, using relational properties presented by fractional subsystems which compose the whole mycelium/water system, we are able to construct response patterns which are reflexes of information, organization or negentropy and the stability of the system and which are sensitive to perturbations and can be observed by applying potenti- ometry. As in the case of the complex system studied, that is mycelium, other complex systems (for example, climax forest soils) could be studied in relation to their buffering capacity and their stability in response to perturbations. We consider our methodology to be a response to the need for the observation of complex systems using ac- Open Access OJPC  V. R. DE ALMEIDA, B. SZPOGANICZ 199 cessible techniques that can be adapted according to cer- tain conditions, epistemological assumptions, goals and questionings. The results and discussions presented herein are examples of how this methodology can be used. In the introductory and theoretical sections, we pre- sented an epistemological basis and the techniques that were needed for the creation of this methodology. In our view, ecological monitoring and investigation using ac- cessible technologies are important in relation to all as- pects of our culture, particularly those that address deeper issues. In this work, we set out to demonstrate the importance of diversity, heterogeneity and information to systems’ stability and achieved considerable success. Considering dimensions similar with those of a fungal extract of systemic complexity (e.g. the biosphere sub- systems), it is reasonable to assume that the stability and the free energy of complex systems depend on organiza- tion and coherent interactions between (in)organic and biological systems and also on the diversity, biodiversity and heterogeneity of the subsystems. We hope that in near future these concepts will become clearer and be discussed more often and that this paper will serve to en- hance the ethics formulation of human-environment in- teractions associated with different cultural practices. 6. Acknowledgements We wish to thank Dra. Maria Alice Neves, Dr. Elisandro R. Deschler dos Santos and Carlos Salvador for the Trametes villosa fruiting body photograph, the Trametes villosa species identification and the fungi petri-dish starting culture procedure execution, respectively. We also wish to thanks Dra. Maria da Graça Nascimento and Msc. Jaqueline Ramos for providing adequate conditions for aqueous medium fungi cultivation, the funding agency CNPq and Universidade Federal de Santa Ca- tarina (UFSC), Brazil. REFERENCES [1] E. Morin, “Ciência com Consciencia,” 8th Edition, Bertrand Brasil, Rio de Janeiro, 2005. [2] D. J. Silva, “O Paradigma Transdiciplinar: Uma Perspec- tiva Metodológica para a Pesquisa Ambiental,” Workshop sobre Interdisciplinaridade, Ministério da Ciencia e Tecnologia, Instituto de Pesquisas Espaciais, São José dos Campos, 1999. [3] H. Maturana and G. Verden-Zoller, “Amor y Juego: Fun- damentos Olvidados de lo Humano,” 2nd Edition, Instituto de Terapia Cognitiva, Santiago, 1994. [4] F. Capra, “O Ponto de Mutação,” 29th Edition, Cultrix, São Paulo, 2010. [5] C. G. Jung, “Psicologia e Alquimia,” 4th Edition, Vozes, Petrópolis, 1990. [6] D. Kondepudi and I. Prigogine, “Modern Thermodynam- ics: From Heat Engines to Dissipative Structures,” John Wiley, Chichester, 1998. [7] M. J. Carlile and S. C. Watkinson, “The Fungi,” Acade- mic Press, London, 1994. [8] C. J. Alexopoulos and C. W. Mims, “Introductory My- cology,” 3rd Edition, John Wiley, New York, 1979. [9] P. Stamets, “Mycelium Running: How Mushroom Can Help to Save The World,” Colorkraft, Hong Kong, 2005. [10] N. A. R. Gow, G. D. Robson and G. M. Gadd, “The Fun- gal Colony,” C.U. Press, New York, 1999. http://dx.doi.org/10.1017/CBO9780511549694 [11] G. M. Gadd, “Mycotransformation of Organic and Inor- ganic Substrates,” Mycologist, Vol. 18, No. 2, 2004, pp. 60-70. http://dx.doi.org/10.1017/S0269915X04002022 [12] Z. Naveh, “Ten Major Premises for a Holistic Conception of Multifunctional Landscapes,” Landscape and Urban Planning, Vol. 57, No. 3-4, 2001, pp. 269-284. http://dx.doi.org/10.1016/S0169-2046(01)00209-2 [13] R. Ferrera-Cerato and J. Perez Moreno, “Mycorrhizal Interactions with Plants and Soil Organism in Sustainable Agroecosystems,” Soil Ecology in Sustainable Agricul- tural Systems, CRC/Lewis Publishers, Mexico, 1997. [14] J. Harris, “Soil Microbial Communities and Restoration Ecology: Facilitators or Followers?” Science, Vol. 325, No. 5940, 2009, pp. 573-574. http://dx.doi.org/10.1126/science.1172975 [15] A. Primavesi, “Manejo Ecológico do Solo: A Agricultura em Regiões Tropicais,” Nobel, São Paulo, 2002. [16] M. Altieri, “Agroecologia: Bases Científicas para Agri- cultura Alternativa,” 2nd Edition, FASE, Rio de Janeiro, Brasil, 1989. [17] G. Bateson, “Steps to an Ecology of Mind: Collected Essays in Anthropology, Psychiatry, Evolution and Epis- temology,” Jason Aranson, London, 1987. [18] T. Yamanaka, “The Effect of pH on The Growth of Saprotrophic and Ectomycorrhizal Ammonia Fungi in Vi- tro,” Mycologia, Vol. 95, No. 4, 2003, pp. 584-589. http://dx.doi.org/10.2307/3761934 [19] J. Rifkin and T. Howard, “Entropy: A New World View,” Viking Press, New York, 1980. [20] G. Sanna, G. Alberti, P. Castaldi and P. Melis, “Determi- nation of Stability Constants of Metal-Trichoderma viride Complexes by The Potentiometric Titration Method,” Fresenius Environmental Bulletin, Vol. 11, No. 9b, 2002, pp. 636-641. [21] G. Naja, C. Mustin, B. Volesky and J. Berthelin, “A High-Resolution Titrator: A New Approach to Studying Binding Sites of Microbial Biosorbents,” Water Research, Vol. 39, No. 4, 2005, pp. 579-588. http://dx.doi.org/10.1016/j.watres.2004.11.008 [22] S. Kazakov, E. Bonvouloir and I. Gazaryan, “Physico- chemical Characterization of Natural Ionic Microreser- voirs: Bacillus subtilis Dormant Spores,” The Journal of Physical Chemistry B, Vol. 112, No. 7, 2008, pp. 2233- 2244. http://dx.doi.org/10.1021/jp077188u [23] L. von Bertalanffy, “Teoria Geral dos Sistemas,” 2nd Open Access OJPC  V. R. DE ALMEIDA, B. SZPOGANICZ Open Access OJPC 200 Edition, Vozes, Brasília, 1975. [24] A. E. Martell and R. J. Motekaitis, “Determination and Use of Stability Constants,” VHC Publishers, Dallas, 1992. [25] D. Sanders, “Kinetic Modeling of Plant and Fungal Mem- brane Transport Systems,” Annual Review of Plant Phy- siology and Plant Molecular Biology, Vol. 41, No. 1, 1990, pp. 77-107. http://dx.doi.org/10.1146/annurev.pp.41.060190.000453 [26] K. Michaelian, “Entropy Production and the Origin of Life,” Journal of Modern Physics, Vol. 2, No. 26, 2011, pp. 595-601. http://dx.doi.org/10.4236/jmp.2011.226069
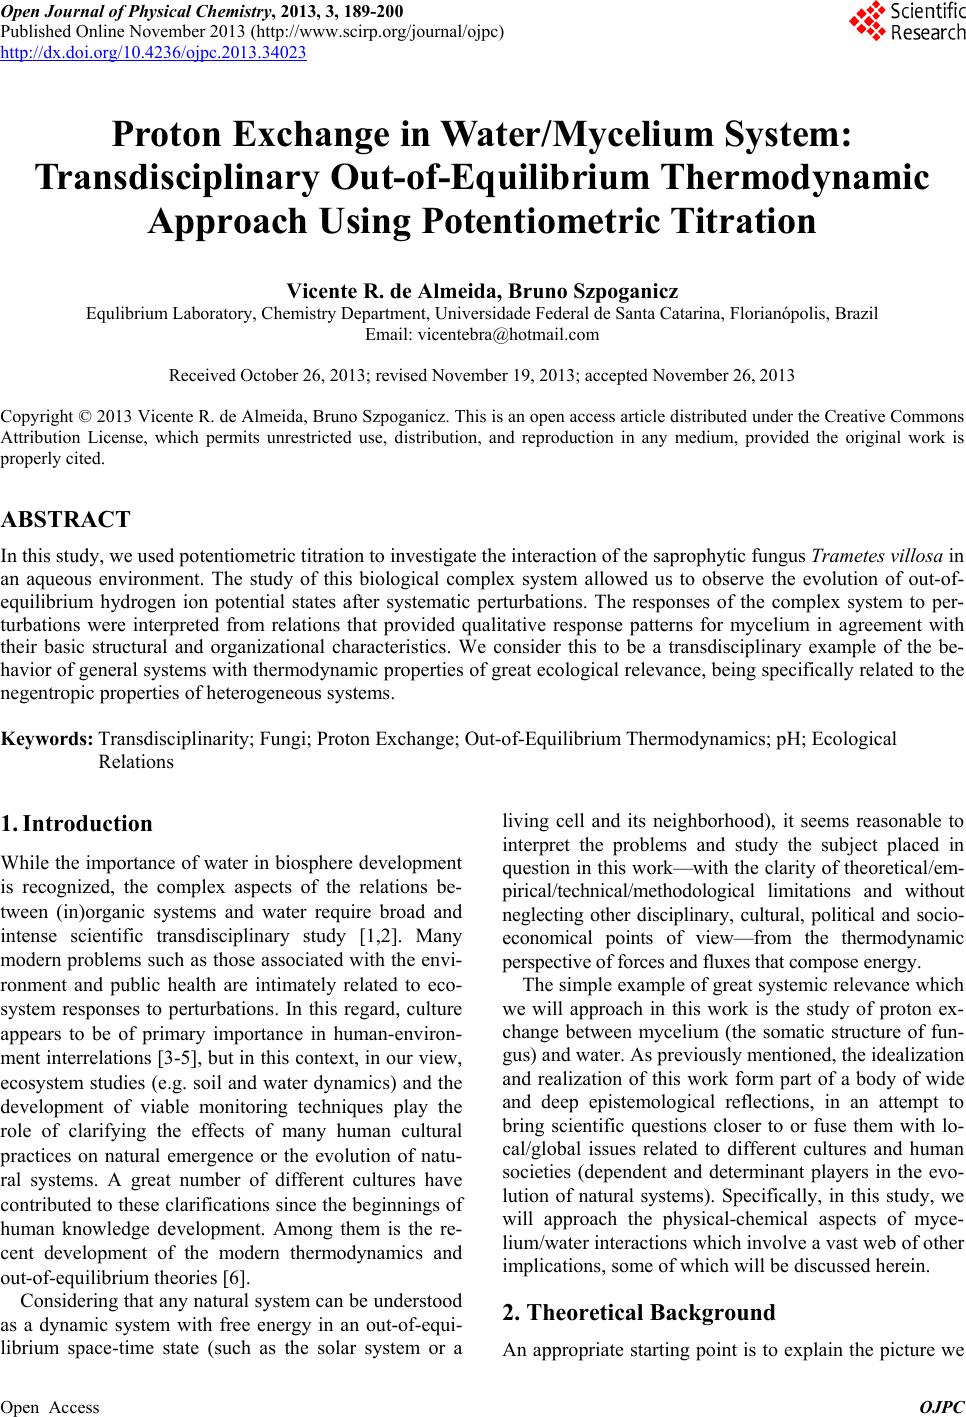
|