 Open Journal of Depression 2013. Vol.2, No.4, 82-86 Published Online November 2013 in SciRes (http://www.scirp.org/journal/ojd) http://dx.doi.org/10.4236/ojd.2013.24014 Open Access 82 Mesopic Visual Contrast Sensitivity in Patients with Major Depression Renata M. T. B. L. Nogueira1*, Everton L. Espínola2, Aline M. Lacerda2, Natanael A. Santos2 1Departamento de Psicologia da Universidade Federal de Pernambuco (UFPE), Recife, Brasil 2Laboratório de Percepção, Neurociências e Comportamento, Departamento de Psicologia, Universidade Federal da Paraíba (UFPB), João Pessoa, Brasil Email: *rm_renata@yahoo.com.br Received October 3rd, 2013; revised November 3rd, 2013; accepted November 11th, 2013 Copyright © 2013 Renata M. T. B. L. Nogueira et al. This is an open access article distributed under the Crea- tive Commons Attribution License, which permits unrestricted use, distribution, and reproduction in any me- dium, provided the original work is properly cited. The present study evaluated the effects of major depression on visual contrast sensitivity (CS) at low mesopic luminance (.7 cd/m2 mean luminance), a condition that has been little explored in the literature. We measured spatial visual CS in 20 male volunteers aged 20 - 30 years, including 10 healthy individuals and 10 medicated individuals with major depression, to linear sine-wave gratings of .25, 1.0, and 4.0 cycles per degree (cpd) of visual angle using the psychophysical staircase method with forced choice. The average spatial visual CS in the depressed group was approximately 1.7 lower than the average spatial visual CS in the control group. However, the post hoc test showed significant differences only at the spatial frequencies of .25 and 1.0 cpd (p < .05), which are likely processed by the magnocellular visual pathway. These results suggest that spatial visual CS to sine-wave gratings should be used to evaluate the responsiveness of the visual system in patients with major depression under conditions of low luminance. Keywords: Visual Perception; Contrast Sensitivity; Depression; Spatial Frequency; Psychophysics Introduction Depression can be defined as a mental disorder presented by depressed mood, loss of pleasure and interest, feelings of guilt and low self-esteem, sleep and appetite disturbances, low en- ergy, and poor concentration (WHO, 2012). The annual inci- dence of depression makes it one of the most important public health problems, with severe socioeconomic implications, high costs for health care, and a reduction of quality of life (Solomon, 2002). According to the World Health Organization (WHO, 2001), severe depression is the leading cause of disability and ranks fourth among the 10 leading causes of pathology world- wide. In fact, by 2020, depression is estimated to be the second leading cause of disability worldwide. Studying depression us- ing different approaches can complement clinical research and contribute to the characterization of the basic cognitive, affec- tive, and neurophysiological mechanisms of this disease. It may also reveal new theoretical, behavioral, and functional aspects of depression in general and highlight alternative means of diagnosis and prognosis. The present study used visual contrast sensitivity (CS) to assess the perception of patients with major depression. Visual CS is one of the most widely used tools in the diagno- sis and theoretical and clinical evaluation of changes in visual perception and alterations in the central nervous system (Wes- ner & Tan, 2006) caused by disorders or diseases, such as schizophrenia (Slaghuis & Thompson, 2003), amblyopia (Polat, Sagi, & Norcia, 1997), cataracts (Elliott & Situ, 1998), mercury poisoning (Ventura et al., 2005), stroke (Santos & Andrade, 2012; Santos, Andrade, & Fernandez Calvo, 2013), and Alzheimer’s and Parkinson’s diseases (Polat et al., 1997; Akutsu & Legge, 1995; Bour & Apkarian, 1996; Vleugels et al., 1998). Surveys related to visual CS and affective disorders are still sparse, with only a few studies performed under different con- ditions and for different purposes (Wesner & Tan, 2006; Ca- valcanti & Santos, 2005; Szabó et al., 2004). For example, Szabó et al. (2004) measured visual CS in volunteers with and without seasonal affective disorder using static and dynamic sine-wave gratings with spatial frequencies from .5 to 14.4 cycles per degree (cpd) of visual angle. The aim of that study was to investigate the therapeutic effects of light therapy on seasonal depression. The results showed that light therapy sig- nificantly improved visual CS in patients at static spatial fre- quencies below 5.7 cpd. In a pilot study, Cavalcanti e Santos (2005) measured con- trast thresholds in adult volunteers with and without major de- pression under high photopic luminance conditions using non-Cartesian radial visual stimuli at spatial frequencies of .25, 1.0, and 4.0 cpd. The results showed that patients with major depression had a loss of or lower CS for all spatial frequencies compared with volunteers without neuropsychiatric disorders. Wesner & Tan (Wesner & Tan, 2006) measured contrast thresholds in patients with seasonal depression and major de- pression and volunteers without depression using static and dynamic visual stimuli modulated by Gabor’s function with spatial frequencies from .3 to 12 cpd under photopic luminance *Corresponding author.  R. M. T. B. L. NOGUEIRA ET AL. Open Access 83 conditions. The results showed that participants with depression had higher visual CS than the group without depression at high static spatial frequencies of 6.0 and 12 cpd. The authors argued that depression can increase the CS to frequencies that are pro- cessed by the parvocellular visual pathway. The present study evaluated the effects of major depression on spatial visual CS by measuring achromatic visual CS in adult volunteers with and without major depression using a psychophysical method. The present study was motivated by the assumption that depression alters the central nervous system and affects numerous sensory, cognitive, and emotional func- tion to promote changes in visual pathways (Wesner & Tan, 2006). Visual CS is an objective tool, noninvasive, and widely used clinically to contribute to a greater understanding of the sensory mechanisms associated with symptoms of depression. Methods Participants Twenty 20- to 30-year-old male volunteers participated in the study. Ten of the participants had no neuropsychiatric diseases (mean age, 20.8 ± 1.2 years), determined by the Beck Depres- sion Inventory, and 10 of the participants had a diagnosis of major depression (mean age, 23.9 ± 4.0 years) according to the Diagnostic and Statistical Manual of Mental Disorders, 4th edition, text revision (American Psychiatric Association, 2000). The patients with major depression were selected and ranked by psychiatrists from the Centro de Atenção Psicossocial (CAPS; João Pessoa, Paraíba, Brazil) and were taken to the Laboratório de Percepção, Neurociências e Comportamento where the vis- ual tests were conducted. Additional information about the pa- tients with major depression is presented in Table 1. All of the volunteers had normal visual acuity of 6/6 (inclu- sion criterion) tested with directional “E” Rasquin optotype cards (Xenônio, São Paulo, SP, Brazil) and were free of eye dis- eases and neurological disorders (exclusion criterion), with the exception of major depression or disorders related to major depres- sion. The participation of the volunteers conformed to ethical as- pects relevant to research that involves human subjects (National Health Council Resolution no. 196/96, Health Ministry, Brazil). The protocol was submitted to and approved by the Ethics Committee of the Health Sciences Center, Universidade Federal da Paraíba. The participation of the volunteers was voluntary and occurred only after written informed consent was provided by them. Visual Stimuli and Equipment The test stimuli were achromatic linear sine-wave gratings (.7 cd/m2 mean luminance) with spatial frequencies of .25, 1.0, and 4.0 cpd. The non-test stimuli were gray and contained only the mean luminance. The diameter of the resulting patterns subtended approximately 7.2 degrees at a distance of 150 cm (i.e., the stan- dardized distance between the monitor and volunteer). Contrast was defined according to Michelson’s formula (Michelson, 1891): CLxmax LxminLxmax Lxmin x is the luminance at a given point on the sine wave, with x measured radially from the center. xmax and xmin are the maximum and minimum luminances of the pattern, respectively. C is the contrast. The spatial average lu- minance of the grating is given by 12 xmax Lxmin . The stimuli were presented on a 19-inch color cathode ray tube video monitor (1024 × 768 resolution, 70 Hz refresh rate). The stimuli were controlled by a computer through VGA and DVI video connectors. The dynamic range of the contrasts that the monitor could present was expanded more than 64 times by a BITS++ digital video processor (Cambridge Research Sys- tems, Rochester, Kent, England, 2002), resulting in 14 bits per channel or 42 bits per pixel, allowing the presentation of more than 16,384 (or 214) grayscale levels. This allowed the testing of contrast thresholds while enabling high-contrast resolution. The BITS++ processor was controlled by C++ software developed by our research group. It generated and controlled the stimulus presentation and recorded the observer responses to calculate contrast threshold values. The monitor was calibrated with LightScan software and an optical photometer (Cambridge Research Systems, Rochester, Kent, England, 2002). The monitor output was gamma-cor- rected using 48 points from 0 to 255 (gamma = 1.8). The mi- nimum and maximum luminance values of the screen were .5 and .9 cd/m2, respectively, and the background luminance was the minimum luminance itself. The laboratory room was 2.5 2.0 m, with one Philips 20W fluorescent lamp. The walls were gray to better control ambient lighting during the experiment. Table 1. Characterization of the experimental group. Patient* Age (Years) Beck Depression Inventory Time of Disease (Years) Sex Drug Education P1 23 Moderate depression2 Female Fluoxetine Graduate P2 20 Moderate depression2 Female Fluoxetine Academic P3 26 Moderate depression2 Male Fluoxetine Academic P4 22 Moderate depression1 Female Fluoxetine Academic P5 30 Severe depression 2 Female Fluoxetine Academic P6 19 Mild depression 1 Female Risperidone Academic P7 28 Severe depression 2 Female Venlafaxine, Clonazepam, Zolpidem Academic P8 29 Moderate depression2 Female Floral de Bach Graduate P9 22 Moderate depression1 Female No drug Academic P10 20 Mild depression 1 Male No drug Graduate *The characteristics of the participants in the control group (i.e., age, sex, and education level) were similar to the experimental group. See the average ages of the two groups in the Participants section.  R. M. T. B. L. NOGUEIRA ET AL. Open Access 84 Procedure The participants viewed the stimuli binocularly with natural pupils at a distance of 150 cm. A fixed chair and forehead-chin support were used to control the viewing distance. The visual CS of all of the participants was estimated using a temporal two-alternative forced-choice staircase method (Wetherill & Levitt, 1965). The procedure for measuring the threshold for each frequency consisted of presenting successive pairs of sim- ple stimuli, one of which was the test stimulus that should be identified by the participant (i.e., the first or second stimulus of each pair). The order of the presentation of the stimuli and fre- quencies was randomized by the software. The criterion used to alternate the contrast during the experimental session was three consecutive hits to reduce contrast by 20%, and one error to increase contrast by the same percentage. Threshold measurements began with the test stimulus con- trast set at a suprathreshold level (contrast = 1). Each time the volunteer gave a correct answer, the contrast was decreased successively until he made an error. The software recorded the last perceived contrast value. The contrast was then raised until the volunteer could perceive the stimulus again. In this case, the software recorded the first perceived contrast value. The ex- perimental session automatically ended after the software re- corded six staircase contrast values. Each threshold measure- ment was repeated for each spatial frequency. The contrast threshold calculated for each volunteer was the mean of the 12 contrast values (six at the test and six at the retest). A stimulus sequence was presented during each experi- mental session, starting with a beep and followed immediately by the presentation of the first stimulus for 2 s. A 1 s interval elapsed between stimuli, followed by the presentation of the second stimulus for 2 s and the volunteer’s response. All of the participants responded within the 3-s interval. A correct re- sponse was followed by another beep. The interval between trials was 3 s, regardless of a correct or incorrect response (or choice). The beeps that indicated the beginning of the stimulus pair presentation and correct choice were different. All of the participants received the following instructions: “Pairs of circles will appear on the screen, one after the other. One of them will be totally gray, whereas the other will contain light and dark gratings (bars) inside it. When the circle with light and dark gratings (bars) appears first, you must press the left mouse button (button 1); when the circle with light and dark gratings (bars) appears second, you should press the right mouse button (button 2).” The experiments began only when the experimenter was confident that the participants understood and responded ac- cording to the directions. In this context, instructions were re- peated in a training and familiarization session with the ex- perimental conditions. After each experimental session, the software produced a re- cord sheet with the 12 staircase contrast values from each par- ticipant, six in the test and six in the retest. Values were grouped according to mental condition (i.e., participants with- out major depression [control group] and participants with ma- jor depression [experimental group]). All of the staircase con- trast threshold values were converted into CS values (1/thresh- old). All 240 staircase contrast values (12 from each volunteer) for each spatial frequency were used to conduct a Tukey Two- Sided Outlier Test. The 3, 4, and 8 outlier values for .5, 1.0, and 4.0 cpd, respectively, identified by the Tukey test were set to equal the group mean calculated in the absence of the outlier. After the Tukey Outlier Test, the means of the staircase contrast values were used to calculate their individual linear CS values. Results A one-way analysis of variance (ANOVA) applied to CS re- vealed significant differences between groups (F3,396 = 80.5, p < .05) and a significant interaction (F3,396 = 905.2, p < .05). Thus, the control and experimental groups had different con- trast sensitivity (p < .05). The Tukey Honestly Significant Difference post hoc test showed significant differences between the groups only at low spatial frequencies of .25 and 1.0 cpd (p < .05). The differences between groups at the spatial frequency of 4.0 cpd were not significantly different (p > .05). The participants with major depression generally required higher contrast to detect the spa- tial frequencies of .25 and 1.0 cpd than the participants without any neuropsychiatric disease. The results showed that the maximum CS in the control group occurred at frequencies of .25 and 1.0 cpd, whereas the maximum CS in the experimental group occurred at the fre- quency of .25 cpd (Figure 1). The data also showed that the participants without any neuropsychiatric disease were 1.57-, 2.14-, and 1.28-times more sensitive to spatial frequencies of .25, 1.0, and 4.0 cpd, respectively, than the patients with major depression. Discussion The present study measured visual CS using a psychophysi- cal staircase method, with forced choice between two temporal alternatives under mesopic luminance conditions. The research hypothesis was that major depression would alter the response of the visual system or the basic sensory mechanisms involved in processing visual patterns, altering contrast sensitivity to sine-wave gratings with spatial frequencies of .25, 1.0, and 4.0 cpd. Figure 1. The estimated contrast sensitivity in adult volunteers is presented as a spatial frequency function of .25, 1.0, and 4.0 cpd. The continuous curve (─■─) represents the control group (without major depression), and the dotted curve (---▲---) represents the experimental group (with major depression). The error bars indicate standard errors of the mean (p = .05). 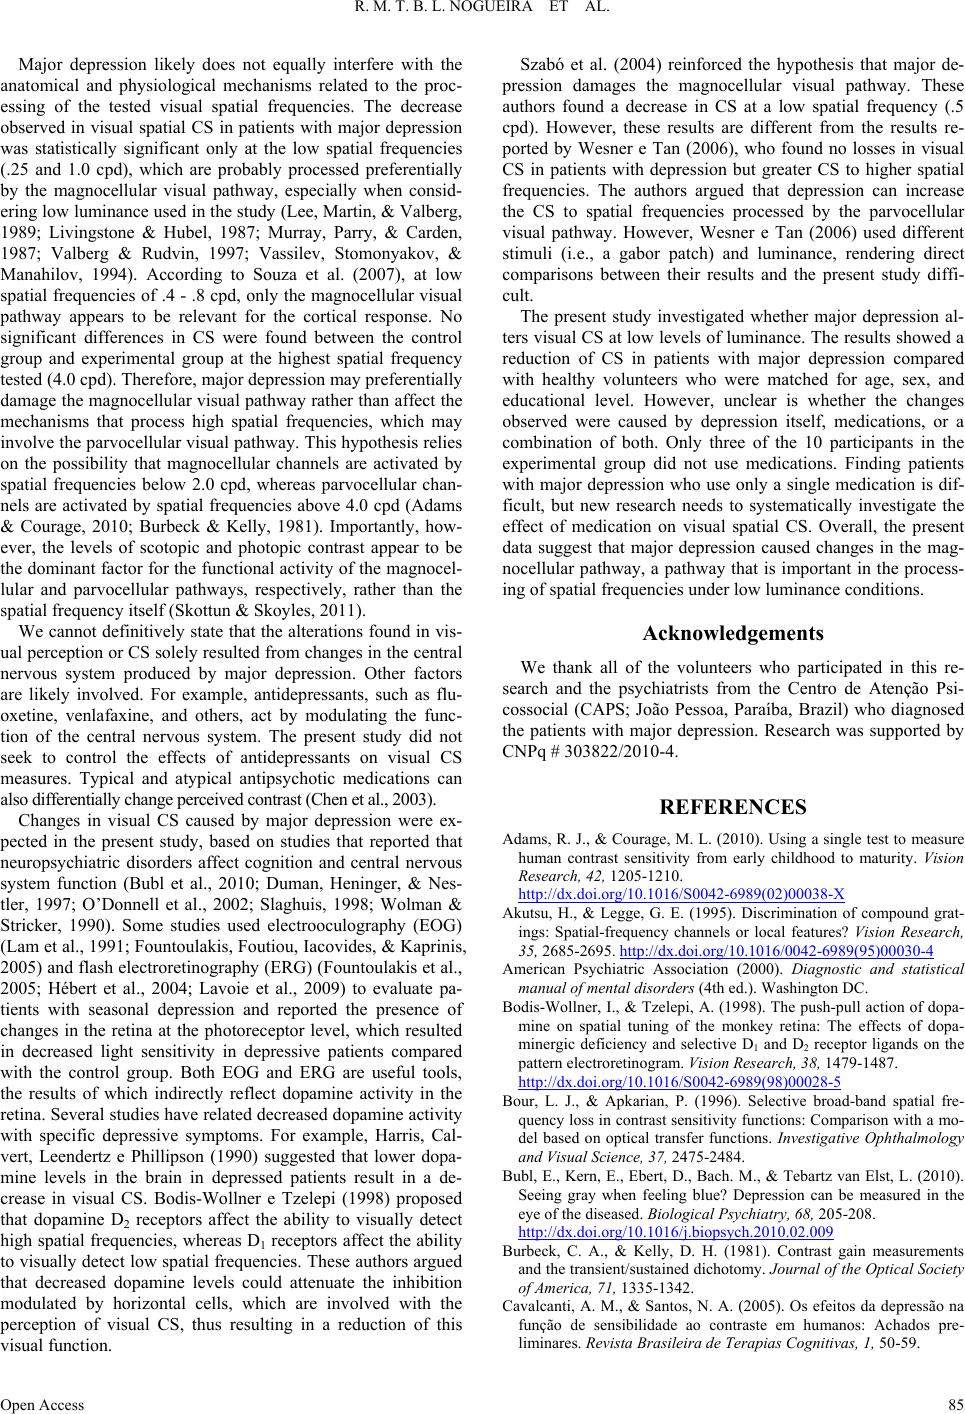 R. M. T. B. L. NOGUEIRA ET AL. Open Access 85 Major depression likely does not equally interfere with the anatomical and physiological mechanisms related to the proc- essing of the tested visual spatial frequencies. The decrease observed in visual spatial CS in patients with major depression was statistically significant only at the low spatial frequencies (.25 and 1.0 cpd), which are probably processed preferentially by the magnocellular visual pathway, especially when consid- ering low luminance used in the study (Lee, Martin, & Valberg, 1989; Livingstone & Hubel, 1987; Murray, Parry, & Carden, 1987; Valberg & Rudvin, 1997; Vassilev, Stomonyakov, & Manahilov, 1994). According to Souza et al. (2007), at low spatial frequencies of .4 - .8 cpd, only the magnocellular visual pathway appears to be relevant for the cortical response. No significant differences in CS were found between the control group and experimental group at the highest spatial frequency tested (4.0 cpd). Therefore, major depression may preferentially damage the magnocellular visual pathway rather than affect the mechanisms that process high spatial frequencies, which may involve the parvocellular visual pathway. This hypothesis relies on the possibility that magnocellular channels are activated by spatial frequencies below 2.0 cpd, whereas parvocellular chan- nels are activated by spatial frequencies above 4.0 cpd (Adams & Courage, 2010; Burbeck & Kelly, 1981). Importantly, how- ever, the levels of scotopic and photopic contrast appear to be the dominant factor for the functional activity of the magnocel- lular and parvocellular pathways, respectively, rather than the spatial frequency itself (Skottun & Skoyles, 2011). We cannot definitively state that the alterations found in vis- ual perception or CS solely resulted from changes in the central nervous system produced by major depression. Other factors are likely involved. For example, antidepressants, such as flu- oxetine, venlafaxine, and others, act by modulating the func- tion of the central nervous system. The present study did not seek to control the effects of antidepressants on visual CS measures. Typical and atypical antipsychotic medications can also differentially change perceived contrast (Chen et al., 2003). Changes in visual CS caused by major depression were ex- pected in the present study, based on studies that reported that neuropsychiatric disorders affect cognition and central nervous system function (Bubl et al., 2010; Duman, Heninger, & Nes- tler, 1997; O’Donnell et al., 2002; Slaghuis, 1998; Wolman & Stricker, 1990). Some studies used electrooculography (EOG) (Lam et al., 1991; Fountoulakis, Foutiou, Iacovides, & Kaprinis, 2005) and flash electroretinography (ERG) (Fountoulakis et al., 2005; Hébert et al., 2004; Lavoie et al., 2009) to evaluate pa- tients with seasonal depression and reported the presence of changes in the retina at the photoreceptor level, which resulted in decreased light sensitivity in depressive patients compared with the control group. Both EOG and ERG are useful tools, the results of which indirectly reflect dopamine activity in the retina. Several studies have related decreased dopamine activity with specific depressive symptoms. For example, Harris, Cal- vert, Leendertz e Phillipson (1990) suggested that lower dopa- mine levels in the brain in depressed patients result in a de- crease in visual CS. Bodis-Wollner e Tzelepi (1998) proposed that dopamine D2 receptors affect the ability to visually detect high spatial frequencies, whereas D1 receptors affect the ability to visually detect low spatial frequencies. These authors argued that decreased dopamine levels could attenuate the inhibition modulated by horizontal cells, which are involved with the perception of visual CS, thus resulting in a reduction of this visual function. Szabó et al. (2004) reinforced the hypothesis that major de- pression damages the magnocellular visual pathway. These authors found a decrease in CS at a low spatial frequency (.5 cpd). However, these results are different from the results re- ported by Wesner e Tan (2006), who found no losses in visual CS in patients with depression but greater CS to higher spatial frequencies. The authors argued that depression can increase the CS to spatial frequencies processed by the parvocellular visual pathway. However, Wesner e Tan (2006) used different stimuli (i.e., a gabor patch) and luminance, rendering direct comparisons between their results and the present study diffi- cult. The present study investigated whether major depression al- ters visual CS at low levels of luminance. The results showed a reduction of CS in patients with major depression compared with healthy volunteers who were matched for age, sex, and educational level. However, unclear is whether the changes observed were caused by depression itself, medications, or a combination of both. Only three of the 10 participants in the experimental group did not use medications. Finding patients with major depression who use only a single medication is dif- ficult, but new research needs to systematically investigate the effect of medication on visual spatial CS. Overall, the present data suggest that major depression caused changes in the mag- nocellular pathway, a pathway that is important in the process- ing of spatial frequencies under low luminance conditions. Acknowledgements We thank all of the volunteers who participated in this re- search and the psychiatrists from the Centro de Atenção Psi- cossocial (CAPS; João Pessoa, Paraíba, Brazil) who diagnosed the patients with major depression. Research was supported by CNPq # 303822/2010-4. REFERENCES Adams, R. J., & Courage, M. L. (2010). Using a single test to measure human contrast sensitivity from early childhood to maturity. Vision Research, 42, 1205-1210. http://dx.doi.org/10.1016/S0042-6989(02)00038-X Akutsu, H., & Legge, G. E. (1995). Discrimination of compound grat- ings: Spatial-frequency channels or local features? Vision Research, 35, 2685-2695. http://dx.doi.org/10.1016/0042-6989(95)00030-4 American Psychiatric Association (2000). Diagnostic and statistical manual of mental disorders (4th ed.). Washington DC. Bodis-Wollner, I., & Tzelepi, A. (1998). The push-pull action of dopa- mine on spatial tuning of the monkey retina: The effects of dopa- minergic deficiency and selective D1 and D2 receptor ligands on the pattern electroretinogram. Vision Research, 38, 1479-1487. http://dx.doi.org/10.1016/S0042-6989(98)00028-5 Bour, L. J., & Apkarian, P. (1996). Selective broad-band spatial fre- quency loss in contrast sensitivity functions: Comparison with a mo- del based on optical transfer functions. Investigative Ophthalmology and Visual Science, 37, 2475-2484. Bubl, E., Kern, E., Ebert, D., Bach. M., & Tebartz van Elst, L. (2010). Seeing gray when feeling blue? Depression can be measured in the eye of the diseased. Biological Psy chiatry, 68, 205-208. http://dx.doi.org/10.1016/j.biopsych.2010.02.009 Burbeck, C. A., & Kelly, D. H. (1981). Contrast gain measurements and the transient/sustained dichotomy. Journal of the Optical Society of America, 71, 1335-1342. Cavalcanti, A. M., & Santos, N. A. (2005). Os efeitos da depressão na função de sensibilidade ao contraste em humanos: Achados pre- liminares. Revista Brasileira de Terap i as C o g n i t i vas, 1, 50-59.  R. M. T. B. L. NOGUEIRA ET AL. Open Access 86 Chen, Y., Levy, D. L., Sheremata, S., Nakayama, K., Matthysse, S., & Holzman, P. S., (2003). Effects of typical, atypical and no antipsy- chotic drugs on visual contrast detection in Schizophrenia. American Journal Psychiatry, 16 0 , 1795-1801. http://dx.doi.org/10.1176/appi.ajp.160.10.1795 Duman, R. S., Heninger, G. R., & Nestler, E. J. (1997). A molecular and cellular theory of depression. Archives of General Psychiatry, 54, 597-606. http://dx.doi.org/10.1001/archpsyc.1997.01830190015002 Elliott, D. B., & Situ, P. (1998). Visual acuity versus letter contrast sensitivity in early cataract. Vision Research, 38, 2047-2052. Fountoulakis, K. N., Foutiou, F., Iacovides, A., & Kaprinis, G. (2005). Is there a dysfunction in the visual system of depressed patients? Annals of General Psychiatry, 4, 1-10. Harris, J. P., Calvert, J. E., Leendertz, J. A., & Phillipson, O. T. (1990). The influence of dopamine on spatial vision. Eye, 4, 806-812. http://dx.doi.org/10.1038/eye.1990.127 Hébert, M., Beattie, C. W., Tam, E. M., Yatham, L. N., & Lam, R. W. (2004). Electroretinography in patients with winter seasonal affective disorder. Psychiatry Research, 127, 27-34. http://dx.doi.org/10.1016/j.psychres.2004.03.006 Lam, R. W., Beattie, C. W., Buchanan, A., Remick, R. A., & Zis, A. P. (1991). Low electrooculographic ratios in patients with seasonal af- fective disorder. American Journal of Psychiatry, 148, 1526-1529. Lavoie, M. P., Lam, R. W., Bouchard, G., Sasseville, A., Charron, M. C., Gagné, A. M., Tremblay, P., Filteau, M. J., & Hébert, M. (2009). Evidence of a biological effect of light therapy on the retina of pa- tients with seasonal affective disorder. Biological Psychiatry, 66, 253-258. http://dx.doi.org/10.1016/j.biopsych.2008.11.020 Lee, B. B., Martin, P. R., & Valberg, A. (1989) Sensitivity of macaque retinal ganglion cells to chromatic and luminance flicker. Journal of Physiology, 414, 223-243. Livingstone, M. S., & Hubel, D. H. (1987). Psychophysical evidence for separate channels for the perception of form, color, movement, and depth. Journal of Neuroscience, 7, 3416-3468. Michelson, A. A. (1891). On the application of interference methods to spectroscopic measurements. The London, Edinburgh, and Dublin Philosophical Magazine and Journal o f Scienc e, 31, 338-346. http://dx.doi.org/10.1080/14786449108620117 Murray, I. J., Parry, N. R. A., & Carden, D. (1987). Human visual evoked potentials to chromatic and achromatic gratings. Clinical Visual Sci- ence, 1, 231-244. O’Donnell, B. F., Potts, G. F., Nestor, P. G., Stylianopoulos, K. C., Shenton, M. E., & McCarley, R. W. (2002). Spatial frequency dis- crimination in Schizophrenia. Journal of Abnormal Psychology, 111, 620-625. http://dx.doi.org/10.1037/0021-843X.111.4.620 Polat, U, Sagi, D., & Norcia, A. M. (1997). Abnormal long-range spa- tial interactions in Amblyoplia. Vision Research, 37, 737-744. http://dx.doi.org/10.1016/S0042-6989(96)00154-X Santos, N. A., & Andrade, S. M. (2012). Visual contrast sensitivity in patients with impairment of functional independence after stroke. BMC Neurology, 12, 90. http://dx.doi.org/10.1186/1471-2377-12-90 Santos, N. A., Andrade, S. M., & Fernandez Calvo, B. (2013). Detec- tion of spatial frequency in brain-damaged patients: Influence of hemispheric asymmetries and hemineglect. Frontiers in Human Neuroscience, 7, 1-6. Skottun, B. C., & Skoyles, J. R. (2011). On identifying magnocellular and parvocellular responses on the basis of contrast-response func- tions. Schizophrenia Bulletin, 37, 23-26. http://dx.doi.org/10.1093/schbul/sbq114 Slaghuis, W. L. (1998). Contrast sensitive for stationary and drifting spatial frequency gratings in positive- and negative-symptom Schizo- phrenia. Journal of Abnormal Psychology, 107, 49-62. http://dx.doi.org/10.1037/0021-843X.107.1.49 Slaghuis, W. L., & Thompson, A. K. (2003). The effect of peripheral visual motion on focal contrast sensitivity in positive- and nega- tive-symptom Schizophrenia. Neuropsychology, 41, 968-980. Solomon, A. (2002). O demônio do meio-dia: Uma anatomia da de- pressão. Rio de Janeiro: Objetiva. Souza, G. S., Gomes, B. D., Saito, C. A., Silva Filho, M., & Silveira, L. C. L. (2007). Spatial luminance contrast sensitivity measured with transient VEP: Comparison with psychophysics and evidence of mul- tiple mechanisms. Investigative Ophthalmology and Visual Science, 48, 3396-3404. http://dx.doi.org/10.1167/iovs.07-0018 Szabó, Z., Antal, A., Tokaji, Z., Kálmán, J., Kéri, S., Benedek, G., & Janka, Z. (2004). Light therapy increases visual contrast sensitivity in seasonal affective disorder. Psychiatry Research, 126, 15-21. http://dx.doi.org/10.1016/j.psychres.2003.12.013 Valberg, A., & Rudvin, I. (1997). Possible contributions of magnocel- lular- and parvocellular-pathway cells to transient VEPs. Visual Neuroscience, 14, 1-11. http://dx.doi.org/10.1017/S0952523800008701 Vassilev, A., Stomonyakov, V., & Manahilov, V. (1994). Spatial-fre- quency specific contrast gain and flicker masking of human transient VEP. Visual Research, 34, 863-872. http://dx.doi.org/10.1016/0042-6989(94)90036-1 Ventura, D. F., Simões, A. L., Tomaz, S., Costa, M. F., Lago, M., Costa, M. T. V., Canto-Pereira, L. H. M., Souza, J. M., Faria, M. A. M., & Silveira, L. C. L. (2005). Colour vision and contrast sensitivity losses of mercury intoxicated industry workers in Brazil. Environmental Toxicology and Pharmacology, 19, 523-529. Vleugels, L., van Nunen, A., Lafosse, C., Ketelaer, P., & Vandenbuss- che, E. (1998). Temporal and spatial resolution in foveal vision of multiple sclerosis patients. Vision Research, 38, 2987-2997. Wesner, M. F., & Tan, J. (2006). Contrast sensitivity in seasonal and nonseasonal depression. Journal of Affective Disorders, 95, 19-28. Wetherill, G. B., & Levitt, H. (1965). Sequential estimation of points on a psychometric function. British Journal of Mathematical and Statistical Psychology, 18, 1-10. http://dx.doi.org/10.1111/j.2044-8317.1965.tb00689.x Wolman, B. B., & Stricker, G. (1990). Depressive disorders: Facts, theories, and treatment methods. New York: Wiley. World Health Organization (2001). Mental health: New understanding, new hope. http://www.who.int/whr/2001/en World Health Organization (2012). Depression: What is depression?
|