 Vol.4, No.11, 595-607 (2013) Agricultural Sciences http://dx.doi.org/10.4236/as.2013.411080 Analysis of determinants of gross margin income generated through fishing activity to rural households around Lake Ziway and Langano in Ethiopia Dawit Garoma1*, Asefa Admassie2, Gezahegn Ayele3, Fekadu Beyene1 1Collage of Agriculture, School of Agricultural Economics and Agricultural Business, Haramaya University, Dire Dawa, Ethiopia; *Corresponding Author: dgaromaa@yahoo.com 2IFPRI, Ethiopian Economics Association, Addis Ababa, Ethiopia; aadmassie@yahoo.com 3USAID, Addis Ababa, Ethiopia; ayeleg2002@yahoo.com Received 16 August 2013; revised 16 September 2013; accepted 15 October 2013 Copyright © 2013 Dawit Garoma et al. This is an open access article distributed under the Creative Commons Attribution License, which permits unrestricted use, distribution, and reproduction in any medium, provided the original work is properly cited. ABSTRACT This article analyzed determinants of gross mar- gin income from fishing to the rural households around Lake Ziway and Langano in Ethiopia. Four districts adjacent to the two lakes were selected purposively from which 179 respon- dents drawn randomly. Both primary and sec- ondary inform ation comprises of househ old struc- ture and assets, climate factors and supportive services were organized. Data analysis em- ployed descriptive statistics, budgetary analysis and the Ricardian method. Budgetary analysis showed positive fish gross margin income (GMI) of ETB 3,023.40 to average fisher. The Ricardian analysis made use of the climate only model (Model 1) and comprehensive model (Model 2). Using Model 1, water level raise due to inflow is vit al to earn fair income in addition to the rainfall amount in Season 1, which is supported with positive impact of precipitation water level in- teraction on fish income. Impact of precipitation was positive in Season 3, due to meher rainfall and withdrawal of fishing labor to join agricul- ture that minimized over fishing. Using Model 2, precipitation water level interaction has positive impact in Season 2 due to better inflow and Meher rainfall. The interaction term was negative in Season 4 attributed to decreased water level, dry weather and less precipitation. The result also showed positive impact of household mem- bers participation, participation in the traditional financial arrangement and capacity to finance operating costs. The study highlights problems facing fishing business like: decreased lake size and water volume, lake turbidity and siltation, open access and weak institutional arrangement to guide fishing efforts, wetland farming and ex- p ansion of irrigation to the lake side, c ost of fi s h - ing materials, minim um sales price as well as poor access to the fish market. Hence, strengthening fishery co-operatives, awareness creation, off- farm opportu nities, integrated conservation works, reduced wetland farming and acquaintance to social networks were suggested. Keywords: Lake Ziway; Lake Langano; Fishing Household; Gross Margin; Ricardian Technique; Ethiopia 1. INTRODUCTION Fish is highly nutritious, so even small quantities can improve people’s diets. Fish provides about 20 percent of animal protein intake in developing countries and this can reach 90 percent in Small Island Developing States (SIDS) or coastal areas. Fisheries can also contribute in- directly to food security by providing revenue for food- deficient countries to purchase food. Fish exports from low-income, food-deficient countries are equivalent to 50 percent of the cost of their food imports [1]. The number of people directly employed in fisheries and aquaculture is conservatively estimated at 38 million, of which over 90 percent are small-scale fishers. Small-scale fisheries, and especially inland fisheries, have also often been mar- ginalized and poorly recognized in terms of contribution Copyright © 2013 SciRes. OPEN ACCESS  D. Garoma et al. / Agricultural Sciences 4 (2013) 595- 607 596 to food security and poverty reduction [2]. Capture fish- ery resources were seen as the quintessential “common pool” (open to all) resources [3]. Traditional, small-scale or artisanal fisheries are used to characterize those fish- eries that were mainly non-mechanized with low level of production. In spite of the relevance of artisanal fishing to the economy, only few studies have been carried out to assess the profitability of the enterprise and constraints faced by the fishermen [4]. It is against this background that the research sets out to determine quantitatively the amount of income earned from fish catch and factors affecting fish income around Lake Ziway and Lake Langano of Ethiopia. The findings of the research can assist in identifying the significance of factors affecting fish income and guide policymakers and development actors in identifying priority areas of intervention to improve income from fishing activities to a given household. 2. MATERIALS AND METHODS 2.1. The Study Area The study area was four districts around Lake Ziway and Langano, in Ethiopia. The two lakes are located in the South-eastern direction of Addis Ababa at a distance of 175 km and 190 km, respectively. Agro-climatically, the area classified into midland (1500 - 2500 meter above sea level) and lowland (500 - 1500 meter above sea level) with proportion of 30% and 70%, respectively [5]. The two lakes are found in the Great East African Rift Valley and located between 7˚51ʹN to 8˚57ʹN and 38˚43ʹ E to 38˚57ʹE. Lake Ziway has a water surface of 440 km2 with an average depth of 2.5 meters. Lake Langano own 241 km2 water surface with an average depth of 17 meter. The annual fish potential of Lake Ziway and Langano is estimated to be 2941 tons and 1000 tons, respectively [20]. Lake Ziway basin covers Dugda, Adami Tulu Jido Kombolcha and Ziway Dugda districts. Lake Langano basin covers Adami Tulu Jido Kombolcha and Arsi Negelle districts. Figure 1 shows the geographic location of the studied district in Ethiopia and the respective zones. The study area enjoys bi-modal rainfall. Belg1 rain usually commences in March & ends in April. Meher2 season takes place from June-August is considered to be the long rainy season during which major crops like cereals, pulses, oil crops and the like are cultivated. The average annual rainfall of the area ranges from 800 mm to 1100 mm while the mean annual temperature varies between 11˚C and 29˚C. The human population of the study districts is 770,799, of which 22% are in Dugda, 21% in Adami Tulu Jido Kombolcha, 39% in Arsi Negelle and 18% in the Ziway Dugda district. With population density of 138 persons per km2, the average family size was 6.01. The average land holding is 1.5 hectares per household. 2.2. Data and Analytical Tools Purposive sampling was used to select the four dis- tricts. Sample respondents of 179 households were ran- domly drawn to generate data taking the 2011/2012 pro- duction year. The sampled households were further de- composed into 86 fishing households who were fishery cooperative members and 93 fishing households who were non-cooperative members. Primary information captures household general char- acteristics, fishing participation, fishery cooperative mem- bership status, asset holding, farmland holding, crops production, livestock raring, infrastructure services and others. Secondary information was obtained from the Na- tional Meteorological Service Agency (NMSA), Central Statistical Authority, Federal Ministry, Zonal and district agricultural offices. Climate data on precipitation and temperature were obtained from seven Meteorological stations located around the lakes. Water level data were obtained from Federal Ministry of Water Resources and Energy. 2.3. Method of Data Analysis 2.3.1. Conceptual Framework of Fish Income Analysis A gross margin for an enterprise is its financial output minus its variable costs [6]. Similarly [7] found positive net margin per fisher using the gross margin analysis. Study had using 92 respondents have found income from fishing to be attractive [8]. By employing descriptive statistics, budgetary and regression analysis fish farming is proofed to be economically rewarding and profitable. The relationship between the endogenous variable and each of the exogenous variables can be examined using linear, exponential, logarithm and quadratic functional forms [9]. To determine the extent of relationship be- tween socio-economic factors and the level of non-farm income, four functional regression forms were tried, and a lead equation was chosen on the basis of R2, F-ratio, number of significant variables and a–priori expectations [10]. In the study of whether changes in Hartwell Lake’s water level affect regional economic activity, and by how, linear and nonlinear regression analysis and other statis- tical techniques were used. These models were used to evaluate the strength of the relationships between key easures of lake-related activity and water levels in 1Belg season represents the shorter rainy season. 2Meher season represents the longer rainy season. m Copyright © 2013 SciRes. OPEN ACCESS  D. Garoma et al. / Agricultural Sciences 4 (2013) 595- 607 Copyright © 2013 SciRes. 597 Lake Ziw ay A bija ta Shala lake Langano La k e Dugda A.Tulu J. Kombolcha Bora Zeway Dugda Arsi Neg ele East Shewa Arsi We st Ar si Lake Ziway Abijata Shala lake Langano La k e Dugda A.Tulu J. Kombolcha Bora Zew ay Dugda Arsi Ne ge le 1: 1000000 L ocatio n Map of the study di stricts L ocati on of study dist rcts in Ethiopia Location of study districts in Zones Figure 1. Geographical location of the study area. Hartwell Lake. The inclusion of a quadratic term high- lights the significance of nonlinear behavior between lake level and gross sales [11]. To determine the eco- nomic impact of fresh fish marketing descriptive statis- tics, linear regression and market margin were employed [12] that recommend moderate tax rate regulated by government. Economic analysis of smoked fish market- ing was conducted using regression model [13]. The re- sult indicates, 94.6% of the variation in the sales value explained by household structure, operating and acquisi- tion costs. Despite the widespread interest, study on im- pact of climate variable on fish income was limited. In many cases, studies had on fishing have employed linear regression and discrete choice models, ignoring the in- fluence of climate variables in the predictors domain of the income derived to households [14]. Two main methods have been used in the literature to study the impact of climate change on agriculture. The traditional approach is a production function method which relies on empirical or experimental production function to predict environmental change and the Ricar- dian approach that uses economic data on the value of land to analyze the impact of climate on agriculture. Linear and quadratic terms are included in the regression analysis to reflect the non-linearity that are apparent from field studies. The linear term reflects the marginal value of climate evaluated at the mean, while the quad- ratic term shows how that marginal effect will change as one moves away from the mean. However, this approach has been criticized for not fully controlling for the impact of important variables that could also explain the varia- tion in farm incomes, for assuming that prices are con- stant and adjustment costless, and for possibly yielding biased result when land within location is heterogeneous and land owners behave optimally [15]. Consequently, Farmers at particular sites take environmental variables like climate as given and adjust their inputs and outputs accordingly. The Ricardian method was used to measure how climate affects current net revenues. This method is a cross-sectional technique that regresses net revenues on independent variables [16]. This method has been ap- plied to selected countries in the low latitudes, namely Brazil and India, using district level data, and Sri Lanka and Cameroon [17], using household level data. Origi- nally presented by Mendelsohn, Nordhaus and Shaw the Ricardian model is a cross sectional analysis of the im- pact of climate on land value or farm revenue. In coun- tries with a large percentage of small farmers and unde- OPEN ACCESS  D. Garoma et al. / Agricultural Sciences 4 (2013) 595- 607 598 veloped land markets, farm revenue is used. The model uses a multiple regression approach where the farm value/land revenue is regressed on climatic variables such as temperature, rainfall and rate of runoff of rainfall, geophysical variables such as soil type, soil erosion, sa- linity, flood probability and wind erosion and economic variables. The estimated model is then used to predict the effects of future changes in the climatic and geophysical variables on farm revenues or land values [18]. By col- lecting data from farm households in different agro- ecological zones of the county, net crop revenue per hec- tare was regressed on climate, household and soil vari- ables. The results show that these variables have a sig- nificant impact on the net crop revenue per hectare of farmers under Ethiopian conditions [19]. The impact of long term climate on agriculture productivity was exam- ined by applying Ricardian technique to estimate the effect of climate change on the smallholder agriculture sector in Sri Lanka. The study assumes that Net revenue (NR) depends on climate and a host of exogenous deter- minants [20]. Study had on impact of climate change on rice agriculture in Nigeria employed the Ricardian model [21]. The results clearly demonstrate irrigation as a sig- nificant technique used by the farmers to adapt to the climate change. Although research work has been done on fish management at Lake Ziway [22] little attention was given to quantitatively determine factors that affect income derived from fish catch. Hence, the conceptual framework of this resaerch work was defined in Figure 2. 2.3.2. Analytical Framework of Fish Income Analysis 1) Descriptive Statistics Descriptive analysis involved the use of frequency distribution, percentages and tabulation of results. Hence, results of the survey were summarized using statistical tools that characterize fishing households. 2) Budgetary Technique Gross margin (GM) is expressed as: GMTR TVC (1) NIGM TFC (2) where; GM = Gross margin/year; TR = Total revenue (ETB); TVC = Total variable cost (ETB); NI = Net in- come (ETB); TFC = Total fixed cost (ETB). Fixed cost were depreciated using straight line method represented as: VS N (3) V = Original value of fixed input; S = Salvage value N = No. of economically useful live. Climate variable Fish Income Household structure Household asset Supportive service Figure 2. Conceptual framework of the study. 3) The Ricardian Model The Ricardian method is a cross-sectional approach to studying agricultural production. It was named after David Ricardo (1772-1823) because of his original ob- servation that the value of land would reflect its net productivity. Farmland net revenues (V) reflect net productivity. This principle is captured in the following equation: ,, ,,ii xVPQXFHZGPX (4) where Pi = market price of cropi; Qi = output of cropi; X = vector of purchased inputs (other than land); F = vector of climate variables; H = water flow; Z = vector of soil variables; G = vector of economic variables such as market access and Px = vector of input prices. The farmer is assumed to choose X to maximize net revenues given the characteristics of the farm and market prices. The Ricardian model is a reduced form model that examines how several exogenous variables, F, H, Z and G, affect net revenues [23]. The standard Ricardian model relies on a quadratic formulation of climate: 2 123 45oVBBFBF BHBZBGU (5) where Bo-B5 = Coefficients/parameters; U = Error term. Both a linear and a quadratic term for temperature and precipitation are introduced. The quadratic term reflects the non-linear shape of the net revenue climate response function (Equation 5). The expected marginal impact of a single climate variable on farm net revenue evaluated at the mean is: 1, 2,2ii i EdVdfbBE f i (6) Linear and quadratic terms are included in the regres- sion analysis to reflect the non-linearity that are apparent from field studies. The linear term reflects the marginal value of climate evaluated at the mean, while the quad- ratic term shows how that marginal effect will change as one moves away from the mean. When the quadratic term is positive, the net revenue function is U-shaped and when the quadratic term is negative, the function is hill-shaped. We expect, based on agronomic research and Copyright © 2013 SciRes. OPEN ACCESS  D. Garoma et al. / Agricultural Sciences 4 (2013) 595- 607 599 previous cross-sectional analyses, that farm value will have a hill-shaped relationship with temperature. For each crop, there is a known temperature at which that crop grows best across the seasons. The relationship of seasonal climate variables, however, is more complex and may include a mixture of positive and negative coef- ficients across seasons. The change in annual welfare, ΔU, resulting from a climate change from C0 to C1 can be measured as fol- lows. 1UVC VC 0 (7) If the change increases net income it will be beneficial and if it decreases net income it will beharmful. 3. RESULT AND DISCUSSION 3.1. Distribution of Fishing Households The fishing households were drawn from four districts found adjacent to Lake Ziway and Lake Langano as presented in Table 1. Lake Ziway is accessed by 77.1% of the respondents found in Dugda, Adami Tulu Jido Kombolcha and Ziway Dugda districts. Lake Langano is largely accessed by Arsi Negelle district households (22.9%) in addition to the 25 households from Adami Tulu Jiddo Kombolcha district. Majority (90.5%) of the respondents were male while the female constitute 9.5%. This result is also in agreement with the traditional gender pattern of fishing [24]. For details refer Table 2. As presented in Ta ble 2, Most of (59.2%) the respon- dents were in the age of 30 - 45 years with minimum participation of elders (age > 60 years), which accounts for 1.7%. Consequently, 79.3% of respondents were in- volved in fishing for more than six years and 95% of them were in their original place. Only 5% of house- holds were come to the area because of marriage and employment opportunity. Respondents were distributed over a wide range of educational backgrounds with 14% who did not access formal education (illiterate), 85.5% Table 1. Fishing household distribution. Household distribution by District Gender composition Dugda Adami Tulu Jido Kombolcha Arsi Negelle Ziway Dugda Total Male 32 52 39 39 162 Female 5 9 2 1 17 Total 37 61 41 40 179 Percentage 20.7 34.1 22.9 22.3 100 Kebele 9 11 10 8 38 Source: Computed from data of 2011/12 household survey. Kebele is the lowest unit in the government administrative structure Table 2. Respondents socio-economic characteristics. Category Frequency Percentage Age (years) 20 - 29 41 22.9 30 - 45 106 59.2 46 - 60 29 16.2 >60 3 1.7 Original place of respondents This locality 170 95 Other locality 9 5 Fishing experience (years) Less than 6 37 20.7 6 - 15 108 60.3 16 - 30 34 19 Education level of respondents No formal (illiterate) 25 14 Grade 1 - 4 141 78.8 Grade 5 - 8 12 6.7 Grade 9 - 10 1 0.6 Family size Less than 5.6 135 75.3 5.6 & above 44 24.7 Source of fishing labor Family labor 175 98 Shared labor 4 2 Ethnic composition Oromo 160 89.4 Non-Oromo 19 10.6 Religious affiliation Orthodox 57 31.8 Muslim 103 57.5 Protestant 12 6.7 Wakefata 7 3.9 Farmland holding (ha) Less than 2.02 117 65 2.02 & above 62 35 Livestock holding (TLU) None 45 25.1 Between 0 & 4.6 51 28.5 Above 4.6 83 46.4 Copyright © 2013 SciRes. OPEN ACCESS  D. Garoma et al. / Agricultural Sciences 4 (2013) 595- 607 600 Continued Fishing operating cost Less than ETB 551 19 11 ETB 551-1185 74 41 ETB 1185-1819 71 40 Greater than ETB 1819 15 8 Cooperative membership status Member 86 48 Non-member 93 52 Equib financing No 65 36 Yes 114 64 Access to formal finance Yes 96 54 No 83 46 Distance from big market Less than 1 km 79 44.1 1 - 5 km 45 25.1 5 - 10 km 39 21.8 Above 10 km 16 9 Household Adult equivalence Total adult equivalent Percentage Age less than 10 years 118.1 11.3 Age 10 - 13 years 913.5 86.9 Age greater than 13 years 19.2 1.8 Observations 179 100 Source: Computed from data of 2011/12 household survey. had primary education, and 0.6% had secondary educa- tion. The average family size of fishing households was 5.6 with the minimum of 2 and maximum members of 12. Family labor constitutes the highest proportion (98%) of labor sources to the fishing households. Consequently, the total adult equivalence (AE) of fishing households was 1050.8. The higher proportion of AE (86.9%) was attached to age group 10 - 13 years followed by below 10 years age (11.3%). The lowest proportion attched to greater than 13 years indicating less adult members in the household composition. The majority (89.4%) of the respondents were Oromo, while 10.9% were from Am- hara, Hadiya and Guraghe people. The non-Oromo re- spondents were come to the area in search of employ- ment and through marriage arrangements since longer time. The minimum stay of the non-Oromo household were 12 years, as a result they consider the current loca- tion as their original place. The majority of them are Muslim with 57.5%, followed by Orthodox Christianity of 31.8%. Consequently, 6.7% account for Protestant and the remaining 3.9% are Wakefata3 followers. For details refer Table 2. The average farmland holding is 2.02 hectares to cul- tivate crops. 65% of the respondents own less than the average and 35% owned above the average. The mini- mum and maximum farmland holding is zero and five hectares, respectively. The available land was wholly used for crop cultivation during the long rainy season (June-August). On the other hand, about 42% of the fishing households were using part of their farmland for irrigation in the dry season mainly to cultivate vegetables such as onion, tomato, potatoes, and the like. Only 4.5% of the fishing households were cultivated their farmland in the belg season, the short rainy season (February- April). An average household owns 4.6 TLU of livestock, while about 25.1% of the respondents did not own live- stock. With the mean value of ETB 1185 per respondnet, the minimum and maximum operating expense associ- ated to fish catch is ETB 258.00 and ETB 5046.00, re- spectively. For details refer Table 2. From the study result, 48% of the fishing households were registered into fishing cooperatives, while 52% involve in fishing without securing membership status. Almost 64% of fishers were reported to involve in Ekub4, a traditional financial arrangements to raise cash to over- come immediate financial constraints. Despite the poor outreach and tight criteria, 54% of the respondnets showed inteerst to use formal financing. Formal sources are usually accessed for other agricultural and off-farm activities other than fishing. About 69.2% of the respon- dents were located within 5 km distance from the nearest big market. The markets are usually located across all weather roads and believed to have customers of the fish products. On the other hand, 21.8% of the respondents are located at 5 - 10 km and 9% are required to travel more than 10 km to reach the big market. The results were presented in Table 2. The climate variables considered for this study were precipitation, water level, and temperature. There are many ways one could represent monthly temperatures and precipitation data in a Ricardian model. It is not ad- visable to include every month, because there is a high correlation between adjacent months, thus three months average season were used. In this study, climate variables 3Cultural belief among Oromo people. 4Equib is traditional cooperative or traditional self-help group, is a rotating saving and credit type association whose members make regu- lar contributions to a revolving loan fund. Its formation is based on classes of people who have identical (similar) earning or income. Unlike saving and credit cooperatives, it does not bear interest on the money saved or collected. Copyright © 2013 SciRes. OPEN ACCESS  D. Garoma et al. / Agricultural Sciences 4 (2013) 595- 607 Copyright © 2013 SciRes. OPEN ACCESS 601 were incorporated by classifying the study period in to four seasons. Accordingly, months were classified as Season 1 (February-April), Season 2 (May-July), Season 3 (August-October) and Season 4 (November-January). The seasons were classified considering the seasonal variability of fishing activities and its market perform- ance. In certain cases, climate data were not properly registered. These problem was observed with water level and temperature data. As a result, some months were left blank for the climate variables. Hence, the researcher was dictated to systematically consider the average of available data alone, ignoring months with blank record. The average value of months with data record was con- sidered to obtain the seasonal average data. From the study result, the minimum and maximum precipitation record was observed in Season 4 and Sea- son 3, with mean record of 34.24 mm and 304.88 mm, respectively. Consequently, the minimum and maximum temperature record was in Season 4 and Season 2 indi- cating average of 15.32˚C and 18.77˚C, respectively. Likewise, the mean minimum and maximum water level record was 1.01 meter and 1.88 meter in Season 4 and Season 2, respectively. On the other hand, the interaction term of precipitation water level indicated mean mini- mum of 47.82 in Season4 and 447.85 in Season 3. The deatils of the results were presented in Table 3. 3.2. Fish Income Analysis (Gross Margin Analysis) The total fish caught in the study year was 115,825.3 kg. Accordingly, the total revenue from the sales of fish caught was ETB 984,515.20. The study reveals that the fishing household has realized an average gross revenue of ETB 5500.10. The variable cost items comprises of the expenses of labor, fuel lubricant, repair and mainte- nance, fish processing sanitation and transportation, food & drink or entertainment and the like, which is worked out to be ETB 2476.70 (one USD=17ETB). Thus, gross margin for each fishermen was calculated as the differ- ence between the gross revenue and variable costs. Ac- cordingly, the average gross margin per fishing house- hold was ETB 3,023.40. Consequently, the net income as the difference between the gross revenue and total costs was ETB 1,899.00. The result of the study revealed that fishing household gets less income from fishing taking the average family size. This could be partly explained by the lower price offered in the local market and at the landing site, and less quantity of fish catch as compared to the fishery potential of the two lakes due to increased number of fishermen. For details refer Table 4. 3.3. Factors Affecting Fish Gross Margin Income 3.3.1. Estimation Issues For the climate variable we present results of precipi- tation, temperature in squared term and precipitation water level interaction due to co-linearity of temperature and water level in linear terms. Similarly, the correlation value between precipitation and water level were similar across the four seasons. Hence, interaction terms of pre- Table 3. Climate variables. Variable Obs Mean Std. Dev. Min Max Precipitation_Season 1 (Feb.-April) 179 149.94 24.45 117.40 174.32 Precipitation_Season 2 (May-July) 179 304.88 45.11 248.94 389.07 Precipitation_Season 3 (Aug.-Oct.) 179 242.06 65.94 174.49 412.30 Precipitation_Season 4 (Nov.-Jan.) 179 34.24 16.02 21.04 63.97 Temperature_Season 1 (Feb.-April) 179 16.79 4.81 11.08 21.27 Temperature _Season 2 (May-July) 179 18.77 3.49 14.39 21.92 Temperature _Season 3 (Aug.-Oct.) 179 17.73 3.69 13.60 21.31 Temperature _Season 4 (Nov.-Jan.) 179 15.32 7.80 6.07 22.79 Water level _Season 1 (Feb.-April) 179 1.03 0.22 0.99 1.77 Water level _Season 2 (May-July) 179 1.88 0.15 1.43 2.15 Water level_Season 3 (Aug.-Oct.) 179 1.48 0.35 0.81 1.13 Water level _Sesaon 4 (Nov.-Jan.) 179 1.01 0.38 0.75 1.20 Precipitation Water level_Season 1 (Feb.-April) 179 159.01 52.49 88.05 209.18 Precipitation Water level _Season 2 (May-July) 179 306.64 55.20 201.64 439.65 Precipitation Water level _Season 3 (Aug.-Oct.) 179 447.85 111.21 249.52 721.35 Precipitation Water level _Season 4 (Nov.-Jan.) 179 47.82 20.42 20.83 113.23 Source: Computed from secondary data, 1981-2011. 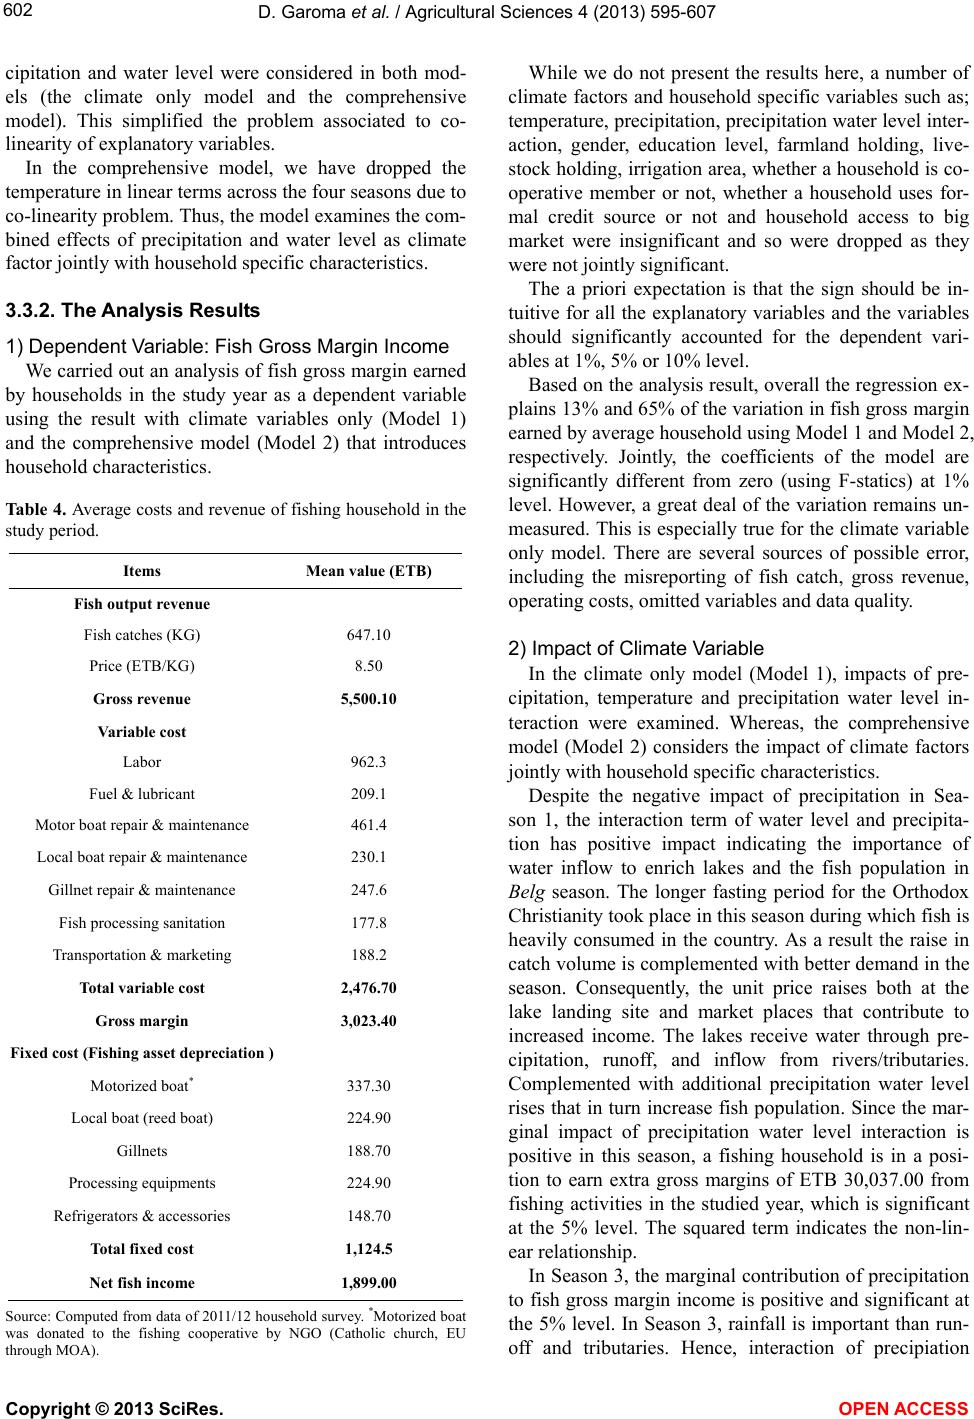 D. Garoma et al. / Agricultural Sciences 4 (2013) 595- 607 602 cipitation and water level were considered in both mod- els (the climate only model and the comprehensive model). This simplified the problem associated to co- linearity of explanatory variables. In the comprehensive model, we have dropped the temperature in linear terms across the four seasons due to co-linearity problem. Thus, the model examines the com- bined effects of precipitation and water level as climate factor jointly with household specific characteristics. 3.3.2. The Analysis Result s 1) Dependent Variable: Fish Gross Margi n Income We carried out an analysis of fish gross margin earned by households in the study year as a dependent variable using the result with climate variables only (Model 1) and the comprehensive model (Model 2) that introduces household characteristics. Table 4. Average costs and revenue of fishing household in the study period. Items Mean value (ETB) Fish output revenue Fish catches (KG) 647.10 Price (ETB/KG) 8.50 Gross revenue 5,500.10 Variable cost Labor 962.3 Fuel & lubricant 209.1 Motor boat repair & maintenance 461.4 Local boat repair & maintenance 230.1 Gillnet repair & maintenance 247.6 Fish processing sanitation 177.8 Transportation & marketing 188.2 Total variable cost 2,476.70 Gross margin 3,023.40 Fixed cost (Fishing asset depreciation ) Motorized boat* 337.30 Local boat (reed boat) 224.90 Gillnets 188.70 Processing equipments 224.90 Refrigerators & accessories 148.70 Total fixed cost 1,124.5 Net fish income 1,899.00 Source: Computed from data of 2011/12 household survey. *Motorized boat was donated to the fishing cooperative by NGO (Catholic church, EU through MOA). While we do not present the results here, a number of climate factors and household specific variables such as; temperature, precipitation, precipitation water level inter- action, gender, education level, farmland holding, live- stock holding, irrigation area, whether a household is co- operative member or not, whether a household uses for- mal credit source or not and household access to big market were insignificant and so were dropped as they were not jointly significant. The a priori expectation is that the sign should be in- tuitive for all the explanatory variables and the variables should significantly accounted for the dependent vari- ables at 1%, 5% or 10% level. Based on the analysis result, overall the regression ex- plains 13% and 65% of the variation in fish gross margin earned by average household using Model 1 and Model 2, respectively. Jointly, the coefficients of the model are significantly different from zero (using F-statics) at 1% level. However, a great deal of the variation remains un- measured. This is especially true for the climate variable only model. There are several sources of possible error, including the misreporting of fish catch, gross revenue, operating costs, omitted variables and data quality. 2) Impact of Climate Variable In the climate only model (Model 1), impacts of pre- cipitation, temperature and precipitation water level in- teraction were examined. Whereas, the comprehensive model (Model 2) considers the impact of climate factors jointly with household specific characteristics. Despite the negative impact of precipitation in Sea- son 1, the interaction term of water level and precipita- tion has positive impact indicating the importance of water inflow to enrich lakes and the fish population in Belg season. The longer fasting period for the Orthodox Christianity took place in this season during which fish is heavily consumed in the country. As a result the raise in catch volume is complemented with better demand in the season. Consequently, the unit price raises both at the lake landing site and market places that contribute to increased income. The lakes receive water through pre- cipitation, runoff, and inflow from rivers/tributaries. Complemented with additional precipitation water level rises that in turn increase fish population. Since the mar- ginal impact of precipitation water level interaction is positive in this season, a fishing household is in a posi- tion to earn extra gross margins of ETB 30,037.00 from fishing activities in the studied year, which is significant at the 5% level. The squared term indicates the non-lin- ear relationship. In Season 3, the marginal contribution of precipitation to fish gross margin income is positive and significant at the 5% level. In Season 3, rainfall is important than run- off and tributaries. Hence, interaction of precipiation Copyright © 2013 SciRes. OPEN ACCESS  D. Garoma et al. / Agricultural Sciences 4 (2013) 595- 607 603 water level showed negative impact. During this season, farmers were occupied with seasonal agricultural activi- ties. Besides, the demand for fish is fairly stable in the country. Hence, the number of fishermen reduces due to the pull effect of farming. Consequently, there is more water inflow due to runoff and tributaries that adds to rainfall directly received. Accordingly, household who is still in the fishing business were in a position to earn better income. The squared term is a significant showing non-linear relation. Due to overfishing of large-bodied fish species, there has been a gradual shift in fish capture from large and valuable carnivorous species to smaller, less valuable species that feed at lower trophic levels [25]. In three out of nine lakes (L. Tana, L. Ziway and L. Awassa) the fish community was numerically dominated by small fish species (i.e. Barbus spp.) which represent a low eco- nomical value for fisheries. Similarly, precipitation water level interaction has positive impact on gross margin income in season 2 (May-July) for the comprehensive model (Model 2). The longer rainy season took in this season that favor fish population and create favorable situation to easily collect the fish. Consequently, the increase in fish catch could contribute to income earned from fish output sales by enlarging the sales volume. Compared to the previous season, the fish population in this period raises signifi- cantly. In this season, consumers mainly the Christians are free to consume both animal and fish meat, as there is no religious obligation to abandon animal meat. Hence, the sales price is fairly stable in comparison to the pre- vious months. Despite the stability of fish price, still fishermen are benefiting from increased volume of fish catch to derive fair revenue. As a result, the impact of precipitation and water level interaction on fish gross margin is positive and statistically significant at 1% level. The negative sign for the square term in Season 2 reflects an increase of gross margin income at a decreasing rate. This could be explained by households engagement in a seasonal farming activities that demand labor, thus with- draw labor from fishing and reduce the catch volume at household level. In this season, fishermen attach priority to agriculture than fishing due to seasonal nature of cul- tivation and seeding of crops. Based on the results of Model 2, precipitation water level interaction reduces the level of gross margin in- come derived to average households in Season 4 (No- vember-January). In this season, precipitation is scanty and water level reduces. Complemented with the in- creased uses of the lake water for irrigation, the water level is believed to be highly depleted compared to the other three seasons. As a result the amount of fish catch is significantly reduced that directly affect the gross mar- gin income of fishing households. Hence, Season 4 is characterized with poor fish catch and the income de- rived from the enterprise. Accordingly, the marginal im- pact of precipitation water level interaction on gross margin is negative (−387), which is statistically signifi- cant at 1% level. The positive sign of squared term indi- cates the decrease in fish gross margin could be at in- creasing rate in Season 4. The significance of both linear and squared terms in- dicate the non-linear relationship between climate vari- able and the fish gross margin. However, depending on what seasonal precipitation or temperature is being ex- amined, the marginal impact of a climate variable could be either positive or negative [26]. 3) Impact of Household Specific Variables Considering the comprehensive model (Model 2) some of the control variables were significant. Increase in household members participation in the fishing activi- ties could increase the gross margin significantly. This is because, fishing requires energy, sufficient hours to travel on lakes to catch adequate quantity of fish output. Hence, the possibility to engage more labor into fishing could increase the chance of securing more catch that could be sold. Participation in Equib finance contribution could promote the likelihood of households to earn more income from fishing. This financial arrangement is con- sidered as alternative source of finance among neighbors/ relatives to ease cash constraints. Households who in- volve in fishing have the chance of getting regular cash income that could be dropped into equib as a saving strategy to accumulate cash to finance the fishing busi- ness and/or other priorities. The cash that could be ac- cumulated through equib contribution could serve for bulk purchases of fishing inputs and equipments that in turn help to expand the business. The marginal impact is statistically significant at 1% level. Income generated through fishing is also affected by the households capacity to finance the required fishing inputs and associated expenses. Provision of fishing ma- terials, timely repair and maintenance of the available inputs, deployment of fishing labor and others are be- lieved to increase fish income by raising the level of fish harvest and the gross revenue of fish catch in the studied year. Thus, financing of additional production inputs to support the fishing activities could result into increased gross margin income by 10 ETB, which is statistically significant at 1% level (Table 5). 3.4. Priority Problems of Fishing Activities Figure 3 shows the ranking of problems faced by the fishing households. Decrease in lake size/water volume was ranked first with 49% response. Impurity of lake water attributed to turbidity and siltation were ranked in the second with 31% response. Open access to the lake Copyright © 2013 SciRes. OPEN ACCESS 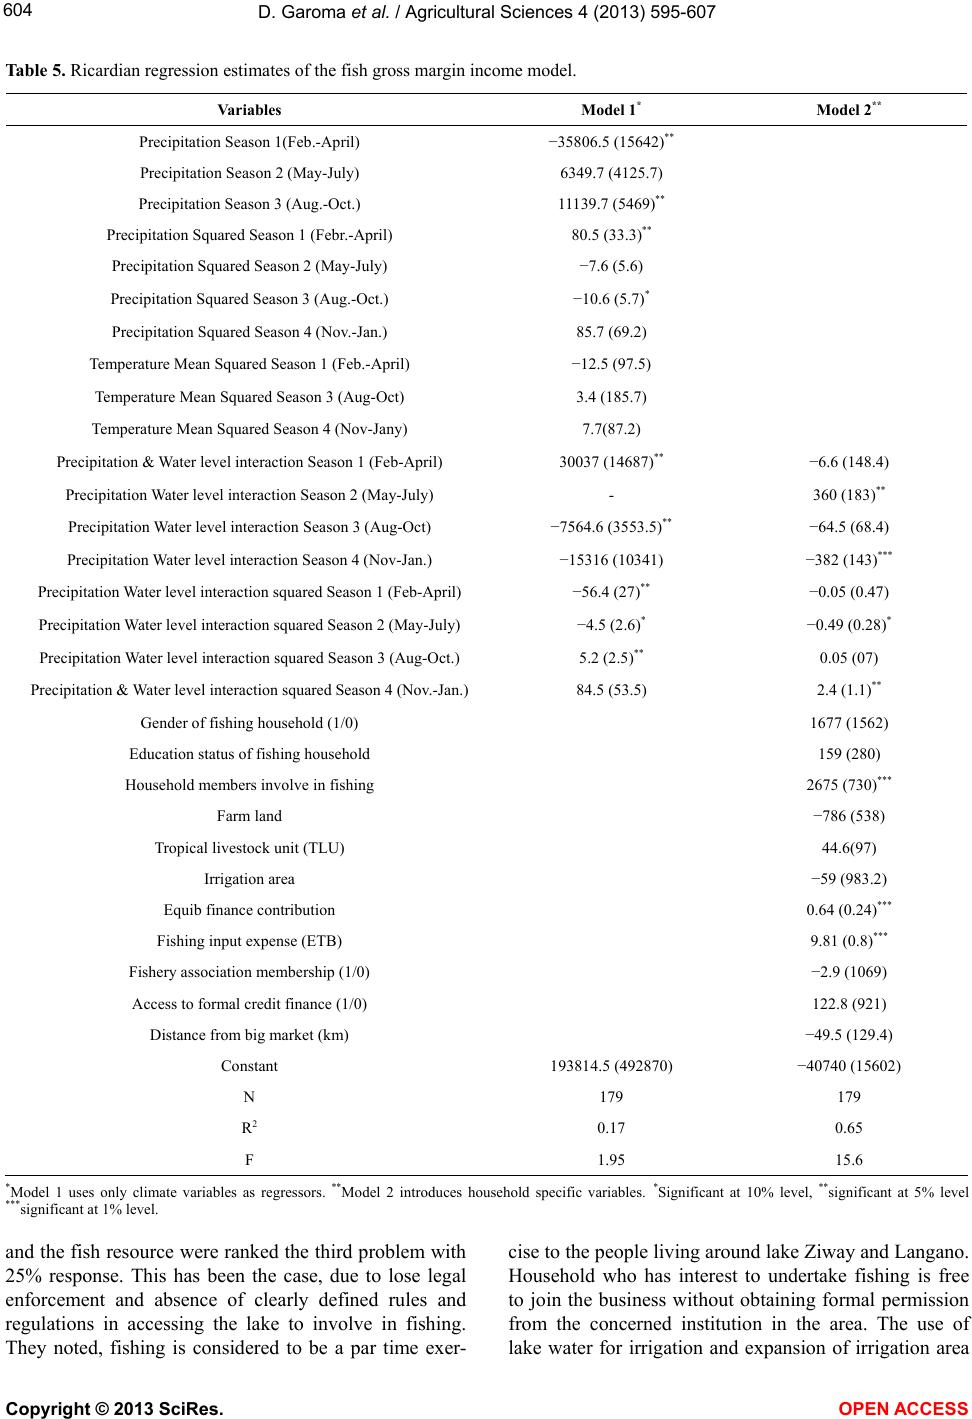 D. Garoma et al. / Agricultural Sciences 4 (2013) 595- 607 Copyright © 2013 SciRes. OPEN ACCESS 604 Table 5. Ricardian regression estimates of the fish gross margin income model. Variables Model 1* Model 2** Precipitation Season 1(Feb.-April) −35806.5 (15642)** Precipitation Season 2 (May-July) 6349.7 (4125.7) Precipitation Season 3 (Aug.-Oct.) 11139.7 (5469)** Precipitation Squared Season 1 (Febr.-April) 80.5 (33.3)** Precipitation Squared Season 2 (May-July) −7.6 (5.6) Precipitation Squared Season 3 (Aug.-Oct.) −10.6 (5.7)* Precipitation Squared Season 4 (Nov.-Jan.) 85.7 (69.2) Temperature Mean Squared Season 1 (Feb.-April) −12.5 (97.5) Temperature Mean Squared Season 3 (Aug-Oct) 3.4 (185.7) Temperature Mean Squared Season 4 (Nov-Jany) 7.7(87.2) Precipitation & Water level interaction Season 1 (Feb-April) 30037 (14687)** −6.6 (148.4) Precipitation Water level interaction Season 2 (May-July) - 360 (183)** Precipitation Water level interaction Season 3 (Aug-Oct) −7564.6 (3553.5)** −64.5 (68.4) Precipitation Water level interaction Season 4 (Nov-Jan.) −15316 (10341) −382 (143)*** Precipitation Water level interaction squared Season 1 (Feb-April) −56.4 (27)** −0.05 (0.47) Precipitation Water level interaction squared Season 2 (May-July) −4.5 (2.6)* −0.49 (0.28)* Precipitation Water level interaction squared Season 3 (Aug-Oct.) 5.2 (2.5)** 0.05 (07) Precipitation & Water level interaction squared Season 4 (Nov.-Jan.) 84.5 (53.5) 2.4 (1.1)** Gender of fishing household (1/0) 1677 (1562) Education status of fishing household 159 (280) Household members involve in fishing 2675 (730)*** Farm land −786 (538) Tropical livestock unit (TLU) 44.6(97) Irrigation area −59 (983.2) Equib finance contribution 0.64 (0.24)*** Fishing input expense (ETB) 9.81 (0.8)*** Fishery association membership (1/0) −2.9 (1069) Access to formal credit finance (1/0) 122.8 (921) Distance from big market (km) −49.5 (129.4) Constant 193814.5 (492870) −40740 (15602) N 179 179 R2 0.17 0.65 F 1.95 15.6 *Model 1 uses only climate variables as regressors. **Model 2 introduces household specific variables. *Significant at 10% level, **significant at 5% level ***significant at 1% level. and the fish resource were ranked the third problem with 25% response. This has been the case, due to lose legal enforcement and absence of clearly defined rules and regulations in accessing the lake to involve in fishing. They noted, fishing is considered to be a par time exer- cise to the people living around lake Ziway and Langano. Household who has interest to undertake fishing is free to join the business without obtaining formal permission from the concerned institution in the area. The use of ake water for irrigation and expansion of irrigation area l  D. Garoma et al. / Agricultural Sciences 4 (2013) 595- 607 605 Figure 3. Priority problems of fishing activities. to the lake catchment were ranked fourth with 23% re- sponse rate. Irrigated land expansion to the lakes com- mand area was also cited as the newly emerging prac- tice by households adjacent to the lakes. This problem has been widespread around Lake Ziway, since it is less saline with minimum conductivity level as compared to Lake Langano. High cost of fishing materials was ranked fifth with 20%. The study noticed, increased costs of fishing materials and equipments to the fishermen. Ac- companied with decreased fish catch and the associated income, the tendency to own fishing equipments with better capacity were limited among fishermen. Similarly, the capacity to cover costs of fishing materials exclu- sively from fish income is oftentimes poor. Also, poor access to market and minimum sales price were ranked the six problem facing fishermen with 4% response rate. This problem were noted by aged household as they sale the fish catch at landing site, where the price offered is significantly lower compared to the sales price in the central market and local urban area (Table 5). 4. SUMMARY AND CONCLUSIONS This study is a cross-sectional analysis of the fish in- come of household, relying on the Ricardian method to investigate the current impact of climate and household characteristics on gross margin income. Surveys of 179 rural households were combined with data on precipita- tion, temperature and water level from a number of sources. The study found that gross margin income of fishing households was sensitive to climate especially precipitation and water level. Considering the results of comprehensive model (Model 2), the combined effect of precipitation and water level is positive in Season 2 showing an increase in fish income due to Meher rain and the consequent raise in water level. In this season, water level raises due to rain, water inflow through run-off and tributary rivers with positive outcome on fish population which in turn increase fish catch and gross margin income of households. On the other hand, the im- pact of precipitation and the water level interaction on fish gross margin were negative in Season 4. The season is characterized with drier weather condition accompa- nied with insignificant precipitation and water level. Thus, they resulted in a decrease in the fish population and the catch level that considerably reduced the fish income to the household. The impact of temperature on fish gross margin was insignificant in all seasons, re- flecting the importance of precipitation and water level to enhance the fish population and the catch level. The result also noted the necessity to have more family members being involved in fishing, households’ partici- pation in traditional financial contribution (Equib) to raise cash and household capacity to finance operating costs of fishing activities. The marginal contribution of these variables on fish gross margin was positive sug- gesting the need to use more of the inputs in the fishing business. Some of the priority problems facing the fish population were decreased in lake size and water volume. Wetland farming and irrigation were common using Lake Ziway, while Lake Langano is mostly used for sand min- ing. In addition, lake turbidity and siltation were adverse to the fish population due to runoff caused by the poor vegetation cover of the lake catchment. Open access to the fish population, loose legal enforcement, cost of fishing materials, sales price, poor access to central mar- ket and the like were the challenges facing the fishing community around Lake Ziway and Langano. Accordingly, based on the study results the following conclusions were drawn: Fishery cooperatives are struc- tures supposed to implement community based manage- ment of the lakes and fish population. They were sup- posed to create market opportunity exclusive to their members to enable them benefit from sale of the fish output at completive price. Despite the fact, currently their performance is loose which is perhaps limited to collection of the fish output both from members and non-members at the lake site. The collected output was Copyright © 2013 SciRes. OPEN ACCESS  D. Garoma et al. / Agricultural Sciences 4 (2013) 595- 607 606 delivered to wholesalers, retailers, hotel and restaurants, and individual customers. Hence, there were no clear demarcation of services provided to the member house- hold and the non-members. As a result, fishermen were reluctant to join fishery cooperatives. Hence, the gov- ernment and non-government organizations directly working with the fishing business were advised to clearly define cooperatives role and responsibility and actively engage towards its application to proof tangible benefits accrued to cooperative members as opposed to non- members. In the study area, the fish population was exposed to open access problem. Illegal fishermen are rampant across the two lakes, and legal enforcements to deter their action were loose. As a result, overfishing was ob- served in Season 1 and Season 4, in which farming labor joins fishing business. This resulted in reduction of gross margin income obtained by a given household across the seasons. Hence, massive awareness creation were sought to change community attitude and perception on limited resources exploitation. Consequently, identifying and intensifying other off-farm opportunities is helpful to generate income to the households and systematically pull excessive labor from fishing activities. Due to poor vegetation cover, the magnitude of runoff was increasing that resulted in lake turbidity and siltation which affect the fish population and the catch level. Complemented with the cheap price at the lake site, the decrease in fish output significantly affects the gross margin earned by a household. Hence, integrated con- servation works shall be implemented to minimize impu- rity of water and to maintain suitable water level to the fish population. Wetland farming and irrigation use were common at Lake Ziway. On the other hand, Lake Langano is used for sand mining meant for construction purpose. This practice was a recent phenomenon that adversely affects the fish population and catch level. Hence, demarcation of the lake compound to exclusively nurture the fish population has been required to enhance the benefit ac- crued to fishermen. In many instances, provisions to be made through for- mal structures are limited especially with in the rural setting. Hence, a better understanding of social networks is essential, especially by examining how these networks are established and their working mechanisms. This could offer more insight and lead to their improvement. REFERENCES [1] Daw, T., Neil Adger, W., Brown, K. and Badjeck, M. (2008) Climate change and capture fisheries. University of East Anglia, Norwich, WorldFish Center, Penang, 2012. www.dfid.gov.uk [2] Food and Agriculture Organization (FAO) (2005) In- creasing the contribution of small-scale fisheries to pov- erty alleviation and food security. Technical Guidelines for Responsible Fisheries No. 10, Rome. www.rff.org [3] Gordon, R.M. (2010) From drain to gain in capture fish- eries rents. A synthesis study. Food and agriculture or- ganization of the United Nations. FAO Fisheries and Aquaculture Technical Paper, Rome. [4] Adewumi, M.O., Ayinde, O.E., Adenuga, A.H. and Zac- chaeus, S.T. (2012) The profitability analysis of artisanal fishing in Asa River of Kwara state, Nigeria. Interna- tional Journal of Development and Sustainability. www.isdsnet.com/ijds [5] Central Statistical Authority (CSA) (2007) Population census, Addis Ababa. [6] Firth, C. (2002) The use of gross and net margins in the economic analysis of organic farms. http://orgprints.org/8290/1/ . [7] Inioni, O.E., and Oyaide, W.J. (2007) Socio-economic analysis of artisanal fishing in the south agro-ecological zone of Delta State, Nigeria. Agricultural Tropical ET Subtropical, 40, 135-149. [8] Onemolease, E.A. andOriakhi, H.O. (2011) The profit- ability of artisanal fishing in Asa River of Kwara state, Nigeria. International Journal of Development and Sus- tainability. http://isdsnet.com [9] Olayemi, J. (1998) Elements of Applied Econometrics. A Publication of the Department of Agricultural Economics, University of Ibadan, Ibadan. [10] Ibekwe, U.C., Eze, C., Ohajianya, D., Orebiyi, J.S., On- yemauwa, C.S. and Korie, O.C. (2010) Determinants of non farm income among farm households in South East Nigeria. Journal of Academia Arena, 2, 29-33. [11] Allen, J.S., Carey, R.T., Dickes, L.A., Saltzman, E.W. and Allen, C.N. (2010) An economic analysis of low water levels in Hartwell lake. Clemson University, Clemson. [12] Ali, E.A., Gaya, H. and Jampada, T.N. (2008) Economic analysis of fresh fish marketing in maiduguri gamboru market and kachallari alau dam landing site of Northeast- ern, Nigeria. Journal of Agricultural Society Science, 4, 23-26. http://www.fspublishers.org [13] Oluwafunmilola, F.O. (2012) Economic analysis of smoked fish marketing in Owo local government area, Ondo-state, Nigeria. Continental Journal of Fisheries and Aquatic Science, 6, 38-46. http://www.wiloludjournal.com [14] Adewuyi, S.A., Phillip, B.B., Ayinde, I.A. and Akerele, D. (2010) Analysis of profitability of fish farming in Ogun State, Nigeria. Journal of Human Ecology, 31, 179-184. [15] Kurukulasuriya, P. and Rosenthal, S. (2003) Climate change and agriculture. A review of impacts and adapta- tions. The World Bank Environment Department. [16] Mendelsohn, R., Dinar, A. and Williams, L. (2006) The distributional impact of climate change. Environment and Development Economics, 11, 159-178. http://dx.doi.org/10.1017/S1355770X05002755 [17] Molua, E. (2002) Climate variability, vulnerability and effectiveness of farm-level adaptation options: The chal- Copyright © 2013 SciRes. OPEN ACCESS  D. Garoma et al. / Agricultural Sciences 4 (2013) 595- 607 Copyright © 2013 SciRes. OPEN ACCESS 607 lenges and implications for food security in Southwestern Cameroon. Environment and Development Economics, 7, 529-545. http://dx.doi.org/10.1017/S1355770X02000311 [18] Jain, S. (2007) An empirical economic assessment of impacts of climate change on agriculture in Zambia. The World Bank Development Research Group Sustainable Rural and Urban Development Team. http://dx.doi.org/10.1596/1813-9450-4291 [19] Temesgen, T. and Hassan, R. (2009) Economic impact of climate change on crop Production in Ethiopia: Evidence from Cross-section Measures. Centre for Environmental economics and Policy in Africa (CEEPA). Journal of Af- rican Economies, 18, 529-554. http://jae.oxfordjournals.org/content/18/4/529.abstract [20] Mohamed, A. and Kurukulasuriya, P. (2006) Application of the ricardian technique to estimate the impact of cli- mate change on smallholder farming in Sri lanka. http://www-wds.worldbank.org [21] Joshua, A., Abiodun, A. and Hassan, R. (2010) Impacts of climate change on rice agriculture in Nigeria. The Joint 3rd African Association of Agricultural Economists (AAAE) and 48th Agricultural Economists Association of South Africa (AEASA) Conference, Cape Town, 19-23 September 2010. [22] Felegeselam, Y. (2003) Management of Lake Ziway fish- eries in Ethiopia. Master’s Thesis. http://www.flmnh.ufl.edu [23] Mendelsohn, R., Nordhaus, W.D. and Shaw, D. (1994) The impact of global warming on Agriculture: A Ricar- dian Analysis. The American Economic Review, 84, 753- 771. www.jstor.org [24] Williams, S.B. and Awoyomi, B. (1998) Fish as a prime mover in the Economic life of Women in a fishing Com- munity. Proceedings of the 9th International conference of the International Institute of Fisheries Economics and Trade, Tromso, 8-11 July 1998. [25] Williams, S.B. and Awoyomi, B. (1998) Fish as a prime mover in the economic life of women in a fishing com- munity. Proceedings of the 9th International conference of the International Institute of Fisheries Economics and Trade, Tromso, 8-11 July 1998. [26] Kurukulasuriya, P. and Mendelsohn, R. (2008) A Ricar- dian analysis of the impact of climate change on African cropland. African Journal of Agricultural Research, 2, 4305.
|