Energy and Power Engineering, 2013, 5, 1037-1042
doi:10.4236/epe.2013.54B198 Published Online July 2013 (http://www.scirp.org/journal/epe)
Impacts of Electrical Line Losses Comprising Mul-
ti-Distributed Generation in Distribution System
Surakit Thongsuk1, Atthapol Ngaopitakkul2
1Faculty of Industrial Technology, Rajabhat Rajanagarindra University, Chachoengsao, Thailand.
2Department o f Electrical Engineer ing, Faculty of Engineering, King Mongkut’s Institute of Technology Ladkrabang,
Bangkok, Thailand
Email: surakit.tho@rru.ac.th, knatthap@kmitl.ac.th
Received April, 2013
ABSTRACT
This paper proposes to study the impacts of electrical line losses due to the connection of distributed generators (DG) to
22kV distribution system of Provincial Electricity Authority (PEA). Data of geographic information systems (GIS) in-
cluding the distance of distribution line and location of load being key parameter of PEA is simulated using digital si-
mulation and electrical network calculation program (DIgSILENT) to analyze power loss of the distribution system. In
addition, the capacity an d lo cation of DG installed in to the d istribution system is consid ered. The resu lts are shown that,
when DG is installed close to the substation, the electrical line losses are reduced. However, if DG capacity becomes
larger an d the distan ce between DG and load is long er, the electrical lin e losses tend to increase. The results of this pa-
per can be used to create the suitability and fairness of the fee for both DG and utility.
Keywords: Electri c al Loss; Distributed Generation ; Distribution System; Renewab l e E nergy
1. Introduction
Electricity generated by the distributed generators (DG)
is increasingly becoming widespread in many countries
including Thailand by getting the attention of power in-
dustry increasingly. The installation of distributed gen-
erators in the power system affects to distribution system
in several issues. These issues are extensive discussions
such as magnitude and direction of power flow, electrical
line losses, voltage profile, power factor, and fault level.
The electrical line losses are one of issues that is inter-
ested. Electrical line loss occurs when current flows
through transmission and distribution systems. The mag-
nitude of the loss depends on amount of flowing current
and the line resistance. If the capacity and location of the
distribution or generators optimal to the size and location
of the load, it will help to reduce the real power loss in
the line. However, in some cases, the capacity and loca-
tion of the generator of the group and improper loading
may lead to more real power loss in the line.
Based on studied research papers related to electrical
loss, in the literature [1, 2], the paper d iscusses the sizing
and installation of distributed generators to reduce power
losses in the distribution system including charges that
will be occurred by the power losses. The size and
placement of distributed generators installed in a suitable
to minimize the power loss at the distribution system is
analysed in [3-7]. In the literatu re [8-11 ], their pap ers use
a genetic algorithm, ant colony and fuzzy logic to ana-
lyze the optimal size and location for the installation of
distributed generators to reduce power loss and improve
the voltage in electrical system. As a result, all of the
above paper, the analysis and evaluation of electrical
power loss from only 1 DG are explained but these re-
search papers have been rarely mentioned about electri-
cal power loss from multi-distributed generators.
This paper studies the impact of multi-distributed gen-
erators (DG) when they are employed into the distribu-
tion system. The system under this study is from Provin-
cial Electricity Authority (PEA) that is a part of Thai-
land’s distribution system. The capacity and location of
distributed generators (DG) are varied in order to analy-
sis the electrical line loss of the system. DIgSILENT
power factory is employed to simulate and analyze the
electrical line loss when distributed generation (DG) is
connected to 22kV distribution system.
2. Electrical Line Losses Analysis [12]
2.1. The Analysis of Base Case
Electrical line losses for the base or for the case where
there is no DG connected to the distribution system as
shown in Figure 1 can be calcula ted by using equatio n 1.
2
13
Loss L
PIrL
 (1)
Copyright © 2013 SciRes. EPE
S. THONGSUK, A. NGAOPITAKKUL
1038
where
PLoss1 is electrical line losses with no DG
r is line resistance (ohm per kilometer)
L is the distance between substation and load (kilome-
ter)
IL is the line current (A)
2.2. The Analysis of Losses with DG
When the DG is included in the distribution system as
shown in Figure 2, the electrical line losses are the com-
bination of the electrical line losses occurring between
substation to the DG (PLSG) and can be calculated by us-
ing equation 2, and the electrical line losses occurring
between DG to the load location (PLT) which can be cal-
culated by using equation 3.
2222
222
3
L
SGLLGGL GLG
L
rG
PPQPQPPQ
V
Q
(2)


22 22
222
3
LTLLGGL GLG
L
rL G
PPQPQPPQQ
V
 





L
(3)
Thus, the total electrical line losses (PLGL) will be cal-
culated by equ a t i on 4.

22
2
3
LL
LGL L
rPQ
P
V

L
G
(4)
where
PG is DG real power (W)
PL is load real power (W)
Figure 1. A simple radial s ystem with no DG .
Figure 2. A simple radial system with DG connected between Sub-
station and Load .
QG is DG reactive power (Var)
QL is load reactive power (Var)
VL is load voltage
G is distance between substation and DG
3. Power System Simulation using
DIgSILENT
The scheme under investigation is a part of Thailand’s
electricity distribution system. DIgSILENT power fac-
tory is employed to simulate and analyze the affect of
electrical line losses when distributed generation (DG) is
connected to 22 kV distribution systems as shown in
Figure 3. Data of geographic information systems (GIS)
including the distance of distribution line and location of
load that are parameters of PEA are shown in Table 1.
From Figure 3, it can be seen that there are 8 buses
from substation and load of each bus that is connected
between distribution lines. To study the electrical line
losses, simulations were performed with various changes
as follows:
- A number of d istribu ted genera tors ar e no DG, 1 DG ,
and 2 DG that designated on any bus of distribution sys-
tem.
- The capacity of DG is 2 MVA, 4 MVA, 6 MVA, and
8 MVA installed at the bus.
- In case of 1 DG, the DG will be moved at each bus.
- In case of 2 DG, the first DG will be installed at bus
4 and other DG will be moved at other bus.
4. Impact of DG for Electrical line losses
The objective of this pap er is to study the impact of elec-
trical line losses when multi-distributed generation is
connected to distribution system. The power loss of the
case of base case (no DG) is compared with the case of 1
DG and 2 DG. The results can be shown in Figure 4 and
Figure 5, respectively.
Figure 3. A simple radial system with DG connected.
Copyright © 2013 SciRes. EPE
S. THONGSUK, A. NGAOPITAKKUL
Copyright © 2013 SciRes. EPE
1039
Table 1. The length of transmission line and load in each
bus which is connected in distribution syste m .
12345678
0
0. 2
0. 4
0. 6
0. 8
1
1. 2
1. 4
1. 6
1. 8
2
Bus
Los s (MW )
No DG
2 MV A
4 MV A
6 MV A
8 MV A
Distance (km) Bus Load (MW)
Substation and 1 4.4 0.14
1 and 2 16.6 2.47
1 and 3 13 1.11
2 and 4 28.5 1.35
4 and 5 16.87 1.42
4 and 6 18 0.62
5 and 7 10 0.58
6 and 8 18.52 0.69 Figure 4. Electrical line losses obtained from each bus for case of no
DG and with 1 DG.
1 23 45 67 8
0
0.5
1
1.5
2
Bus
Loss (MW)
No DG
2 MV A
4 MV A
6 MV A
8 MV A
1 23 45 67 8
-0.5
0
0.5
1
1.5
2
2.5
3
Bus
Loss (MW)
No DG
2 MV A
4 MV A
6 MV A
8 MV A
(a) Case of 2 DG that DG i s 2 MVA at bus 4. (b) Case of 2 DG that DG is 4 MVA at bus 4.
12345678
-0.5
0
0.5
1
1.5
2
2.5
3
3.5
4
Bus
Loss (MW)
No DG
2 MV A
4 MV A
data4
8 MV A
12345678
0
0.5
1
1.5
2
2.5
3
3.5
4
Bus
Loss (M W)
No DG
2 MV A
4 MV A
6 MV A
8 MV A
(c) Case of 2 DG th a t D G i s 6 MVA at bus 4. (d) Case of 2 DG that DG is 8 MVA at bus 4.
Figure 5. Electrical line losses obtained from each bus for the case of 2 DG that DG is installed at bus 4 and other DG is installed at each bus.
The electrical line losses in case of base case (no DG)
is 0.359 MW so the electrical line losses in this case will
be compared with 1 DG at each bus as shown in Figure
4 and Table 2. The comparison is divided into 4 groups
of case studies. The capacity of DG installed at each bus
is 2, 4, 6 and 8 MVA.
The results show th at, when location o f DG is at bu s 1,
2 and 3, the electrical line losses are lower than the base
case (no DG). However, when the DG is installed at bus
5, bus 6, bus 7 and bus 8, it can be seen that the electrical
line losses increase; this is because the size of load is less
than 1 MW and the distance from substation to load is
more than 50 km as shown in Table 1. This indicates that
utility has to be responsible for line losses. In addition,
S. THONGSUK, A. NGAOPITAKKUL
1040
when capacity of DG installed at each bus is 2 MVA and
4 MVA, the electrical line losses are lower than the base
case (no DG) except for the case that the capacity of DG
is 4 MW and installation location is at bus 7 which load
is 0.58 MW. This indicates that utility has benefit from
employing DG. When increasing the capacity of DG (4,
6 and 8 MVA) at each bus, the electrical line losses are
higher than the base case (no DG) by the size and dis-
tance of load. It is noticed that, wh en the capacity of DG
is increased, and if the DG capacity is not too larg e (less
than 4 MVA), the electrical line losses also decrease. On
the other hand, when the capacity of DG is increased and
considered the load at bus 2, it can be seen that the elec-
trical line losses are reduced for most cases because the
size of load is more than 2 MW and distance from sub-
station to load is about 20 km as shown in Tabl e 1. This
also indicates that capacity of DG, location of DG, loca-
tion of load and size of load play an important role for
electrical line losses.
Table 2. The comparison of electrical line losses and per-
centage change between base case (no DG) and 1 DG.
2 MVA 4 MVA 6 MVA 8 MVA
Loss % Loss Loss % LossLoss %Loss Loss%Loss
Bus
(MW) (MW) (MW) (MW)
1 0.31 -13.09 0.283 -21.170.268 -25.35 0.27-24.79
2 0.27 -24.51 0.206 -42.620.183 -49.03 0.2 -44.29
3 0.31 -11.42 0.304 -15.320.32 -10.86 0.3641.39
4 0.16 -54.59 0.113 -68.520.196 -45.40 0.43320.61
5 0.17 -51.53 0.085 -76.320.565 57.38 1.072198.61
6 0.17 -52.37 0.172 -52.090.366 1.95 0.725101.95
7 0.22 -38.44 0.444 23.680.984 174.09 1.802401.95
8 0.18 -48.19 0.271 -24.510.553 54.04 1.047191.64
In case of base case (no DG), it is compared with 2
DG at each bus as shown in Figure 5 and Tables 3-6. It
can be seen that, the capacity of DG is 2 and 4 MVA th at
is installed at bus 4 and other DG is 2, 4, 6 and 8 MVA
that is installed at each bus, are varied. The results show
that, when other DG is located at bus 1, 2 and 3, the elec-
trical line losses are lower than for both the base case (no
DG) and the case of 1 DG at the same bus as shown in
Table 3 and Table 4. However, the capacity of DG is 6
and 8 MVA that is installed at bus 4 and other DG is 2, 4,
6 and 8 MVA that is installed at each bus, are also varied.
The results show that, when other DG is located at bus 1,
2 and 3, the electrical line losses tend to increase at the
same bus as shown in Table 5 and Table 6. When the
other DG is installed at bus 5, bus 6, bus 7 and bus 8, it
can be seen that the electrical line losses increase because
of the capacity of DG.
Table 3. The comparison of electrical line losses and per-
centage change between base case (no DG) and 2 DG that 2
MVA DG is installed at bus 4.
2 MVA 4 MVA 6 MVA 8 MVA
Loss%Loss Loss%Loss Loss %Loss Loss%Loss
Bus
(MW) (MW) (MW) (MW)
1 0.133-62.950.12-66.57 0.123 -65.74 0.143-60.17
2 0.109-69.640.088-75.49 0.107 -70.19 0.163-54.60
3 0.137-61.840.209-41.78 0.334 -6.96 0.235-34.54
4 0.112-68.800.32-10.86 0.751 109.19 1.361279.11
5 0.118-67.130.251-30.08 0.567 57.94 1.036188.58
6 0.166-53.760.5142.06 1.14 217.55 1.978450.97
7 0.133-62.950.329-8.36 0.741 106.41 1.325269.08
8 0.133-62.950.12-66.57 0.123 -65.74 0.143-60.17
Table 4. The comparison of electrical line losses and per-
centage change between base case (no DG) and 2 DG that 4
MVA DG is installed at bus 4.
2 MVA 4 MVA 6 MVA 8 MVA
Loss% LossLoss% Loss Loss % Loss Loss%Loss
Bus
(MW) (MW) (MW) (MW)
1 0.09-62.950.094-73.82 0.113 -68.52 0.149-58.50
2 0.092-74.370.111-69.08 0.168 -53.20 0.261-27.30
3 0.094-73.820.114-68.25 0.163 -54.60 0.24-33.15
4 0.203-43.450.54652.09 1.09 203.62 1.801401.67
5 0.201-44.010.48334.54 0.923 157.10 1.512321.17
6 0.244-32.030.72100.56 1.446 302.79 2.321546.52
7 0.215-40.110.55454.32 1.081 201.11 1.768392.48
8 0.09-62.950.094-73.82 0.113 -68.52 0.149-58.50
Table 5. The comparison of electrical line losses and per-
centage change between base case (no DG) and 2 DG that 6
MVA DG is installed at bus 4.
2 MVA 4 MVA 6 MVA 8 MVA
Loss% LossLoss% Loss Loss % Loss Loss%Loss
Bus
(MW) (MW) (MW) (MW)
1 0.13325.630.22-38.72 0.254 -29.25 0.304-15.32
2 0.207-42.340.261-27.30 0.353 -1.67 0.4833.70
3 0.204-43.180.24-33.15 0.304 -15.32 0.39610.31
4 0.43922.280.903151.53 1.554 332.87 2.497595.54
5 0.43822.010.846135.65 1.521 323.68 2.232521.73
6 0.47632.591.062195.82 1.879 423.40 2.936717.83
7 0.4525.351.234243.73 2.272 532.87 2.468587.47
8 0.13325.630.22-38.72 0.254 -29.25 0.304-15.32
Copyright © 2013 SciRes. EPE
S. THONGSUK, A. NGAOPITAKKUL 1041
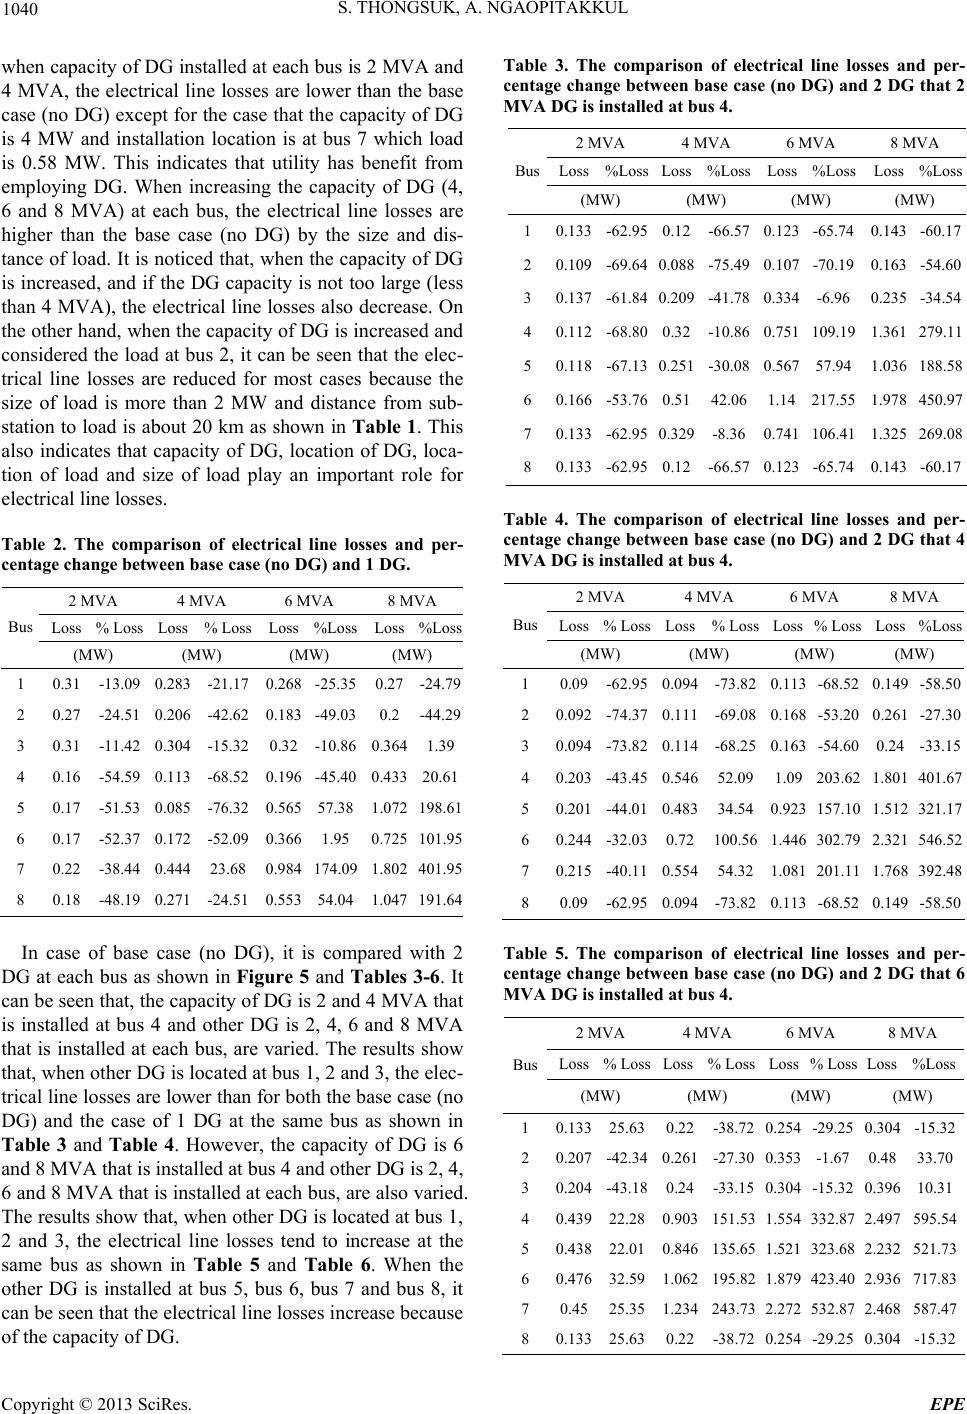
Table 6. The comparison of electrical line losses and per-
centage change between base case (no DG) and 2 DG that 8
MVA DG is installed at bus 4.
2 MVA 4 MVA 6 MVA 8 MVA
Loss % Loss Loss % LossLoss % Loss Loss%Loss
Bus (MW) (MW) (MW) (MW)
1 0.451 25.63 0.483 34.540.531 47.91 0.59465.46
2 0.437 21.73 0.525 46.240.648 80.50 0.807124.79
3 0.454 26.46 0.504 40.390.581 61.84 0.68791.36
4 0.806 124.51 1.503 318.662.277 534.26 3.283814.48
5 0.804 123.96 1.451 304.182.218 517.83 3.141774.93
6 0.84 133.98 1.528 325.632.567 615.04 3.652917.27
7 0.815 127.02 1.51 320.612.269 532.03 3.257807.24
8 0.451 25.63 0.483 34.540.531 47.91 0.59465.46
On the other hand, when the capacity of DG at bus 4 is
varied and th e capacity of other DG does not change, it is
noticed that the electrical line losses at each bus are
slightly increased more than the base case (no DG). This
also indicates the slight mismatch between DG capacity
and size of load.
Considering the load at bus 7 and bus 8 that is less
than 1 MW and load is installed at the end of the distri-
bution system, it can be seen that the electrical line losses
tend to increase, when the capacity of DG is increased.
However, if the DG capacity is not too large (less than 4
MVA), the electrical line losses also decrease. This also
indicates the slight mismatch between DG capacity and
size of load. From the Figure 5(d) and Table 6, it is
clearly seen that as the DG capacity increases, the elec-
trical line losses also increases.
5. Conclusions
This paper presented the impact of electrical line losses
when multi-distributed generation is connected to distri-
bution system. In order to evaluate the impact of multi-
DG for electrical line losses, the line losses of the case of
no DG and with DG are compared. The results show that
when DG is installed close to the substation, the electri-
cal line losses are reduced. However, if DG capacity be-
comes larger and the distance between DG and load is
longer, the electrical line losses tend to increase. The
results indicate that the capacity of DG, location of DG,
location of load and size of load play an important role
for electrical line losses as shown in Figures 4 and 5.
6. Acknowledgements
The authors wish to gratefully acknowledge financial
support for this research from the King Mongkut’s Insti-
tute of Technology Ladkrabang Research fund. And en-
ergy policy and planning office (EPPO), Ministry of En-
ergy, Thailand. They would like also to thank for the
DIgSILENT presented in this paper which is supported
by Provincial Electricity Authority (PEA).
REFERENCES
[1] M. A. Kashem, G. Ledwich, M. Negnevitsky and D. T.
Le, “Distributed Generation for Minimization of Power
Losses in Distribution Systems,” IEEE Power Engineer-
ing Society General Meeting, 2006, pp. 1-8.
[2] O. Aliman, I. Musirin and M. H. Sulaiman, “DG Sizing
Impact for Loss Minimization Considering Cost Factor,”
2012 IEEE International Power Engineering and Opti-
mization Conference (PEDCO), Malaysia, 6-7 June 2012,
pp. 389-394.
[3] D. Q. Hung and N. Mithulananthan, “An Optimal Oper-
ating Strategy of DG Unit for Power Loss Reduction in
Distribution Systems,” 7th IEEE International Confer-
ence on Industrial and Information Systems (ICIIS), 2012,
pp. 1-6.
[4] Y. M. Atwa, E. F. El-Saadany, M. M. A. Salama and R.
Seethapathy, “Distribution System Loss Minimization
Using optimal DG mix,” IEEE Power & Energy Society
General Meeting (PES '09), 2009, pp. 1-6.
[5] M. F. Shaaban and E. F. El-Saadany, “Optimal Allocation
of Renewable DG for Reliability Improvement and
Losses Reduction,” IEEE Power and Energy Society Gen-
eral Meeting, 2012, pp. 1-8.
[6] R. K. Hosseini and R. Kazemzadeh, “Optimal DG Allo-
cation by Extending an Analytical Method to Minimize
Losses in Radial Distribution Systems,” 19th Iranian
Conference Electrical Engineering (ICEE), 2011, pp. 1 -
6.
[7] T. Gözel and M. H. Hocaoglu, "An Analytical Method for
the Sizing and Siting of Distributed Generators in Radial
Systems," Elect. Power Syst. Res, Vol. 79, No. 6, 2009,
pp. 912-918. doi:10.1016/j.epsr.2008.12.007
[8] N. Mithulananthan, T. Oo and V. P. Le, "Distributed Gen-
erator Placement in Power Distribution System using
Genetic Algorithm to Reduce Losses," TIJSAT, Vol. 9,
No. 3, 2004, pp. 55 – 62.
[9] F. Sheidaei, M. Shadkam and M. Zarei, “Optimal distrib-
uted generation allocation in distribution systems em-
ploying ant colony to reduce losses,” 43rd International
Universities Power Engineering Conference (UPEC
2008), 2008, pp. 1 - 5.
doi:10.1109/UPEC.2008.4651548
[10] N. K. Aryani, M. Abdillah, I. M. Y. Negara and A. Soe-
prijanto, “Optimal Placement and Sizing of Distributed
Generation using Quantum Genetic Algorithm for Re-
ducing Losses and Improving Voltage Profile,” IEEE Re-
gion 10 Conference (TENCON 2011), 2011, pp. 108 -
112.
[11] M. T. Ameli, V. Shokri and S. Shokri, “Using Fuzzy
Logic & Full Search for Distributed Generation Alloca-
tion to Reduce Losses and Improve Voltage Profile,”
2010 International Conference Computer Information
Copyright © 2013 SciRes. EPE
S. THONGSUK, A. NGAOPITAKKUL
Copyright © 2013 SciRes. EPE
1042
Systems and Industrial Management Applications (CI-
SIM), 2010, pp. 626 - 630.
doi:10.1109/CISIM.2010.5643526
[12] P. Chiradeja and C. Pothisarn, “Electrical Line Losses in
Distribution System with the Inclusion of Very Small
Power Producer,” In Proceedings of the fifth IASTED
Asian Conference on Power and Energy Systems (Asia-
PES2012), Thailand, April 2012.