 Open Journal of Applied Sciences, 2013, 3, 413-420 Published Online November 2013 (http://www.scirp.org/journal/ojapps) http://dx.doi.org/10.4236/ojapps.2013.37051 Open Access OJAppS Studying the Utilization of Plastic Waste by Chemical Recycling Method Adil Koç Chemical Engineering Department, Engineering Faculty, Inonu University, Malatya, Turkey Email: adil.koc@inonu.edu.tr Received November 19, 2012; revised January 8, 2013; accepted January 18, 2013 Copyright © 2013 Adil Koç. This is an open access article distributed under the Creative Commons Attribution License, which per- mits unrestricted use, distribution, and reproduction in any medium, provided the original work is properly cited. ABSTRACT The rapid increase in the use of plastic materials in the recent years led to the accumulation of excessive amounts of plastic waste. The so-called thermoplastics such as PE, PP, PS, PVC and PET as well as materials that are derived from these are the type of plastic that is most used and consequently creates most of the waste. In this study, the original and waste forms of PE and PP plastic types have been chosen for thermal and catalytic degradation. As process parameter, 410˚C - 450˚C temperature interval and 600 mL/min constant flow rate nitrogen gas have been chosen as the carrier gas and the reaction time was considered to be 90 minutes for all experiments. Liquid products collected in experiments were separated by means of fractioned distillation process. For purposes of determining product distribution, the frac- tions, which were separated by distillation, were diluted in an appropriate solution for analysis of GC/MS. In the study conducted, it has been observed that the liquid product distribution obtained mainly consists of a mixture of saturated and unsaturated (heptane, heptane, octane, nonane, dodecane, etc.) hydrocarbons. Keywords: Waste Plastics; Chemical Recycling; Catalyst 1. Introduction Nowadays plastic materials have become an indispensa- ble part of social life and the fact that they generate ex- cessive amounts of waste causes large economic losses. For purposes of recovering these plastic materials various pyrolysis techniques (thermal, catalytic, inert atmosphere, oxygen environment, under high pressure pyrolysis, etc.) have been developed. Due to its unique structure and properties (cheap, high resistance against impact, easy processing, etc.), polyethylene is used more commonly in comparison to other plastic types such as PP, PS, PET, PVC and consequently more waste is formed [1-5]. In a plastic degradation study, it has been reported that the reaction products consist of a hydrocarbon mixture such as water insoluble saturated and unsaturated petrochemi- cal raw material and that the distribution of molecular weights of these products is determined. By applying thermo-gravimetric method and thermal degradation tech- nique, oxygenated and non-oxygenated polymers were degraded in a reactor consisting of different sections [6, 7]. In these studies some kinetic parameters were deter- mined and it has been claimed that the liquid products obtained especially by degeneration of oxygenated poly- mers were alcohol, alkene, ether (ethoxymethane, ethoxy ethane, methoxy methane, etc.), aldehydes, CO and CO2. In some studies it has been shown that when waste plas- tic mixture pyrolysis is implemented in hydrogen at- mosphere and gas oil by using synthetic zeolite (Co-Ac, DHC) catalysts, a high rate of liquid product was ob- tained [6,8]. Due to the fact that products similar to fuel and petrochemical raw material quality can be generated through thermal and catalytic pyrolysis of plastic waste, these are considered to be important recovery methods. In the study of HDPE plastics pyrolysis, one group of researchers has been reported to have obtained liquid product in C5-C28 carbon range consisting of high rate of paraffin and aromatic component mixture [9-13]. PE plastics were pyrolyzed in different reactors for purposes of analyzing pyrolytic medium and it has been reported that residence time and reaction temperature are parame- ters that are effective on degradation mechanism [14,15]. Some original and waste plastic types such as PE, PP, PS were pyrolyzed and it has been reported that alkene/ par- affin ratio was an important parameter in pyrolysis of plastic mixture [16,17]. Additionally, in the same study, it has been claimed that the reaction rate constant in- 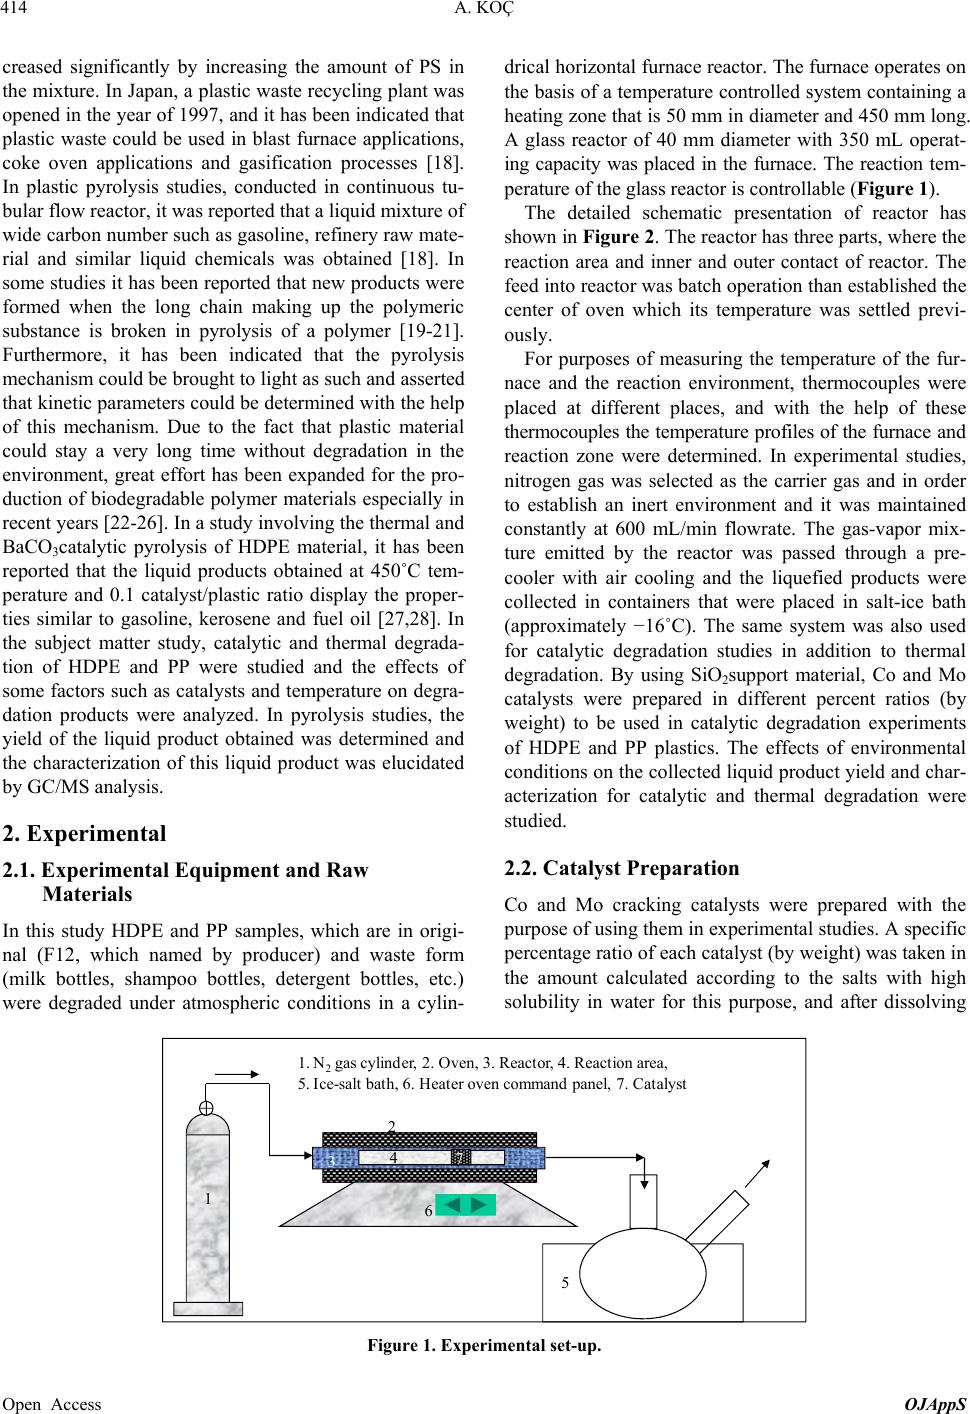 A. KOÇ 414 creased significantly by increasing the amount of PS in the mixture. In Japan, a plastic waste recycling plant was opened in the year of 1997, and it has been indicated that plastic waste could be used in blast furnace applications, coke oven applications and gasification processes [18]. In plastic pyrolysis studies, conducted in continuous tu- bular flow reactor, it was reported that a liquid mixture of wide carbon number such as gasoline, refinery raw mate- rial and similar liquid chemicals was obtained [18]. In some studies it has been reported that new products were formed when the long chain making up the polymeric substance is broken in pyrolysis of a polymer [19-21]. Furthermore, it has been indicated that the pyrolysis mechanism could be brought to light as such and asserted that kinetic parameters could be determined with the help of this mechanism. Due to the fact that plastic material could stay a very long time without degradation in the environment, great effort has been expanded for the pro- duction of biodegradable polymer materials especially in recent years [22-26]. In a study involving the thermal and BaCO3catalytic pyrolysis of HDPE material, it has been reported that the liquid products obtained at 450˚C tem- perature and 0.1 catalyst/plastic ratio display the proper- ties similar to gasoline, kerosene and fuel oil [27,28]. In the subject matter study, catalytic and thermal degrada- tion of HDPE and PP were studied and the effects of some factors such as catalysts and temperature on degra- dation products were analyzed. In pyrolysis studies, the yield of the liquid product obtained was determined and the characterization of this liquid product was elucidated by GC/MS analysis. 2. Experimental 2.1. Experimental Equipment and Raw Materials In this study HDPE and PP samples, which are in origi- nal (F12, which named by producer) and waste form (milk bottles, shampoo bottles, detergent bottles, etc.) were degraded under atmospheric conditions in a cylin- drical horizontal furnace reactor. The furnace operates on the basis of a temperature controlled system containing a heating zone that is 50 mm in diameter and 450 mm long. A glass reactor of 40 mm diameter with 350 mL operat- ing capacity was placed in the furnace. The reaction tem- perature of the glass reactor is controllable (Figure 1). The detailed schematic presentation of reactor has shown in Figure 2. The reactor has three parts, where the reaction area and inner and outer contact of reactor. The feed into reactor was batch operation than established the center of oven which its temperature was settled previ- ously. For purposes of measuring the temperature of the fur- nace and the reaction environment, thermocouples were placed at different places, and with the help of these thermocouples the temperature profiles of the furnace and reaction zone were determined. In experimental studies, nitrogen gas was selected as the carrier gas and in order to establish an inert environment and it was maintained constantly at 600 mL/min flowrate. The gas-vapor mix- ture emitted by the reactor was passed through a pre- cooler with air cooling and the liquefied products were collected in containers that were placed in salt-ice bath (approximately −16˚C). The same system was also used for catalytic degradation studies in addition to thermal degradation. By using SiO2support material, Co and Mo catalysts were prepared in different percent ratios (by weight) to be used in catalytic degradation experiments of HDPE and PP plastics. The effects of environmental conditions on the collected liquid product yield and char- acterization for catalytic and thermal degradation were studied. 2.2. Catalyst Preparation Co and Mo cracking catalysts were prepared with the purpose of using them in experimental studies. A specific percentage ratio of each catalyst (by weight) was taken in the amount calculated according to the salts with high solubility in water for this purpose, and after dissolving 16 5 4 3 2 1. N 2 gas cylinder, 2. Oven, 3. Reactor, 4. Reaction area, 5. Ice-salt bath, 6. Heater oven command panel, 7. Catalyst 7 Figure 1. Experimental set-up. Open Access OJAppS  A. KOÇ 415 Wasteplasticmelt N 2 gasGas productout Catalystball Figure 2. Detailed reactor scheme. in water it was adsorbed onto the support material. To prepare Cobalt (Co) catalyst cobalt-II-nitrate hexa-hy- drate salt [Co(NO3)26H2O], and to prepare molybdenum (Mo) catalyst ammonium molybdate tetra hydrate [(NH4)6Mo7O24·4H2O] sale was selected. To prepare cata- lysts of different percentage ratios (1%, 5% 10%, by weight) the salts indicated were placed in a beaker in the ratios calculated. Later on the salt was dissolved in dis- tilled water and finally added to SiO2 salt solution that was used as support material and dried in oven at 110˚C. After a waiting period of approximately 24 - 36 hours, the catalyst was placed in 110˚C oven for purposes of removing its water and its water was evaporated. Finally the catalyst was subjected to calcination process to achieve its form for use. 2.3. Calcination of Catalyst After the removal of its water and being dried, raw cata- lyst was let stand in a muffle furnace at different tem- peratures and for different time periods. To serve this purpose the standing periods indicated in the following table was applied (Table 1). At the end of the standing period the catalyst, which was removed from the hot oven, was cooled in a desiccator and stored in glass jars for experimental studies. The SEM-EDX compound content of Co-Mo catalyst was presented in Table 2. We can see in this table that this catalyst is formed of Co, Mo and SiO2, which is a support material. And the detailed estimation of form of this catalyst is shown in Figure 3 too. 3. Result and Discussion The effects of different environmental conditions on the liquid product were analyzed in experimental studies, and their iodine numbers were attempted to be deter- mined with the purpose of determining how unsaturated liquid products were. The liquid products collected in the coolers located at the outlet of the reactor were subjected to distillation process under atmospheric conditions in order to be able to determine the boiling point distribu- tion. Later, the same liquid fractions were prepared for GC/MS analysis by being dissolved in a suitable solvent and the characterization of liquid products were deter- mined by GC/MS analysis. In thermal and catalytic deg- radation experiments of PP and HDPE plastics, nitrogen Table 1. Catalyst calcinations and temperature periods. Catalysts Co or Mo Temperatures, ˚C 350 450 550 600 Waited time, min. 60 90 120 60 Table 2. The SEM-EDX compound content of Co-Mo cata- lyst. Date:30/03/2012 11:05:48 HV: 20.0 kV Puls th.: 6.16 kcps ElANSeries unn. C [wt%] norm. C [wt%] Atom. C [at%] Error [%] Si14K-series10.50 15.03 37.46 0.5 Co27K-series0.86 1.23 1.47 0.1 Mo42L-series58.49 83.73 61.07 2.1 Total: 69.85 100.00 100.00 gas was selected as the carrier gas and it was maintained constant at 600 mL/min while the experiment tempera- ture interval was set to 410˚C - 450˚C. At 425˚C temperature, the effects of catalyst/plastic ratio on PP-HDPE degradation products were examined and the change shown in Figure 4 was obtained. Ac- cording to Figure 4, the liquid product yield displays an increase with the increase in catalyst/plastic ratio (in- creases approximately from 60% to 82% (by weight)). In contract to this there were no significant changes in the number of iodine and residue amounts (what is left over in the reactor after degradation) and while the iodine number remained approximately around 53 g/100g of liquid, the residue amount was 4%. The fact that the io- dine number did not change significantly means that the ratio of unsaturated liquid products under these environ- mental conditions did not change much. (The iodine number provides information as to the ratio of unsatu- rated components available in the environment and this has been determined analytically as per ASTM D4607-94 standard). From the same figure, we can see that the highest liquid yield was obtained when the catalyst/plas- tic ratio is 0.2. This means that in this plastic degradation study, if for each 5 grams of plastic 1 gram of catalyst is used, the highest liquid yield would be obtained. And this value has been determined to be 82% (by weight). This demonstrated that using a catalyst would yield more of the liquid product in comparison to the conditions where a catalyst is not used. Changes in the liquid product yield and iodine number against catalyst/plastic ratio are provided in Figure 5 for catalytic degradation of HDPE at 450˚C temperature. According to Figure 5, the highest liquid product and lowest residue amounts were obtained at 0.1 catalyst/ plastic ratio. Furthermore, we can see from Figure 5 that maximum residue and liquid amounts are approximately 12% and 77% (by weight) respectively at 450˚C tem- Open Access OJAppS  A. KOÇ 416 1 2 3 4 5 6 7 8 keV 0 5 10 15 20 25 30 cps/eV Co Co Mo Mo Si O Figure 3. The SEM-EDX presentation of Co-Mo catalyst. Open Access OJAppS  A. KOÇ 417 Figure 4. The variation of liquid products, residue and io- dine numbers of PP-HDPE mixture degradation with cata- lyst/plastic ratio at 425˚C temperature. Figure 5. The variation of degradation products of LDPE and iodine numbers with catalyst/plastic ratio at 450˚C tem- perature. perature and 0.1 catalyst/plastic ratio. However, we can say that the highest iodine number was determined for 0.03 catalyst/plastic ratio at the same temperature, and under these conditions, more unsaturated liquid product was obtained in comparison to other catalyst/plastic ra- tios. Accordingly, if it is desired to obtain higher amounts of unsaturated liquid product, the use of a catalyst/plastic ratio of 0.03 would be required. The change in the reaction products and iodine number with temperature in degradation of HDPE at 1/10 cata- lyst/plastic ratio are provided in Figure 6. According to Figure 6, the liquid product yield increased with the temperature in the degradation of HDPE and the highest liquid yield of approximately 78% was obtained at 440˚C temperature. However, it was also observed that the amount of residue decreases with the increases in tem- perature and the highest residue amount is obtained at the lowest study temperature of 410˚C. This means that the HDPE degradation study is not deliberate at low tem- 5 20 35 50 65 80 95 400 410 420430 440 450 Temperature, o C Evolutio Liquid, %w Residue, %w Iodine number Figure 6. The variation of amount of liquid products, resi- due and iodine numbers of degradation of LDPE with tem- perature at 1/10 catalyst/plastic ratio. peratures even if a catalyst is used. It can be observed that the iodine number does not change much with the temperature and remains at approximately 56 g/100g of liquid at all temperatures. For this reason the saturation of liquid products did not show much change as the catalyst/plastic ratio remained constant. However, it must be noted that the saturation of liquid products as shown in Figure 5 above was determined to change on the basis of the catalyst/plastic ratio. It has been determined that the boiling point distribu- tion of the distilled product of liquid products obtained in the catalytic degradation of HDPE at 450˚C temperature, changes with the changes in the catalyst/plastic ratio as shown in Table 3. It can be said that, the boiling tem- perature range at maximum catalyst/plastic ratio of 3/30 is 130˚C - 250˚C, while the boiling temperature range is revealed to be 80˚C - 250˚C for the liquid products at catalyst/plastic ratio of 1/30. Therefore, the boiling tem- perature of liquid products obtained at higher cata- lyst/plastic ratios is higher. Moreover, the liquid products in possession of lower boiling temperatures at lower cata- lyst/plastic ratios seem to be obtained in a wider range of boiling point temperature. The temperature distribution during fractioned distilla- tion of liquid products obtained in the study of PP Deg- radation at different temperatures (425˚C and 450˚C) is shown in Figure 7. According to Figure 7, while the approximate boiling point of the product when the con- densation starts during the distillation of the liquid prod- uct obtained at 425˚C is 65˚C, this temperature for the liquid product obtained at the temperature of 450˚C is 77˚C. At the beginning of distillation, the distillate tem- perature obtained showed a rapid increase and in ap- proximately 10 minutes reached 175˚C levels. After this temperature level, a significant change did not occur dur- ing distillation in the distillation temperature of the liquid product obtained at 425˚C. However in the distillation of the liquid product, which was obtained at 450˚C, an in- crease has been observed after the 25th minute and the Open Access OJAppS  A. KOÇ 418 distillate temperature increased to 215˚C by the end of the distillation process. Distillation process was applied to determine the dis- tribution of the liquid product obtained by catalytic deg- radation of PP at 425˚C temperature. After distillation samples were obtained from these fractions and they were dissolved in a suitable solvent (such as CCI4) and subjected to GC/MS analysis. The chromatogram dis- played a change as shown in Figure 7 and the results are summarized in Table 4. When the Table 4 and chroma- togram (Figure 8) are evaluated together, it can be seen that the liquid product obtained includes a high rate of Table 3. The effect of catalyst/plastic ratio on distillation range of HDPE degradation at 450˚C temperature. Catalyst/Plastic ratio Distillation part, %w BP range, ˚C 3/30 39 130-255 1/30 33 80-250 Figure 7. The variation of distillation temperature of liquid products of PP degradation at different temperatures. saturated (paraffin) structure components and that addi- tionally there are unsaturated (olefin) hydrocarbon mixtures with aromatic structure. It is possible to comment on the carbon atom number of the degradation product of PP plastics degraded at 425˚C by evaluating Table 5 and Figure 9 together. Ac- cording to Figure 9, the carbon atom number distribution is between C5-C18 range, while C8-C12 carbon num- bered products are higher in concentration. From Table 5 Table 4. The product distribution of catalytic degradation of HDPE at 425˚C temperature conditions. Peak numberRetention timeCompound name 1 4.35 1-Heptene 2 4.51 2,4-Dimethyl, Heptane 3 5.22 1-Octene 4 4.21 Nonane 5 5.25 Cyclopropane, 1-methl, 2-penthyl 6 5.11 n-Decane 7 4.25 n-Undecane 8 4.69 Cyclopropane, 1-penthyl-2-prophyl-5-undecene 9 4.89 o-Xylene 10 5.92 n-Dodecane 11 5.12 1-Dodecene 12 5.33 1-Cyclododecane 13 5.92 Benzene, 1-3-5 Trymethyl 14 6.32 Tetradecane 15 5.24 Tetradecene 16 4.57 Pentadecane 17 5.85 Hexadecane 18 6.32 Heptadecane 19 6.56 Octadecene Figure 8. The GC/MS chromatogram of catalytic degradation products of PP at 425˚C temperature. Open Access OJAppS  A. KOÇ 419 Table 5. The product group distribution of catalytic degra- dation of HDPE at 425˚C temperature by GC/MS analysis. Compound group Peak area (in percentage) Olefins 26.15 Paraffins 46.26 Aromatics 10.81 Cyclic 15.86 Unknown 0.92 Total 100.00 2 2.5 3 3.5 4 4.5 5 5.5 6 6.5 7 468 101214161820 Pick area, (in percentage) Carbon atom number Figure 9. The variation of carbon atom numbers of catalytic degradation of PP at 425˚C temperature. it can be seen that there are small amounts of aromatic components (10.81%) in the degradation products ob- tained at 425˚C, while products of paraffin quality are available at highest amounts (46.26 %). 4. Conclusion The catalytic degradation of HDPE and PP shows us that in different catalyst/plastic ratios the amount and struc- ture of liquid products are different. So the iodine num- ber is an interesting parameter for unsaturated compounds determination. In this study, the unsaturated products are important part of the degradation products. In our later studies, the evolution of unsaturated product which they obtained in thermal or catalytic degradation processes will be investigated. 5. Acknowledgements This work had been supported by UNIBAP 2011/45 Re- searche Project code. REFERENCES [1] J. G. Gao, M. S. Yu and Z. T. Lia, “Non-Isothermal Crys- tallization Kinetics and Melting Behavior of Bimodal Medium Density Polyethylene/Low Density Polyethylene Blends,” European Polyme r Journal, Vol. 40, No. 7, 2004, pp. 1533-1539. [2] P. Krzysztof and F. Kinga, “Non-Oxidative Thermal Deg- radation of Poly (Ethylene Oxide): Kinetic and Thermo Analytical Study,” Journal of Analytical and Applied Py- rolysis, Vol. 73, No. 1, 2005, pp. 131-138. http://dx.doi.org/10.1016/j.jaap.2005.01.003 [3] M. Takao, K. Tatsuhiko, M. Toshihiro, S. R. Mukai, H. Kenji and S. I. Yoshida, “Chemical Recycling of Mixture of Waste Plastics Using a New Reactor System with Stir- red Heat Medium Particles in Steam Atmosphere,” Che- mical Engineering Journal, Vol. 82, No. 1-3, 2001, pp. 173-181. [4] A. András, N. Miskolczi and L. Bartha, “Petrochemical Feedstock by Thermal Cracking of Plastic Waste”, Jour- nal of Analytical and Applied Pyrolysis, Vol. 79, No. 1-2, 2007, pp. 409-414. http://dx.doi.org/10.1016/j.jaap.2006.12.031 [5] A. S. Aamer, H. Fariha, H. Abdul and A. Safia, “Biolo- gical Degradation of Plastics: A Comprehensive Review,” Biotechnology Advances, Vol. 26, No. 3, 2008, pp. 246- 265. http://dx.doi.org/10.1016/j.biotechadv.2007.12.005 [6] B. Robert, Jr. James, et al., “Process for the Conversion of Plastic to Produce a Synthetic Crude Oil,” US Patent No. 6060631, 2000. [7] K. Adil and A. Y. Bilgesu, “Catalytic and Thermal Oxi- dative Pyrolysis of LDPE in a Continuous Reactor Sys- tem,” Journal of Analytical and Applied Pyrolysis, Vol. 78, No. 1, 2007, pp. 7-13. http://dx.doi.org/10.1016/j.jaap.2006.03.008 [8] A. Marcilla, A. Gómez-Siurana, A. O. Odjo, R. Navarro and D. Berenguer, “Characterization of Vacuum Gas Oile- low Density Polyethylene Blends by Thermogravimetric analysis,” Polymer Degradation and Stability, Vol. 93, No. 3, 2008, pp. 723-730. http://dx.doi.org/10.1016/j.polymdegradstab.2007.12.010 [9] N. Miskolczi and L. Bartha, “Investigation of Hydrocar- bon Fractions form Waste Plastic Recycling by FTIR, GC, EDXRFS and SEC Techniques,” Journal of Biochemical and Biophysical Methods, Vol. 70, No. 6, 2008, pp. 1247- 1253. http://dx.doi.org/10.1016/j.jbbm.2007.05.005 [10] N. K. Ciliz, E. Ekinci and C. E.Snape, “Pyrolysis of Vir- gin and Waste Polypropylene and Its Mixtures with Waste Polyethylene and Polystyrene,” Waste Management, Vol. 24, No. 2, 2004, pp. 173-181. http://dx.doi.org/10.1016/j.wasman.2003.06.002 [11] A. Okuwaki, “Feedstock Recycling of Plastics in Japan,” Polymer Degradation and Stability, Vol. 85, No. 3, 2004, pp. 981-988. http://dx.doi.org/10.1016/j.polymdegradstab.2004.01.023 [12] N. Miskolczia, L. Barthaa, G. Deáka, B. Jóverb and D. Kallóc, “Thermal and Thermo-Catalytic Degradation of High-Density Polyethylene Waste,” Journal of Analytical and Applied Pyrolysis, Vol. 72, No. 2, 2004, pp. 235-242. http://dx.doi.org/10.1016/j.jaap.2004.07.002 [13] M. Wallis and S. K. Bhatia, “Kinetic Study of the Ther- mal Degradation of High Density Polyethylene,” Polymer Degradation and Stability, Vol. 91, No. 7, 2006, pp. 1476- 1483. http://dx.doi.org/10.1016/j.polymdegradstab.2005.10.003 [14] U. Suat, K. Selhan, K. Tamer and Y. Jale, “Conversion of Polymers to Fuels in a Refinery Stream,” Polymer Deg- Open Access OJAppS  A. KOÇ 420 radation and Stability, Vol. 75, No. 1, 2002, pp. 161-171. http://dx.doi.org/10.1016/S0141-3910(01)00215-4 [15] A. E. S. Greena and S. M. Sadramelib, “Analytical Rep- resentations of Experimental Polyethylene Pyrolysis Yields,” Journal of Analytical and Applied Pyrolysis, Vol. 72, No. 2, 2004, pp. 329-335. http://dx.doi.org/10.1016/j.jaap.2004.07.006 [16] Y.-H. Seo, K.-H. Lee and D.-H. Shin, “Investigation of Catalytic Degradation of Highdensity Polyethylene by Hy- drocarbon Group Type Analysis,” Journal of Analytical and Applied Pyrolysis, Vol. 70, No. 2, 2003, pp. 383-398. [17] J. Walendziewski, “Continuous Flow Cracking of Waste Plastics,” Fuel Processing Technology, Vol. 86, No. 12- 13, 2005, pp. 1265-1278. http://dx.doi.org/10.1016/j.fuproc.2004.12.004 [18] M. L. Mastellone, F. Perugini, M. Ponte and U. Arena, “Fluidized Bed Pyrolysis of a Recycled Polyethylene,” Polymer Degradation and Stability, Vol. 76, No. 3, 2002, pp. 479-487. http://dx.doi.org/10.1016/S0141-3910(02)00052-6 [19] A. Marcilla, J. C. García-Quesada, S. Sánchez, and R. Ruiz, “Study of the Catalytic Pyrolysis Behaviour of Polyethylene—Polypropylene Mixtures,” Journal of Ana- lytical and Applied Pyrolysis, Vol. 74. No. 1-2, 2005, pp. 387-392. http://dx.doi.org/10.1016/j.jaap.2004.10.005 [20] J. Nishino, M. Itoh, H. Fujiyoshi and Y. Uemichi, “Cata- lytic Degradation of Plastic Waste into Petrochemicals Using Ga-ZSM-5,” Fuel, Vol. 87, No. 17-18, 2008, pp. 3681-3686. http://dx.doi.org/10.1016/j.fuel.2008.06.022 [21] D. Na, Z. Yu-Feng and W. Yan, “Thermogravimetric Analysis and Kinetic Study on Pyrolysis of Representa- tive Medical Waste Composition,” Waste Management, Vol. 28, No. 9, 2008, pp. 1572-1580 http://dx.doi.org/10.1016/j.wasman.2007.05.024 [22] U. Hujuri, A. K. Ghoshal and S. Gumma, “Modeling Pyrolysis Kinetics of Plastic Mixtures,” Polymer Degra- dation and Stability, Vol. 93, No. 10, 2008, pp. 1832- -1837. http://dx.doi.org/10.1016/j.polymdegradstab.2008.07.006 [23] B. Singh and N. Sharma, “Mechanistic Implications of Plas- tic Degradation,” Polymer Degradation and Stability, Vol. 93, No. 3, 2008, pp. 561-584. http://dx.doi.org/10.1016/j.polymdegradstab.2007.11.008 [24] A. K. Panda, R. K. Singh and D. K. Mishra, “Thermolysis of Waste Plastics to Liquid Fuel a Suitable Method for Plastic Waste Management and Manufacture of Value Added Products—A world Prospective,” Renewable and Sustainable Energy Reviews, Vol. 14, No. 1, 2010, pp. 233-248. http://dx.doi.org/10.1016/j.rser.2009.07.005 [25] Y.-H. Lin, M.-H. Yang, T.-T. Wei, C.-T. Hsu, K.-J. Wu and S.-L. Lee, “Acid-Catalyzed Conversion of Chlorin- ated Plastic Waste into Valuable Hydrocarbons over Post- Use Commercial FCC Catalysts,” Journal of Analytical and Applied Pyrolysis, Vol. 87, No. 1, 2010, pp. 154-162. http://dx.doi.org/10.1016/j.jaap.2009.11.006 [26] N. Miskolczi, L. Bartha, G. Deáka and B. Jóverb, “Ther- mal Degradation of Municipal Plastic Waste for Produc- tion of Fuel-Like Hydrocarbons,” Polymer Degradation and Stability, Vol. 86, No. 2, 2004, pp. 357-366. http://dx.doi.org/10.1016/j.polymdegradstab.2004.04.025 [27] M. Rasul Jan, J. Shah and H. Gulab, “Catalytic Degrada- tion of Waste HDPE into Fuel Products Using BaCO3 as a Catalyst,” Fuel Processing Technology, Vol. 91, No. 11, 2010, pp. 1428-1437. http://dx.doi.org/10.1016/j.fuproc.2010.05.017 [28] M. N. Almustapha and J. M. Andresen, “Catalytic Con- version of High Density Polyethylene (HDPE) Polymer as a Means of Recovering Valuable Energy Content from the Plastic Wastes,” 2011 International Conferen ce on Pe- troleum and Sustainable Development IPCBEE, Vol. 26, IACSIT Press, Singapore, 2011. Open Access OJAppS
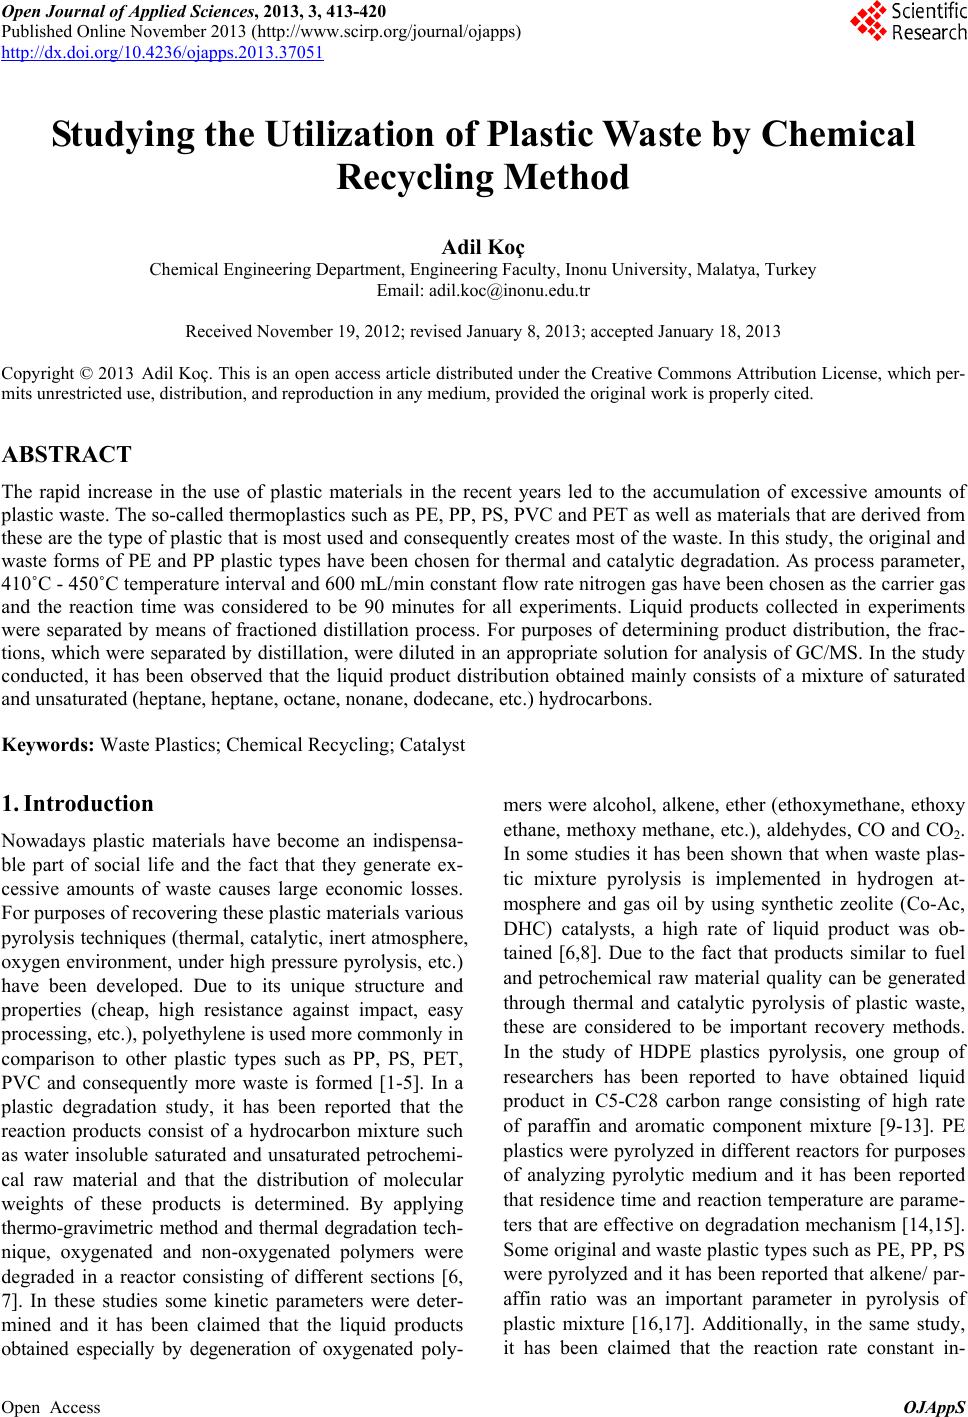
|