Liver Segmentation from CT Image Using Fuzzy Clustering and Level Set 39
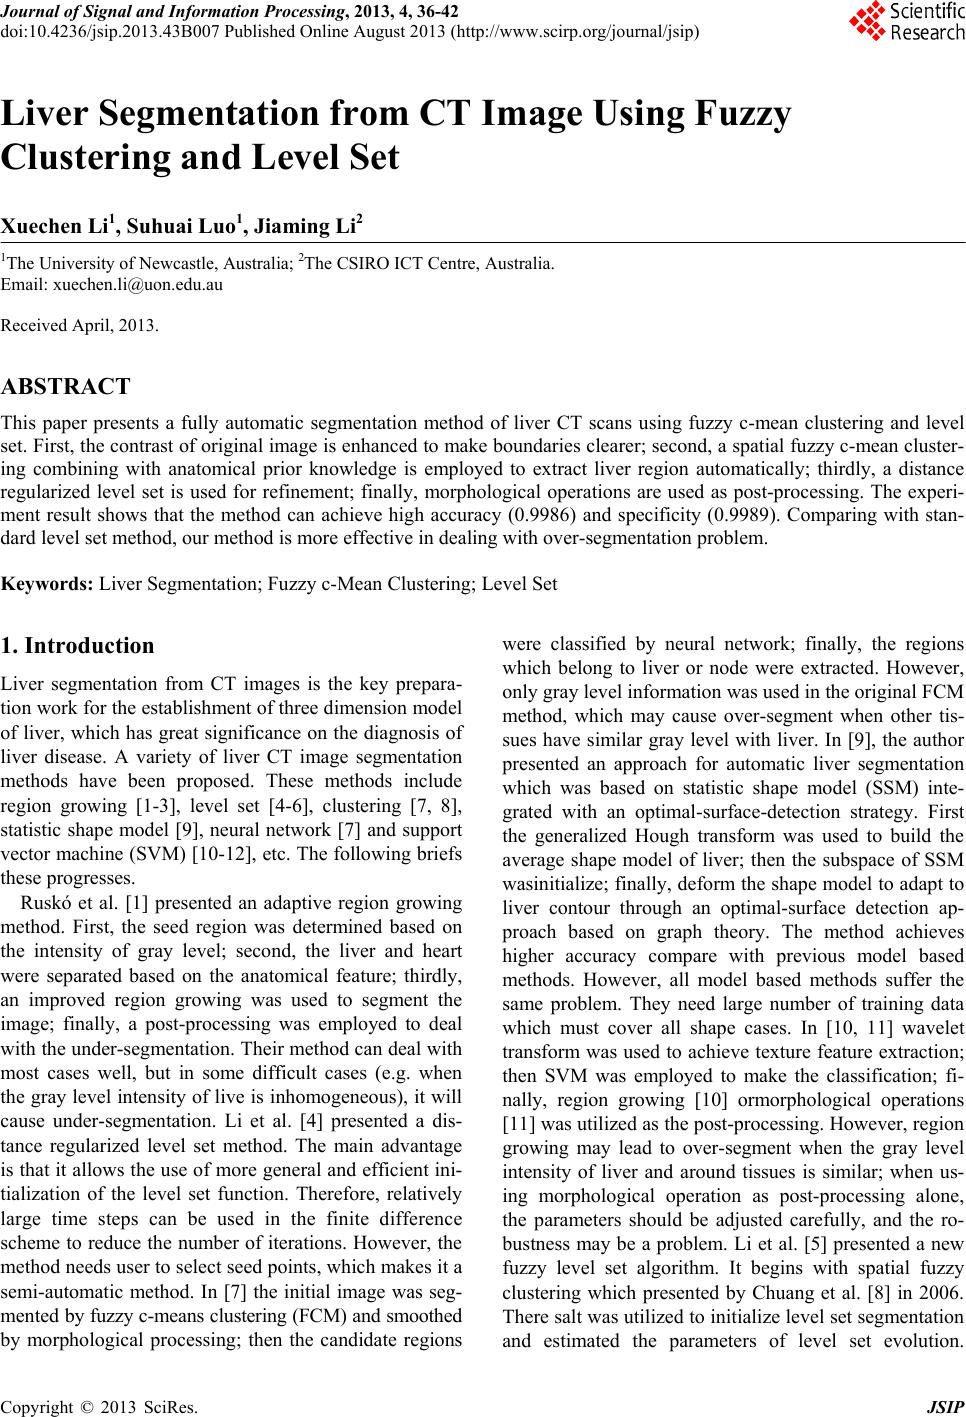
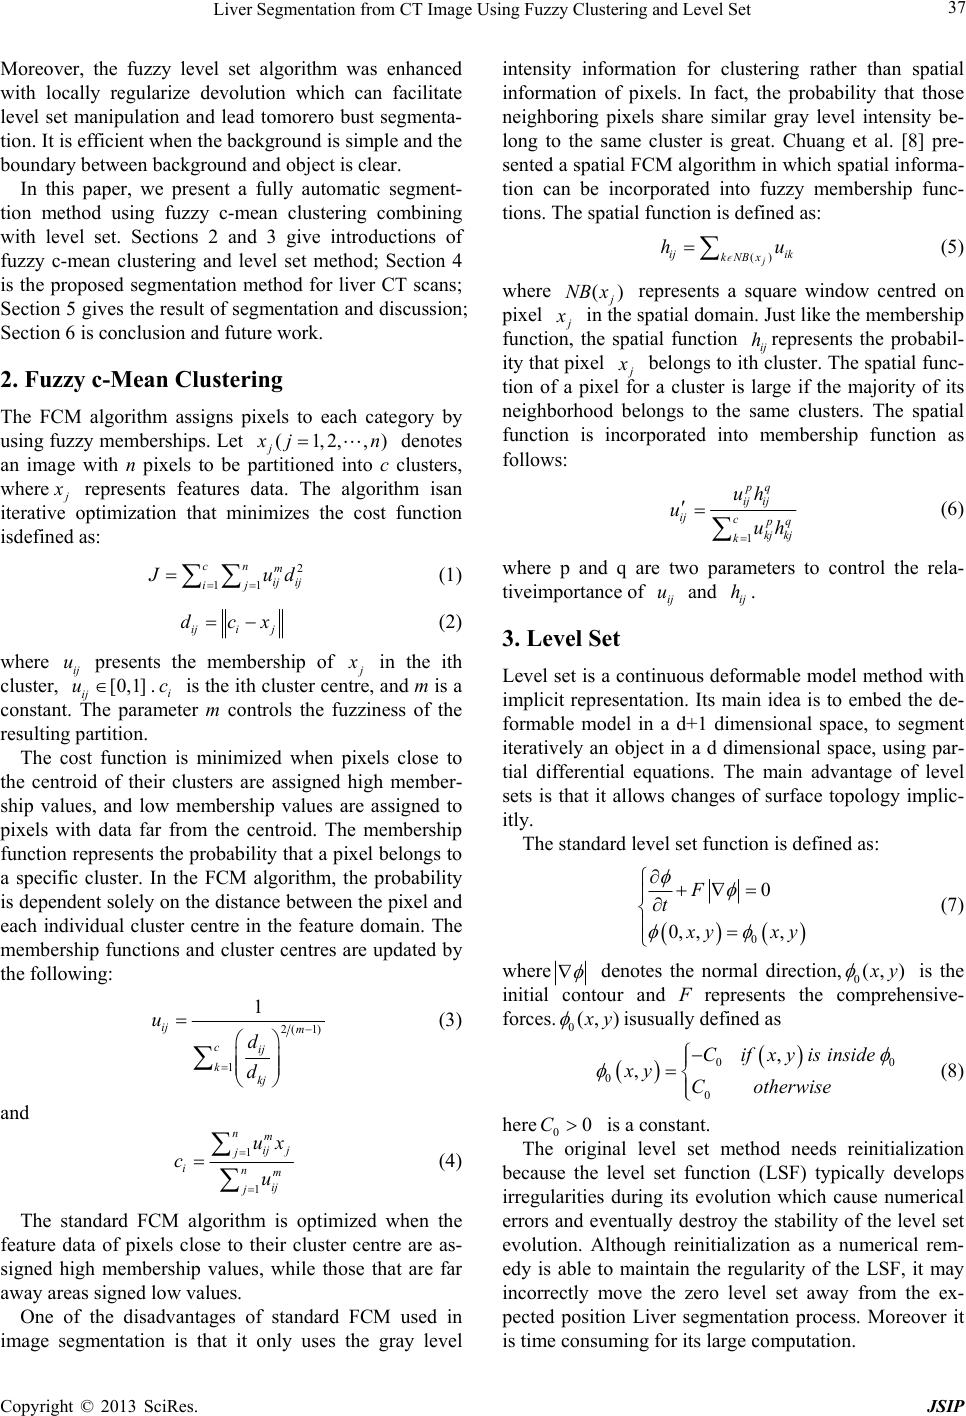
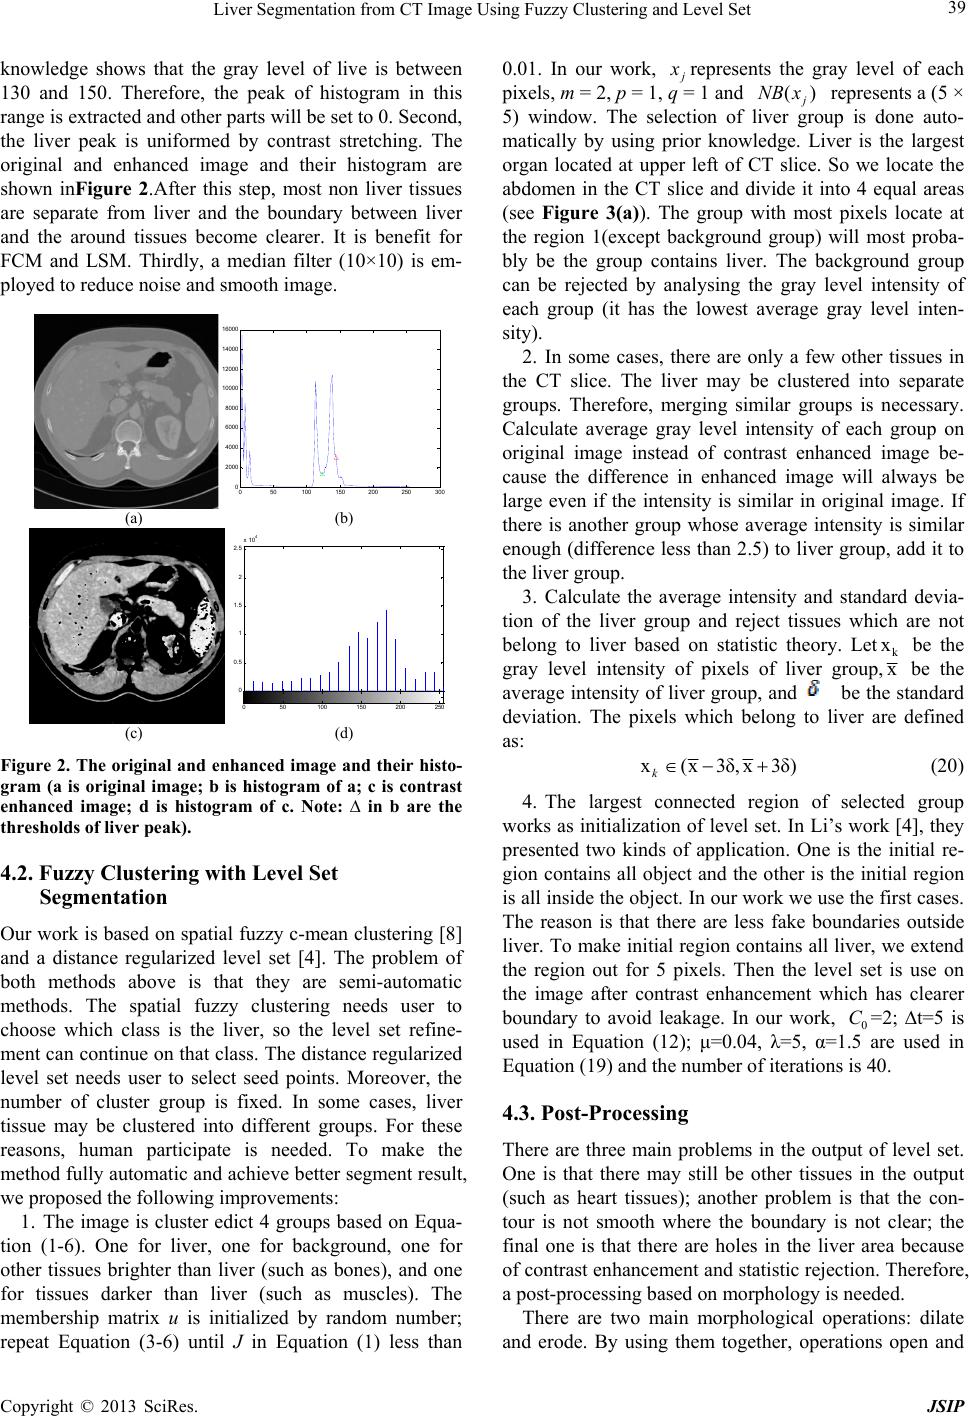
knowledge shows that the gray level of live is between
130 and 150. Therefore, the peak of histogram in this
range is extracted and other parts will be set to 0. Second,
the liver peak is uniformed by contrast stretching. The
original and enhanced image and their histogram are
shown inFigure 2.After this step, most non liver tissues
are separate from liver and the boundary between liver
and the around tissues become clearer. It is benefit for
FCM and LSM. Thirdly, a median filter (10×10) is em-
ployed to reduce noise and smooth image.
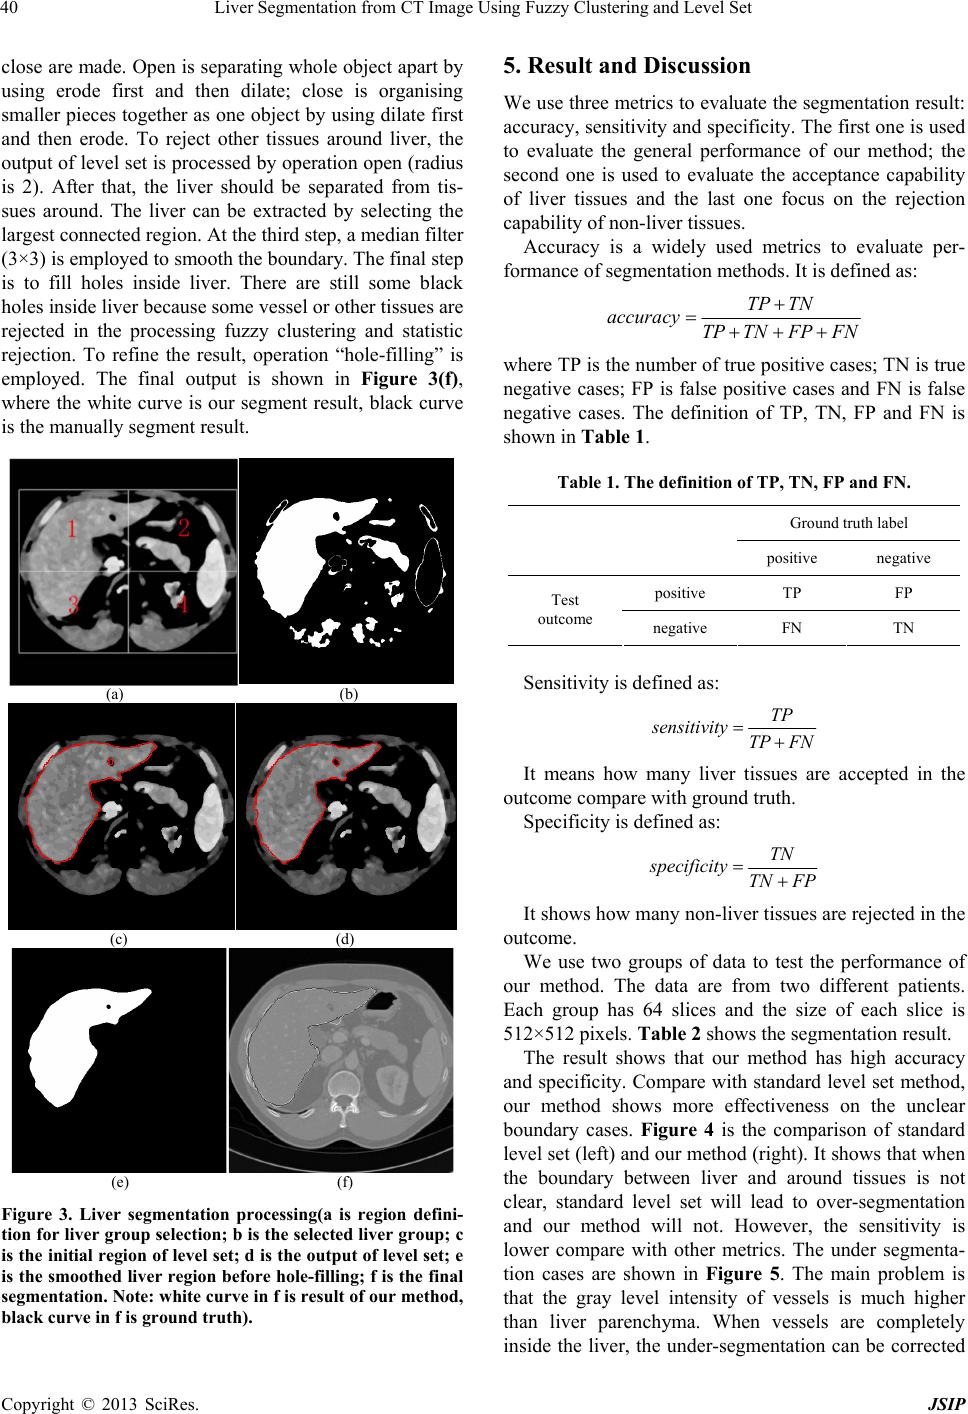
050100 150 200 25030
0
2000
4000
6000
8000
10000
12000
14000
16000
(a) (b)
0
0.5
1
1.5
2
2.5
x 10
4
050100 150 200 250
(c) (d)
Figure 2. The original and enhanced image and their histo-
gram (a is original image; b is histogram of a; c is contrast
enhanced image; d is histogram of c. Note: ∆ in b are the
thresholds of liver peak).
4.2. Fuzzy Clustering with Level Set
Segmentation
Our work is based on spatial fuzzy c-mean clustering [8]
and a distance regularized level set [4]. The problem of
both methods above is that they are semi-automatic
methods. The spatial fuzzy clustering needs user to
choose which class is the liver, so the level set refine-
ment can continue on that class. The distance regularized
level set needs user to select seed points. Moreover, the
number of cluster group is fixed. In some cases, liver
tissue may be clustered into different groups. For these
reasons, human participate is needed. To make the
method fully automatic and achieve better segment result,
we proposed the following improvements:
1. The image is cluster edict 4 groups based on Equa-
tion (1-6). One for liver, one for background, one for
other tissues brighter than liver (such as bones), and one
for tissues darker than liver (such as muscles). The
membership matrix u is initialized by random number;
repeat Equation (3-6) until J in Equation (1) less than
0.01. In our work,
represents the gray level of each
pixels, m = 2, p = 1, q = 1 and ()
NB x represents a (5 ×
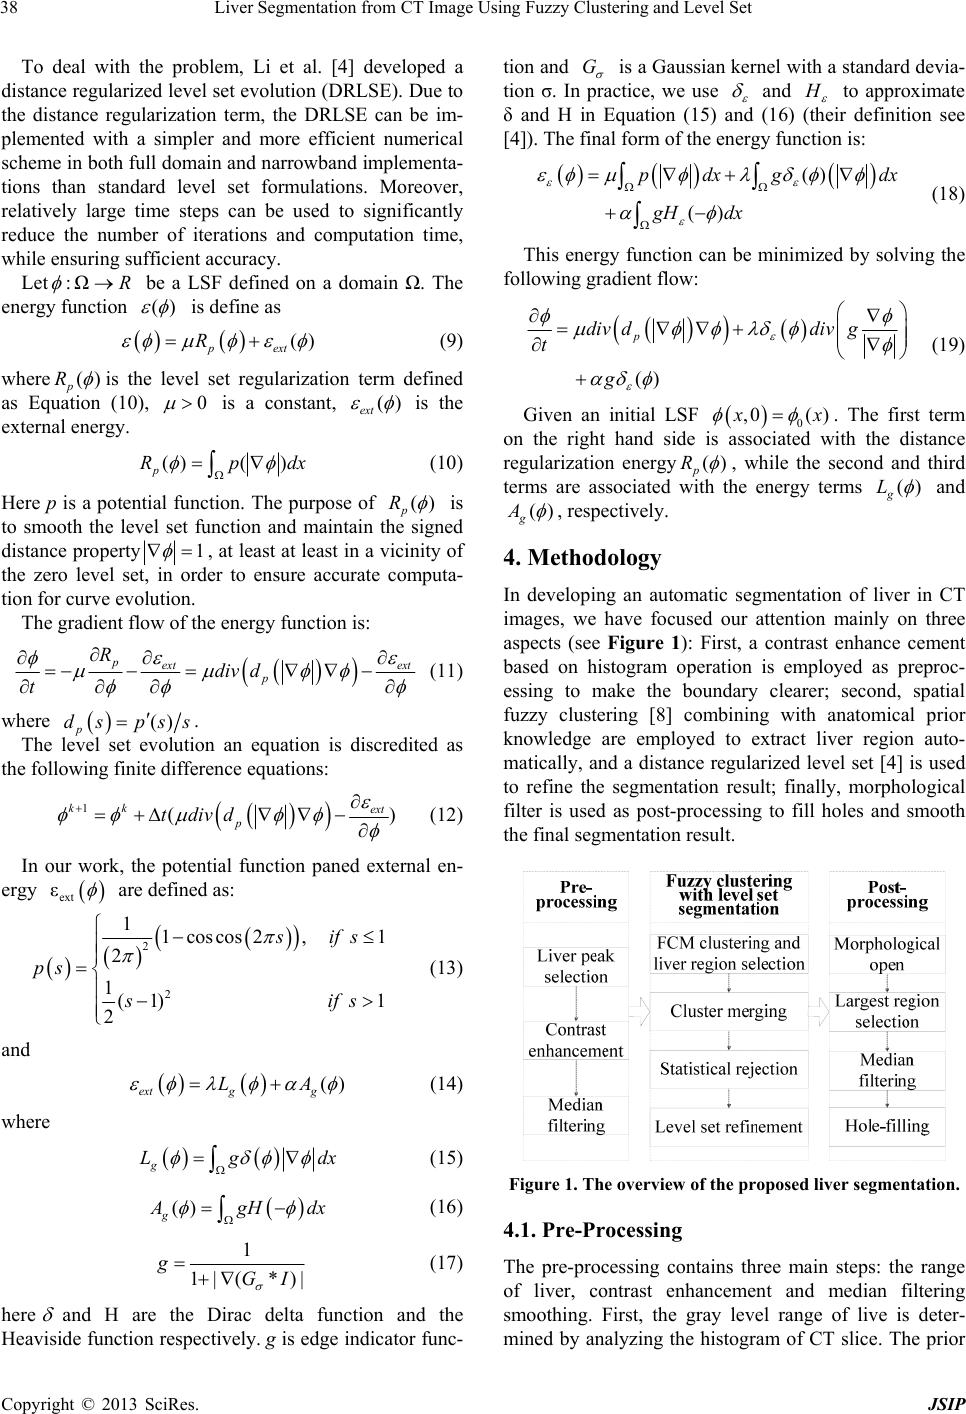
5) window. The selection of liver group is done auto-
matically by using prior knowledge. Liver is the largest
organ located at upper left of CT slice. So we locate the
abdomen in the CT slice and divide it into 4 equal areas
(see Figure 3(a)). The group with most pixels locate at
the region 1(except background group) will most proba-
bly be the group contains liver. The background group
can be rejected by analysing the gray level intensity of
each group (it has the lowest average gray level inten-
sity).
2. In some cases, there are only a few other tissues in
the CT slice. The liver may be clustered into separate
groups. Therefore, merging similar groups is necessary.
Calculate average gray level intensity of each group on
original image instead of contrast enhanced image be-
cause the difference in enhanced image will always be
large even if the intensity is similar in original image. If
there is another group whose average intensity is similar
enough (difference less than 2.5) to liver group, add it to
the liver group.
3. Calculate the average intensity and standard devia-
tion of the liver group and reject tissues which are not
belong to liver based on statistic theory. Letk
x be the
gray level intensity of pixels of liver group,x be the
average intensity of liver group, and be the standard
deviation. The pixels which belong to liver are defined
as:
x(x3δ,x 3δ)
k
(20)
4. The largest connected region of selected group
works as initialization of level set. In Li’s work [4], they
presented two kinds of application. One is the initial re-
gion contains all object and the other is the initial region
is all inside the object. In our work we use the first cases.
The reason is that there are less fake boundaries outside
liver. To make initial region contains all liver, we extend
the region out for 5 pixels. Then the level set is use on
the image after contrast enhancement which has clearer
boundary to avoid leakage. In our work, 0
C=2; ∆t=5 is
used in Equation (12); μ=0.04, λ=5, α=1.5 are used in
Equation (19) and the number of iterations is 40.
4.3. Post-Processing
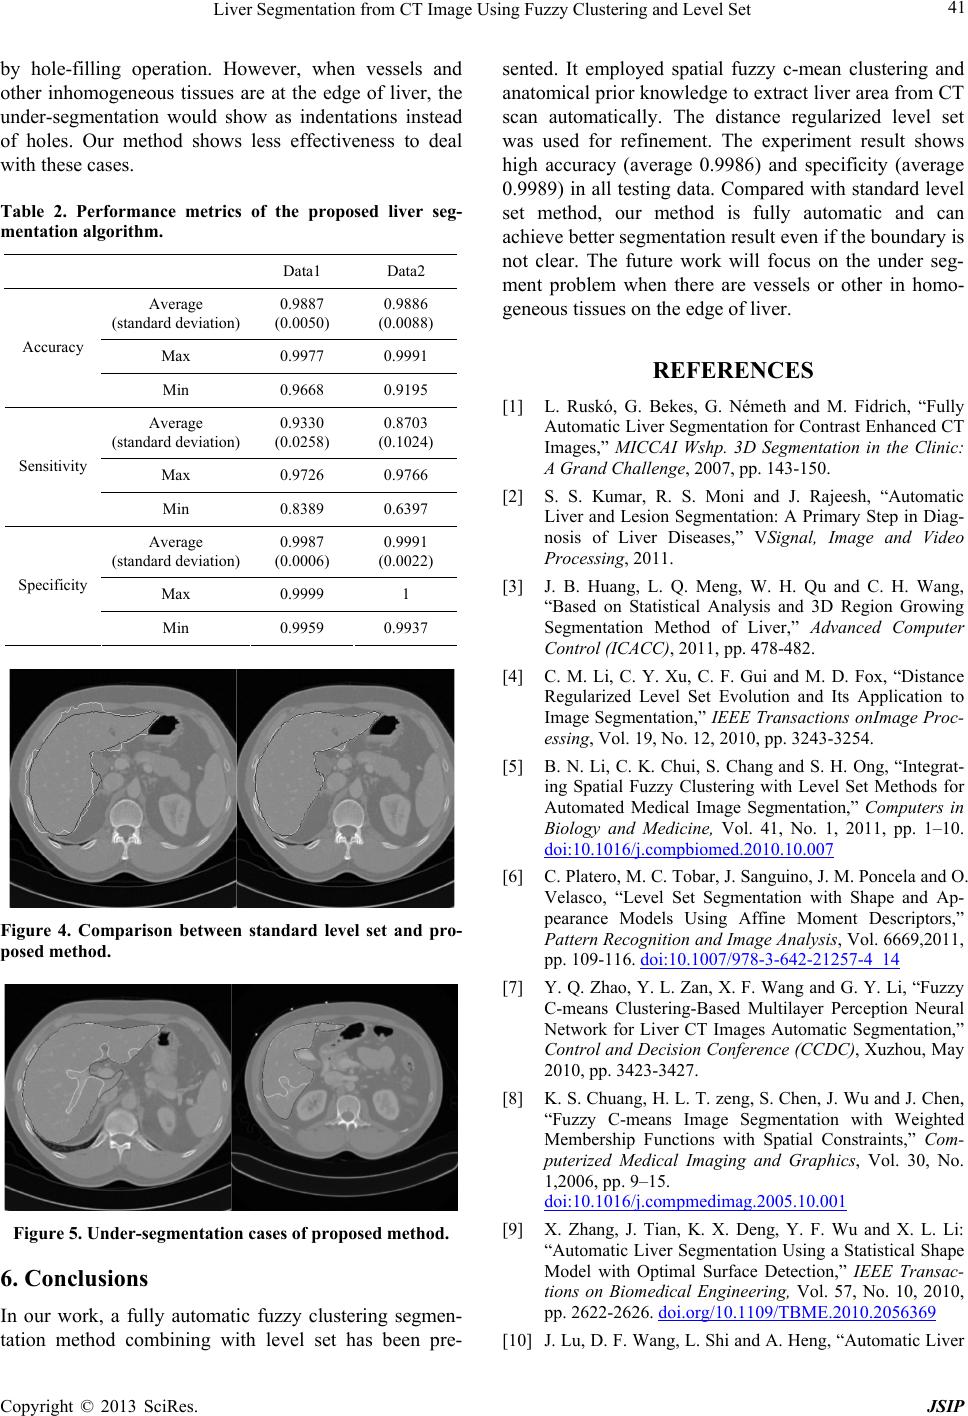
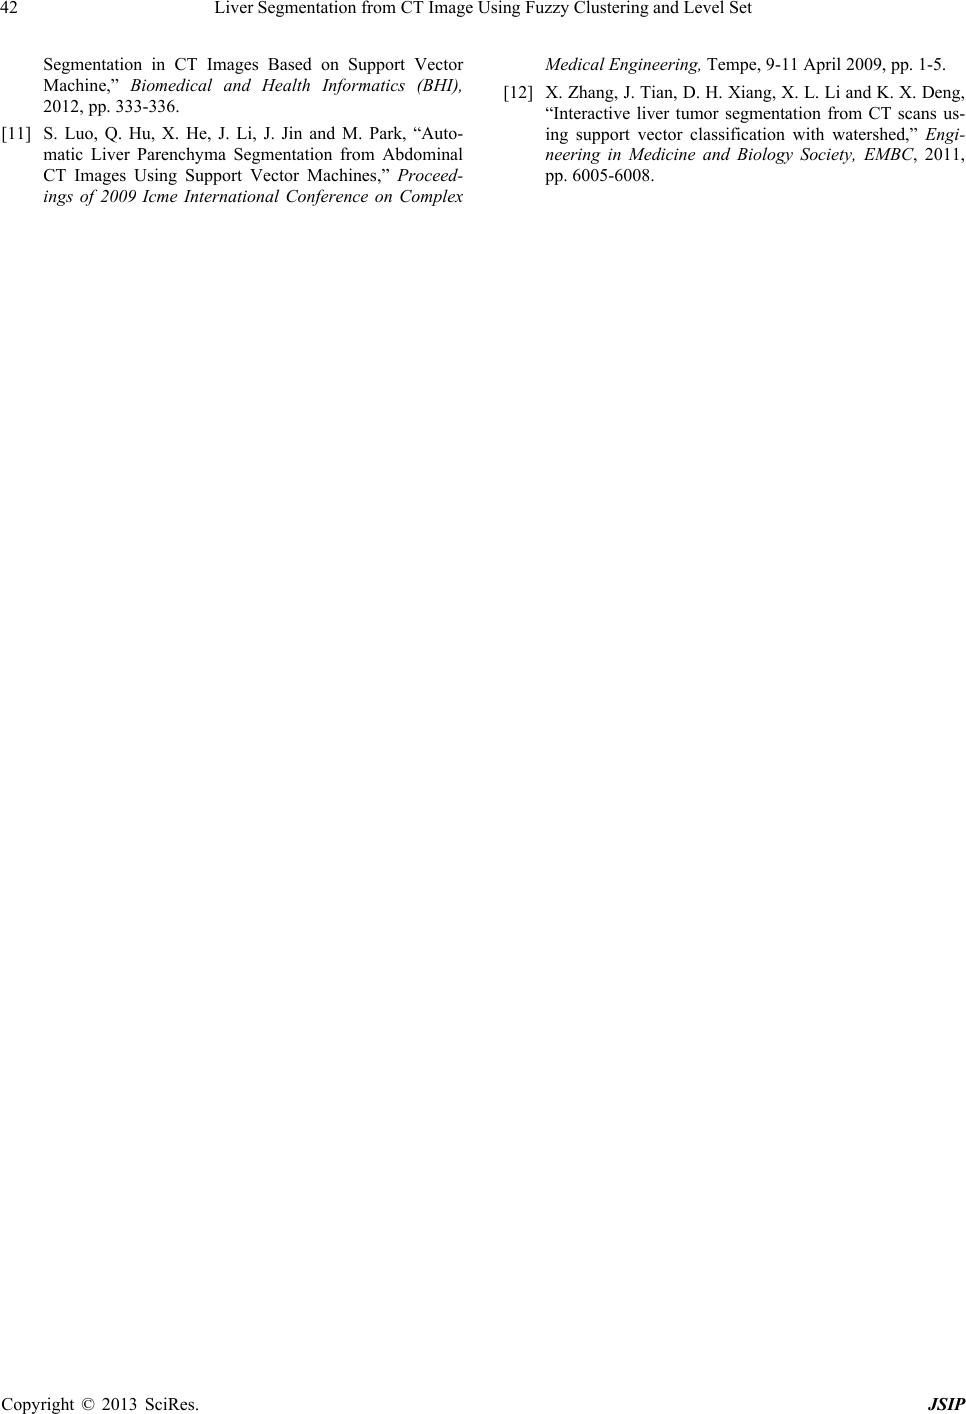
There are three main problems in the output of level set.
One is that there may still be other tissues in the output
(such as heart tissues); another problem is that the con-
tour is not smooth where the boundary is not clear; the
final one is that there are holes in the liver area because
of contrast enhancement and statistic rejection. Therefore,
a post-processing based on morphology is needed.
There are two main morphological operations: dilate
and erode. By using them together, operations open and
Copyright © 2013 SciRes. JSIP