 Journal of Global Positioning Systems (2008) Vol. 7, No. 1 : 1-8 GPS RTK Performance Characteristics and Analysis Yanming Feng Faculty of Information Technology, Queensland University of Technology, Australia Jinling Wa ng School of Surveyin g and Spatial Information Systems, The University of New Sou th Wales, Australia Abstract Global Navigation Satellite Systems (GNSS) provide various types of positioning state solutions, such as single point positioning (SPP), precise point positioning (PPP), differential GPS (DGPS) and real time kinematic (RTK) solutions. These solutions are obtained involving different data types, receivers, samples, serving different classes of users. Previous studies on performance characteristics have mainly focused on SPP solutions for safety-of-life navigation applications. This paper defines various useful performance characteristics for carrier phase Ambiguity Resolution (AR) and Position Estimation (PE) solutions in the RTK context. These parameters, including base-rover distance, time-to-first fix (TTFF), AR reliability, RTK accuracy, availability and integrity, etc, effectively represent the performance of a commercial RTK system and can be used to evaluate RTK systems and algorithms, and processing strategies through extensive experimental results. Statistical results from extensive field experiments were obtained using a commercial RTK system, demonstrating convincing overall system performance in different perspectives. Experimental results from three baselines were also analysed using a version of research- oriented RTK software, showing that AR performance improvement of using Wide-lane (WL) and Narrow-lane (NL) signals with respect to the original L1 and L2 signals when the baselines exceed 20 kilometres. Key words: GNSS, real time kinematic (RTK) positioning, performance characteristics, ambiguity resolution (AR), RTK integrity. 1. Introduction Global Navigation Satellite Systems (GNSS) positioning may be classified into several different types, depending on (i) the types of measurements used in the positioning estimation, (ii) the data epochs or data arcs required to create a set of solutions, and (iii) the number of receivers involved in the positioning operations. Single Point Positioning (SPP) produces navigation solutions with pseudorange measurements from a single receiver and a single epoch. Precise Point Positioning (PPP) solutions are obtained using both code and phase measurements from a single receiver, but a period of observations, e.g., tens of minutes to hours, regardless of kinematic or static user applications. Differential GPS (DGPS) solutions are based on code measurements from a single epoch as well, but using the differential corrections from a reference station or network. Real Time Kinematic (RTK) positioning makes use of carrier phase measurements in the differential positioning mode, ideally, from a single epoch. Practically, multiple epochs or a short period of observations are often involved to achieve reliable AR, while the RTK solutions are derived from the current epochs. Different characteristics are required to evaluate various GNSS solutions, to address positioning performance requirements for various applications. Code based SPP and DGPS navigation are the simplest and most robust positioning modes, but, evaluation of code based navigation solutions has been a quite involved problem. The parameters of accuracy, availability, continuity and integrity are defined to evaluate the performance of navigation solutions in aviation navigation (Langley, 1999). For instance, availability is an instantaneous performance characteristic defined as a percentage of time during which the service is available at a certain accuracy. Integrity relates to the level of trust that can be placed in the information provided by the navigation system. It includes the ability of the navigation system to provide timely and valid warnings to users when the system must not be used for the intended operation or phase of flight. GPS does not provide integrity information to users. In the context of integrity, three parameters, integrity risk, time to alert and alarm-limit are defined. Furthermore, various methods for monitoring the  Feng et al: GPS RTK Performance Characteristics and Analysis 2 integrity of GPS SPP solutions have been proposed (i) external monitoring, which relies on a number of ground stations, where a faulty individual satellite is identified and a warning is sent to users within the time-to-alert required. The typical example is the Wide Area Augmentation Systems (WAAS) (Enge et al, 1996; Walter, 2002), (ii) Receiver Autonomous Integrity Monitoring (RAIM) (Brown, 1996), which is applicable within a user receiver to autonomously determine system integrity. The method attempts to detect the existence of faulty measurements and identification of unhealthy satellites. RTK positioning is a much more complicated and vulnerable process, aiming to achieve the accuracy as high as centimetres with as few as possible data epochs in real time for any user kinematics. Therefore a greater care has to be taken of to characterise the performance and to address the concerns of liability-critical professional positioning users, such as surveying, data acquisitions, machine automation in precision agriculture, mining and construction and future safety- related vehicle navigation. In many applications, users are concerned about not only accuracy, but also availability and integrity of the solutions. For instance, in an open cut mine, the cost of every hour of RTK service outages to the productions would reach the level of one million (Higgins, 2007). However, RTK performance characteristics are much less studied and understood than those of the SPP solutions. This paper presents a systematic review for RTK performance characteristics and then evaluates the GNSS ambiguity resolution (AR) and RTK performance with GPS measurements in terms of the various RTK performance parameters, which may not necessarily be suitable for real time quality control purposes. In the following sections, we first present the definitions of various performance parameters for AR and RTK solutions in order to comprehensively evaluate performance of a RTK system. Next, we outline the linear equations for AR and Position Estimation (PE) with the specific WL and NL signals, to conceptually demonstrate the dependence of performance on the models and algorithms. In the forth section, we will first examine the statistical results for the different performance parameters of a commercial RTK system, HD-RTK2TM, according to its extensive data sets of different baselines. Utilising the research version of the QUT-RTK software, we then compare AR performance improvement of the WL and NL signals with respect to the use of the original L1 and L2 signals. In this analysis, three 24-h RINEX data sets over the baselines of 21, 56 and 74 km will be analysed. Finally, the major results of RTK performance characterisations and extensive numerical analyses are outlined. 2. Performance Characteristics of a RTK System A RTK system consists of a continuous operating reference station network and data links between a network server and reference stations and between the server and user-terminals. The reference network comprises a minimum of one reference station and a network server with a data processing facility. Data links set up between the network server and user receivers provide or deliver the differential corrections to user- terminals. The user terminal is generally equipped with a GNSS RTK receiver and a communication device and a user control/interface unit where RTK solutions are integrated or interfaced with a particular application. To completely assess the performance of a RTK system, the following parameters should be considered (Feng & Wang, 2007): Base-rover distance, which is the maximum radius of circle coverage, where a signal base station can serve effectively, allowing the users to receive the RTCM messages within certain latency and obtain its RTK solutions epoch-by-epoch. A relevant concept is the inter-station distance in the network-based RTK case. As shown in Fig. 1, the base-rover distance D is approximately equivalent to 0.5774 times of the inter- station distance S. For instance in the Virtual Reference Station (VRS) system where the maximum inter-station spacing is S=70 km, the equivalent maximum base-rover distance is about 40 km. The distance limitation is mainly caused by the strong dependence of the ionospheric biases on the separation of two receivers. The next distance-dependent error factor is the residual tropospheric errors after modelling corrections. The effect of broadcast orbital errors is relatively small and may be ignored. The system performance is considered more desirable if a longer base-rover distance is allowed. Timeliness of RTCM message, which is defined as the time latency of the latest RTCM message available for users with respect to the user time instant at which the user states are needed to compute. Users will need to predict the ranging corrections to the most current time instant when the user-terminal produce RTK solutions. This latency is the sum of delays caused by data processing at the base station/network centre and data transmissions from base stations to network centre, and messages from the network server to users, typically one to a few seconds. This parameter is obtainable from statistical results for a given operational environment and communication links. Another related parameter is the communication rates, for instance, 1Hz, or 5Hz and 10Hz. The higher communication rates are required for higher position update rates and control of position accuracy. 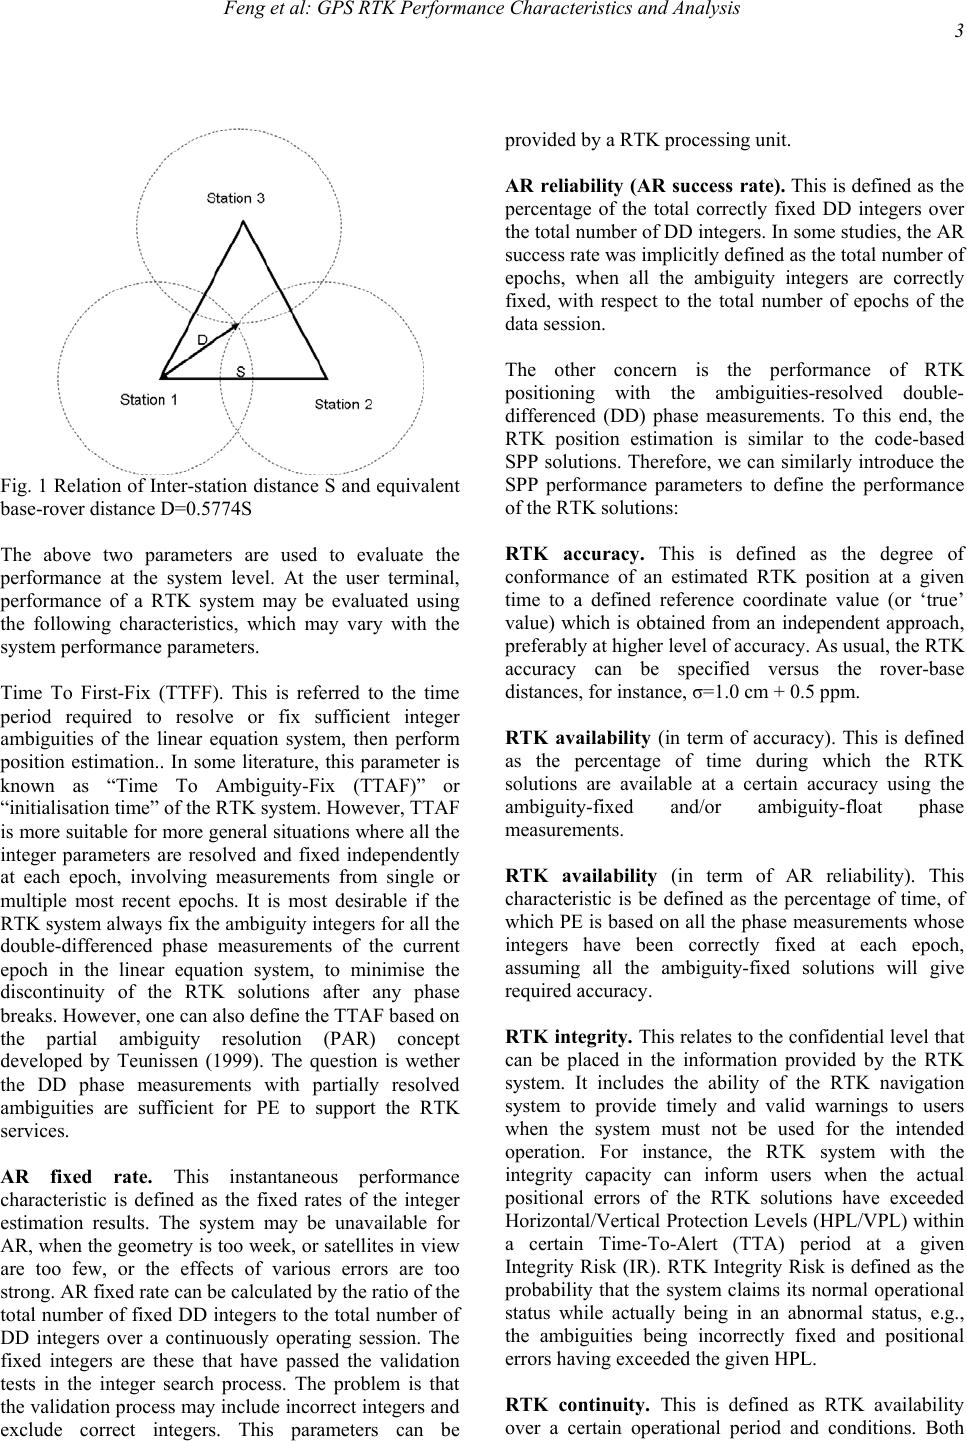 Feng et al: GPS RTK Performance Characteristics and Analysis 3 Fig. 1 Relation of Inter-station distance S and equivalent base-rover distance D=0.5774S The above two parameters are used to evaluate the performance at the system level. At the user terminal, performance of a RTK system may be evaluated using the following characteristics, which may vary with the system performance parameters. Time To First-Fix (TTFF). This is referred to the time period required to resolve or fix sufficient integer ambiguities of the linear equation system, then perform position estimation.. In some literature, this parameter is known as “Time To Ambiguity-Fix (TTAF)” or “initialisation time” of the RTK system. However, TTAF is more suitable for more general situations where all the integer parameters are resolved and fixed independently at each epoch, involving measurements from single or multiple most recent epochs. It is most desirable if the RTK system always fix the ambiguity integers for all the double-differenced phase measurements of the current epoch in the linear equation system, to minimise the discontinuity of the RTK solutions after any phase breaks. However, one can also define the TTAF based on the partial ambiguity resolution (PAR) concept developed by Teunissen (1999). The question is wether the DD phase measurements with partially resolved ambiguities are sufficient for PE to support the RTK services. AR fixed rate. This instantaneous performance characteristic is defined as the fixed rates of the integer estimation results. The system may be unavailable for AR, when the geometry is too week, or satellites in view are too few, or the effects of various errors are too strong. AR fixed rate can be calculated by the ratio of the total number of fixed DD integers to the total number of DD integers over a continuously operating session. The fixed integers are these that have passed the validation tests in the integer search process. The problem is that the validation process may include incorrect integers and exclude correct integers. This parameters can be provided by a RTK processing unit. AR reliability (AR success rate). This is defined as the percentage of the total correctly fixed DD integers over the total number of DD integers. In some studies, the AR success rate was implicitly defined as the total number of epochs, when all the ambiguity integers are correctly fixed, with respect to the total number of epochs of the data session. The other concern is the performance of RTK positioning with the ambiguities-resolved double- differenced (DD) phase measurements. To this end, the RTK position estimation is similar to the code-based SPP solutions. Therefore, we can similarly introduce the SPP performance parameters to define the performance of the RTK solutions: RTK accuracy. This is defined as the degree of conformance of an estimated RTK position at a given time to a defined reference coordinate value (or ‘true’ value) which is obtained from an independent approach, preferably at higher level of accuracy. As usual, the RTK accuracy can be specified versus the rover-base distances, for instance, σ=1.0 cm + 0.5 ppm. RTK availability (in term of accuracy). This is defined as the percentage of time during which the RTK solutions are available at a certain accuracy using the ambiguity-fixed and/or ambiguity-float phase measurements. RTK availability (in term of AR reliability). This characteristic is be defined as the percentage of time, of which PE is based on all the phase measurements whose integers have been correctly fixed at each epoch, assuming all the ambiguity-fixed solutions will give required accuracy. RTK integrity. This relates to the confidential level that can be placed in the information provided by the RTK system. It includes the ability of the RTK navigation system to provide timely and valid warnings to users when the system must not be used for the intended operation. For instance, the RTK system with the integrity capacity can inform users when the actual positional errors of the RTK solutions have exceeded Horizontal/Vertical Protection Levels (HPL/VPL) within a certain Time-To-Alert (TTA) period at a given Integrity Risk (IR). RTK Integrity Risk is defined as the probability that the system claims its normal operational status while actually being in an abnormal status, e.g., the ambiguities being incorrectly fixed and positional errors having exceeded the given HPL. RTK continuity. This is defined as RTK availability over a certain operational period and conditions. Both  Feng et al: GPS RTK Performance Characteristics and Analysis 4 TTAF and AR availability will affect the RTK continuity. This parameter is provided to address user requirement for the tolerable service down-time over a certain operational period, such as 24 hours and 7 days. For instance in mining and civil construction, user tolerable down-time is about 1 to 2 minutes per day, corresponding a 99.9% of continuity requirement of services (Positioning one consulting, 2008). Those parameters may be either all or selectively used to evaluate performance of a RTK system, although variations and modifications to these definitions are still possible. Of these parameters, the base-rover distance, time to ambiguity fix, AR reliability, RTK availability and RTK accuracy may be of most concerns to most professional users. The concept of RTK integrity is also important from the liability-critical users’ perspective. In farming machine automation applications, the HPL is about 10 centimetres while for civil construction machine automation, the requirement for VPL would be as high as a few centimetres ((Positioning one consulting, 2008). However, few existing commercial RTK systems provide sufficient performance parameters in their specifications. Obviously, more detailed performance information would indeed help the users choose a desirable RTK system to meet the performance requirements, including integrity requirements. 3. Linear equations for ambiguity resolution with wide-lane and narrow-lane phase measurements For a typical single-base RTK problem, the standard linearised observation equations for the n×1 double- differenced pseudoranges P1 (or C/A) and P2, carrier phases L1 and L2 can be written as follows (Misra and Enge, 2004) ⎥ ⎥ ⎥ ⎥ ⎦ ⎤ 2L 1L 2P 1P ρ X L2 ⎥ ⎥ ⎥ ⎦ ⎤ ⎢ ⎢ ⎢ ⎣ ⎡ ε ε ε + ⎥ ⎦ ⎤ ⎢ ⎣ ⎡ ⎥ ⎥ ⎥ ⎦ ⎤ ⎢ ⎢ ⎢ ⎣ ⎡ λ−λ λ−λ−δ ⎥ ⎥ ⎥ ⎦ ⎤ ⎢ ⎢ ⎢ ⎣ ⎡ = ⎥ ⎥ ⎥ ⎦ ⎤ ⎢ ⎢ ⎢ ⎣ ⎡ δ δ δ − − −− −− − − )1,1(L )3,4(L )1,1(P 2 1 )1,1()1,1( )3,4()3,4( )1,1( )3,4( 1,1 N N II II 00 X A A A L L P )1,1( P ⎢ ⎢ ⎢ ⎢ ⎣ ⎡ ε ε ε ε + ⎥ ⎦ ⎤ ⎢ ⎣ ⎡ ⎥ ⎥ ⎥ ⎥ ⎦ ⎤ ⎢ ⎢ ⎢ ⎢ ⎣ ⎡ λ λ −δ ⎥ ⎥ ⎥ ⎥ ⎦ ⎤ ⎢ ⎢ ⎢ ⎢ ⎣ ⎡ = ⎥ ⎥ ⎥ ⎥ ⎦ ⎤ ⎢ ⎢ ⎢ ⎢ ⎣ ⎡ ρ− ρ− ρ− ρ− = ⎥ ⎥ ⎥ ⎥ ⎦ ⎤ ⎢ ⎢ ⎢ ⎢ ⎣ ⎡ δ δ δ δ 2 1 2 1 2 1 2 1 2 1 2 1 N N I0 0I 00 00 X A A A A L L P P L L P P (1) where is the n×1 computed double-differenced range vector; A is the n×3 observational matrix; δis the 3×1 user state vector; the carrier phases L1 and L2; have the wavelengths λ1 and λ2 and the integer ambiguities and respectively; εp1, εp2, εL1 and εL2 are the noise vectors for the respective measurement vectors ,and . 1 N 1 Pδ 2 N 2 Pδδ 1Lδ Feng and Rizos (2007) and Feng (2008) suggested the use of the Wide-Lane (WL) L(1,-1) and Narrow-Lane (NL) L(4,-3) instead, in order to minimise the effects of the larger ionospheric errors for AR over longer ranges. P(1,1)= (f1P1+f2P2)/(f1+f2); (2) L(1,-1) =(f1L1-f2L2)/(f1-f2); (3) L(4,-3) =(4f1L1-3f2L2)/(4f1-3f2); (4) where f1 and f2 stand for the frequencies for L1 and L2 carrier respectively. In (2) to (4), the subscript (i, j) represents the integer values of the coefficients of the combined measurements. L(1,-1) and L(4,-3) have the wavelengths of λ(1,-1)=86.2 cm, and λ(4,-3)=11.45 cm, respectively. As a result, we have the following linear equations, (5) )3,4( L− where , and are the residual vectors between the observed and computed range vector )1,1( L− δ or the n×1 double-differenced P(1,1), L(1,-1) and L(4,-3) measurement vectors; I is the n×n identity matrix; εp1,1, εL(1,-1), εL(4,-3), are the noise vectors for P(1,1), L(1,-1) and L(4,-3) measurements, respectively. n=k-1 where k is the number of satellites used in computation. For convenience, Equations (1) and (2) are rewritten as follows, jjjjjj NBXAY (6) 12 )(;0)( − == jjj WVarE σεε (7) where the subscript j represents the jth epoch; δY is the m×1 observation vector; A is the m×3 matrix; δX is the 3×1 state vector; and B is the m×p matrix, N is the p×1 ambiguity vector; in which m=3(k-1) and p=2(k-1) with dual-frequency GPS measurements. The above equations are provided for each measurement epoch, implying that the state and ambiguity parameters are estimated and fixed with the measurements at the current epoch only, which yields desirable kinematic position solutions without imposing the assumptions of phase measurement continuity and sample intervals. Modelling is always the first key process for a RTK system. This includes the processes of combining and differencing measurements, imposing constraints such as known coordinates and integers, applying ionosphere and troposphere corrections etc. The stochastic models (7) give the statistical knowledge or assumptions on the residual errors and measurement noises, such as zero 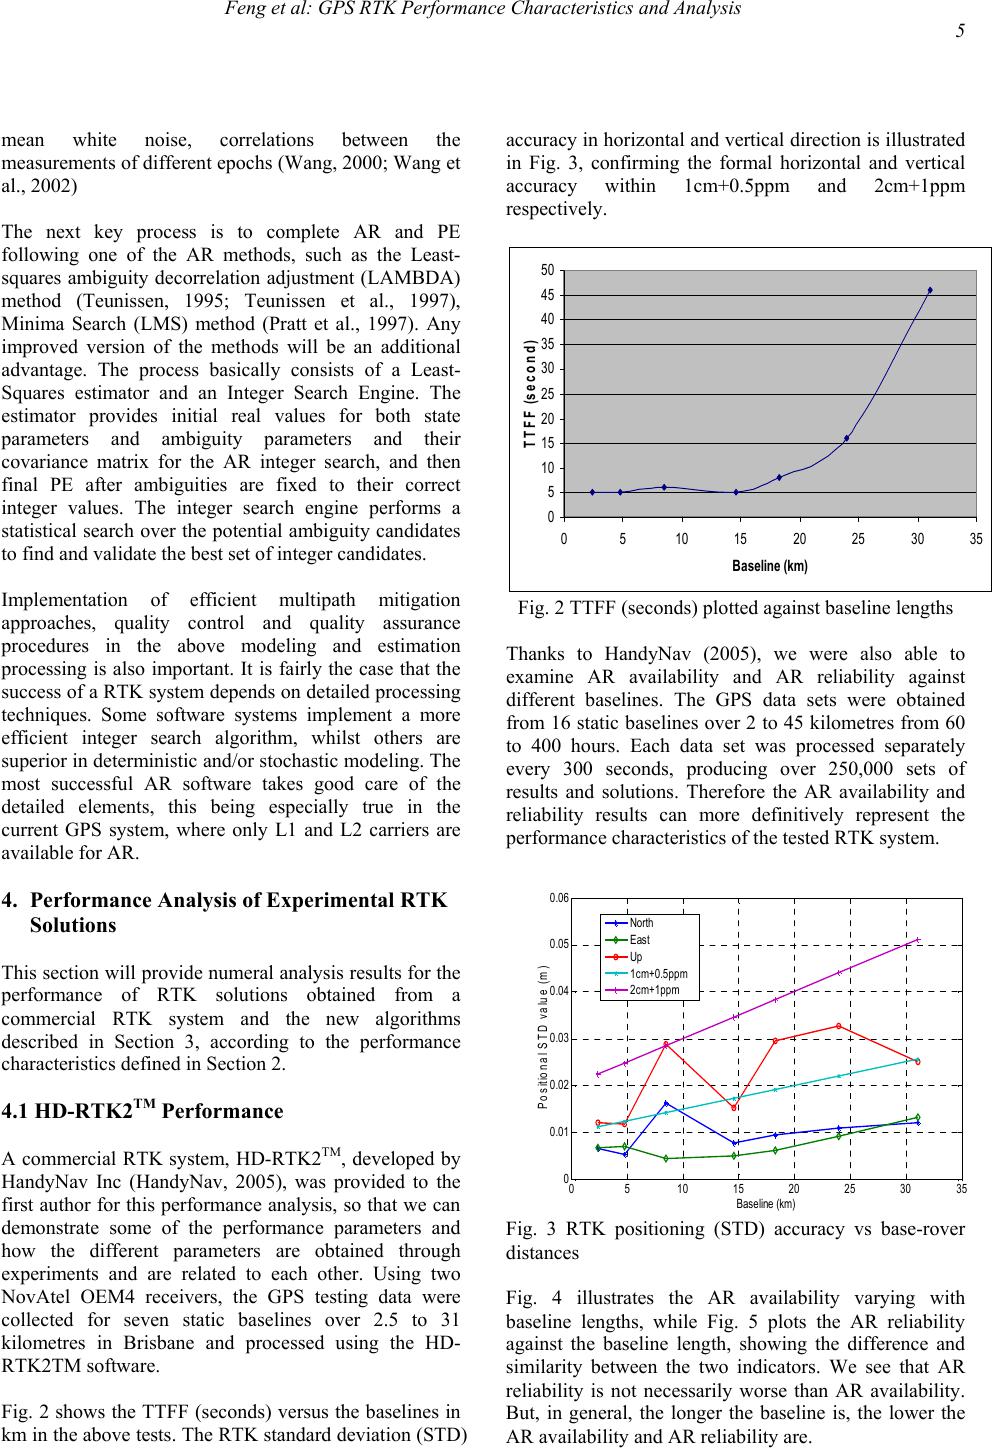 Feng et al: GPS RTK Performance Characteristics and Analysis 5 mean white noise, correlations between the measurements of different epochs (Wang, 2000; Wang et al., 2002) The next key process is to complete AR and PE following one of the AR methods, such as the Least- squares ambiguity decorrelation adjustment (LAMBDA) method (Teunissen, 1995; Teunissen et al., 1997), Minima Search (LMS) method (Pratt et al., 1997). Any improved version of the methods will be an additional advantage. The process basically consists of a Least- Squares estimator and an Integer Search Engine. The estimator provides initial real values for both state parameters and ambiguity parameters and their covariance matrix for the AR integer search, and then final PE after ambiguities are fixed to their correct integer values. The integer search engine performs a statistical search over the potential ambiguity candidates to find and validate the best set of integer candidates. Implementation of efficient multipath mitigation approaches, quality control and quality assurance procedures in the above modeling and estimation processing is also important. It is fairly the case that the success of a RTK system depends on detailed processing techniques. Some software systems implement a more efficient integer search algorithm, whilst others are superior in deterministic and/or stochastic modeling. The most successful AR software takes good care of the detailed elements, this being especially true in the current GPS system, where only L1 and L2 carriers are available for AR. 4. Performance Analysis of Experimental RTK Solutions This section will provide numeral analysis results for the performance of RTK solutions obtained from a commercial RTK system and the new algorithms described in Section 3, according to the performance characteristics defined in Section 2. 4.1 HD-RTK2TM Performance A commercial RTK system, HD-RTK2TM, developed by HandyNav Inc (HandyNav, 2005), was provided to the first author for this performance analysis, so that we can demonstrate some of the performance parameters and how the different parameters are obtained through experiments and are related to each other. Using two NovAtel OEM4 receivers, the GPS testing data were collected for seven static baselines over 2.5 to 31 kilometres in Brisbane and processed using the HD- RTK2TM software. Fig. 2 shows the TTFF (seconds) versus the baselines in km in the above tests. The RTK standard deviation (STD) accuracy in horizontal and vertical direction is illustrated in Fig. 3, confirming the formal horizontal and vertical accuracy within 1cm+0.5ppm and 2cm+1ppm respectively. 0 5 10 15 20 25 30 35 40 45 50 0510 1520 2530 35 Basel i ne ( km ) TTFF (second) Fig. 2 TTFF (seconds) plotted against baseline lengths Thanks to HandyNav (2005), we were also able to examine AR availability and AR reliability against different baselines. The GPS data sets were obtained from 16 static baselines over 2 to 45 kilometres from 60 to 400 hours. Each data set was processed separately every 300 seconds, producing over 250,000 sets of results and solutions. Therefore the AR availability and reliability results can more definitively represent the performance characteristics of the tested RTK system. 0.06 05 10 15 20 25 3035 0 0.01 0.02 0.03 0.04 0.05 Baseline (km) Positional S TD value (m ) Nor t h East Up 1cm+0.5ppm 2cm+1ppm Fig. 3 RTK positioning (STD) accuracy vs base-rover distances Fig. 4 illustrates the AR availability varying with baseline lengths, while Fig. 5 plots the AR reliability against the baseline length, showing the difference and similarity between the two indicators. We see that AR reliability is not necessarily worse than AR availability. But, in general, the longer the baseline is, the lower the AR availability and AR reliability are. 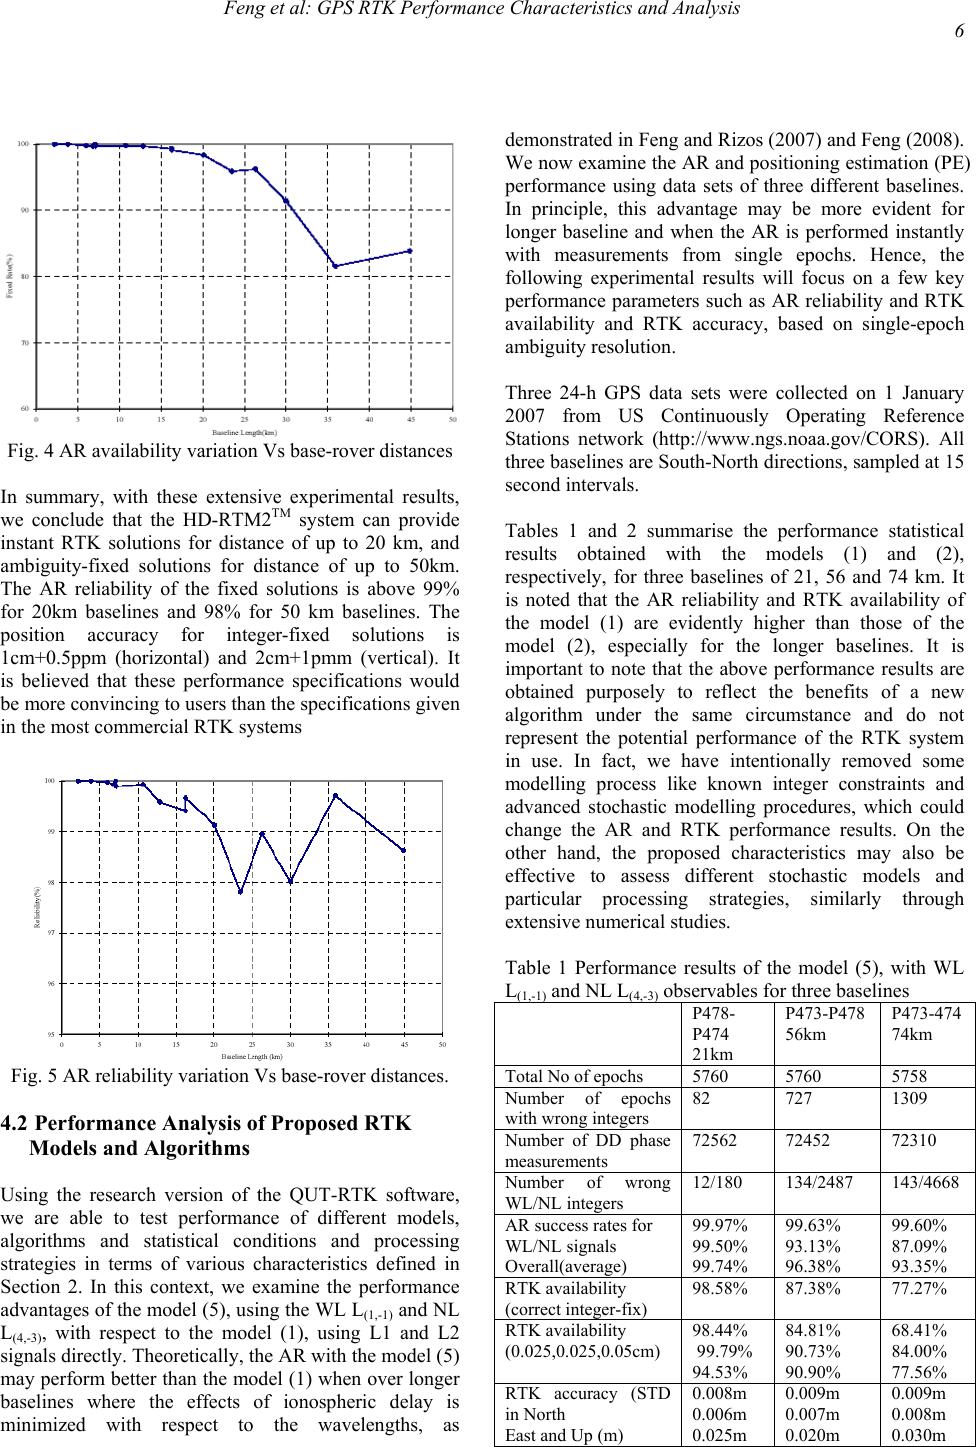 Feng et al: GPS RTK Performance Characteristics and Analysis 6 Fig. 4 AR availability variation Vs base-rover distances In summary, with these extensive experimental results, we conclude that the HD-RTM2TM system can provide instant RTK solutions for distance of up to 20 km, and ambiguity-fixed solutions for distance of up to 50km. The AR reliability of the fixed solutions is above 99% for 20km baselines and 98% for 50 km baselines. The position accuracy for integer-fixed solutions is 1cm+0.5ppm (horizontal) and 2cm+1pmm (vertical). It is believed that these performance specifications would be more convincing to users than the specifications given in the most commercial RTK systems Fig. 5 AR reliability variation Vs base-rover distances. 4.2 Performance Analysis of Proposed RTK Models and Algorithms Using the research version of the QUT-RTK software, we are able to test performance of different models, algorithms and statistical conditions and processing strategies in terms of various characteristics defined in Section 2. In this context, we examine the performance advantages of the model (5), using the WL L(1,-1) and NL L(4,-3), with respect to the model (1), using L1 and L2 signals directly. Theoretically, the AR with the model (5) may perform better than the model (1) when over longer baselines where the effects of ionospheric delay is minimized with respect to the wavelengths, as demonstrated in Feng and Rizos (2007) and Feng (2008). We now examine the AR and positioning estimation (PE) performance using data sets of three different baselines. In principle, this advantage may be more evident for longer baseline and when the AR is performed instantly with measurements from single epochs. Hence, the following experimental results will focus on a few key performance parameters such as AR reliability and RTK availability and RTK accuracy, based on single-epoch ambiguity resolution. Three 24-h GPS data sets were collected on 1 January 2007 from US Continuously Operating Reference Stations network (http://www.ngs.noaa.gov/CORS). All three baselines are South-North directions, sampled at 15 second intervals. Tables 1 and 2 summarise the performance statistical results obtained with the models (1) and (2), respectively, for three baselines of 21, 56 and 74 km. It is noted that the AR reliability and RTK availability of the model (1) are evidently higher than those of the model (2), especially for the longer baselines. It is important to note that the above performance results are obtained purposely to reflect the benefits of a new algorithm under the same circumstance and do not represent the potential performance of the RTK system in use. In fact, we have intentionally removed some modelling process like known integer constraints and advanced stochastic modelling procedures, which could change the AR and RTK performance results. On the other hand, the proposed characteristics may also be effective to assess different stochastic models and particular processing strategies, similarly through extensive numerical studies. Table 1 Performance results of the model (5), with WL L(1,-1) and NL L(4,-3) observables for three baselines P478- P474 21km P473-P478 56km P473-474 74km Total No of epochs 5760 5760 5758 Number of epochs with wrong integers 82 727 1309 Number of DD phase measurements 72562 72452 72310 Number of wrong WL/NL integers 12/180 134/2487 143/4668 AR success rates for WL/NL signals Overall(average) 99.97% 99.50% 99.74% 99.63% 93.13% 96.38% 99.60% 87.09% 93.35% RTK availability (correct integer-fix) 98.58% 87.38% 77.27% RTK availability (0.025,0.025,0.05cm) 98.44% 99.79% 94.53% 84.81% 90.73% 90.90% 68.41% 84.00% 77.56% RTK accuracy (STD in North East and Up (m) 0.008m 0.006m 0.025m 0.009m 0.007m 0.020m 0.009m 0.008m 0.030m 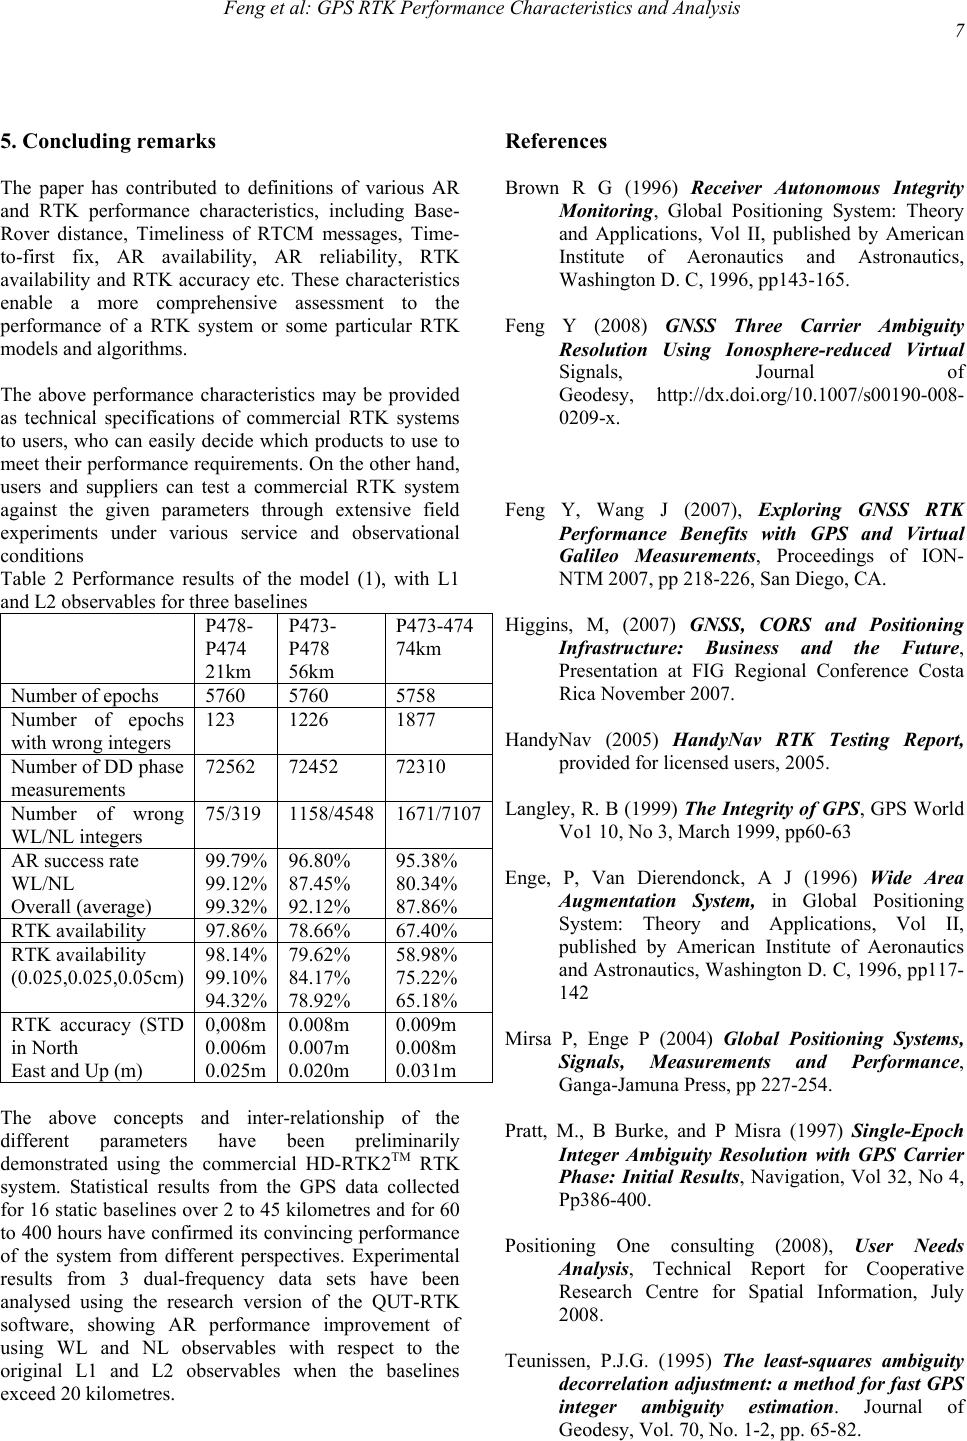 Feng et al: GPS RTK Performance Characteristics and Analysis 7 5. Concluding remarks The paper has contributed to definitions of various AR and RTK performance characteristics, including Base- Rover distance, Timeliness of RTCM messages, Time- to-first fix, AR availability, AR reliability, RTK availability and RTK accuracy etc. These characteristics enable a more comprehensive assessment to the performance of a RTK system or some particular RTK models and algorithms. The above performance characteristics may be provided as technical specifications of commercial RTK systems to users, who can easily decide which products to use to meet their performance requirements. On the other hand, users and suppliers can test a commercial RTK system against the given parameters through extensive field experiments under various service and observational conditions Table 2 Performance results of the model (1), with L1 and L2 observables for three baselines P478- P474 21km P473- P478 56km P473-474 74km Number of epochs 5760 5760 5758 Number of epochs with wrong integers 123 1226 1877 Number of DD phase measurements 72562 72452 72310 Number of wrong WL/NL integers 75/319 1158/4548 1671/7107 AR success rate WL/NL Overall (average) 99.79% 99.12% 99.32% 96.80% 87.45% 92.12% 95.38% 80.34% 87.86% RTK availability 97.86% 78.66% 67.40% RTK availability (0.025,0.025,0.05cm) 98.14% 99.10% 94.32% 79.62% 84.17% 78.92% 58.98% 75.22% 65.18% RTK accuracy (STD in North East and Up (m) 0,008m 0.006m 0.025m 0.008m 0.007m 0.020m 0.009m 0.008m 0.031m The above concepts and inter-relationship of the different parameters have been preliminarily demonstrated using the commercial HD-RTK2TM RTK system. Statistical results from the GPS data collected for 16 static baselines over 2 to 45 kilometres and for 60 to 400 hours have confirmed its convincing performance of the system from different perspectives. Experimental results from 3 dual-frequency data sets have been analysed using the research version of the QUT-RTK software, showing AR performance improvement of using WL and NL observables with respect to the original L1 and L2 observables when the baselines exceed 20 kilometres. References Brown R G (1996) Receiver Autonomous Integrity Monitoring, Global Positioning System: Theory and Applications, Vol II, published by American Institute of Aeronautics and Astronautics, Washington D. C, 1996, pp143-165. Feng Y (2008) GNSS Three Carrier Ambiguity Resolution Using Ionosphere-reduced Virtual Signals, Journal of Geodesy, http://dx.doi.org/10.1007/s00190-008- 0209-x. Feng f ION- NTM 2007, pp 218-226, San Diego, CA. Higgin egional Conference Costa Rica November 2007. Handy esting Report, provided for licensed users, 2005. Langl , GPS World Vo1 10, No 3, March 1999, pp60-63 Enge, stronautics, Washington D. C, 1996, pp117- 142 Mirsa Performance, Ganga-Jamuna Press, pp 227-254. Pratt, l Results, Navigation, Vol 32, No 4, Pp386-400. Positio ch Centre for Spatial Information, July 2008. Teuni urnal of Geodesy, Vol. 70, No. 1-2, pp. 65-82. Y, Wang J (2007), Exploring GNSS RTK Performance Benefits with GPS and Virtual Galileo Measurements, Proceedings o s, M, (2007) GNSS, CORS and Positioning Infrastructure: Business and the Future, Presentation at FIG R Nav (2005) HandyNav RTK T ey, R. B (1999) The Integrity of GPS P, Van Dierendonck, A J (1996) Wide Area Augmentation System, in Global Positioning System: Theory and Applications, Vol II, published by American Institute of Aeronautics and A P, Enge P (2004) Global Positioning Systems, Signals, Measurements and M., B Burke, and P Misra (1997) Single-Epoch Integer Ambiguity Resolution with GPS Carrier Phase: Initia ning One consulting (2008), User Needs Analysis, Technical Report for Cooperative Resear ssen, P.J.G. (1995) The least-squares ambiguity decorrelation ad justment: a method for fast GPS integer ambiguity estimation. Jo 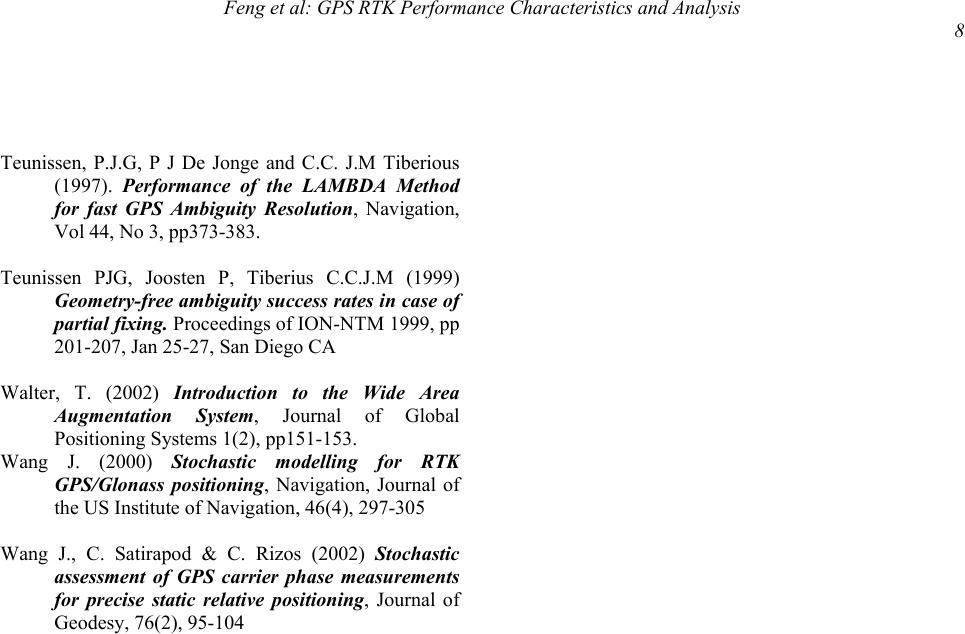 Feng et al: GPS RTK Performance Characteristics and Analysis 8 Teuni esolution, Navigation, Vol 44, No 3, pp373-383. Teuni TM 1999, pp 201-207, Jan 25-27, San Diego CA Walte f Global Wang f the US Institute of Navigation, 46(4), 297-305 Wang e positioning, Journal of Geodesy, 76(2), 95-104 ssen, P.J.G, P J De Jonge and C.C. J.M Tiberious (1997). Performance of the LAMBDA Method for fast GPS Ambiguity R ssen PJG, Joosten P, Tiberius C.C.J.M (1999) Geometry-free ambiguity success rates in case of partial fixing. Proceedings of ION-N r, T. (2002) Introduction to the Wide Area Augmentation System, Journal o Positioning Systems 1(2), pp151-153. J. (2000) Stochastic modelling for RTK GPS/Glonass positioning, Navigation, Journal o J., C. Satirapod & C. Rizos (2002) Stochastic assessment of GPS carrier phase measurements for precise static relativ
|