 Advances in Bioscience and Biotechnology, 2013, 4, 1-10 ABB http://dx.doi.org/10.4236/abb.2013.49A001 Published Online September 2013 (http://www.scirp.org/journal/abb/) Glycemic responses to glycemia-targeted specialized-nutrition beverages with varying carbohydrates compared to a standard nutritional beverage in adults with type 2 diabetes* Amy A. Devitt#, Jennifer A. Williams, Yong S. Choe, Deborah S. Hustead, Vikkie A. Mustad Abbott Nutrition, Abbott Laboratories, Columbus, USA Email: #amy.devitt-maicher@abbott.com Received 11 July 2013; revised 12 August 2013; accepted 1 September 2013 Copyright © 2013 Amy A. Devitt et al. This is an open access article distributed under the Creative Commons Attribution License, which permits unrestricted use, distribution, and reproduction in any medium, provided the original work is properly cited. ABSTRACT Background: Postprandial plasma glucose concentra- tion is an important diabetes management target. Glycemia-targeted specialized-nutrition (GTSN) bev- erages, containing various quantities and types of carbohydrates (CHO), have been formulated to blunt postprandial hyperglycemia. The objective of this research was to evaluate the effectiveness of these products on postprandial glycemic and hormonal responses based on comparisons of GTSN with dif- fering carbohydrate quantities or types. Methods: In two randomized, double-blind, crossover studies, par- ticipants (mean age 61 years) with type 2 diabetes consumed GTSN in a meal tolerance test. In the CHO Quantity Study, a standard nutritional beverage (STD) was compared to a low carbohydrate nutri- tional beverage with tapioca dextrin (GTSN-TDX) and a balanced carbohydrate nutritional beverage containing a blend of the slowly-digesting carbohy- drates maltodextrin and sucromalt (GTSN-SDC). In the CHO Type Study, the GTSN beverages had simi- lar carbohydrate quantities but varied in carbohy- drate composition with GTSN-SDC compared to a formula with tapioca starch and fructose (GTSN- TS&F), and one with isomaltulose and resistant starch (GTSN-I&RS). Postprandial (0 - 240 min) concentrations of blood glucose, insulin (CHO Quan- tity Study only) and glucagon-like-peptide (GLP)-1 (CHO Quantity Study only) were measured. Results: Despite having substantially different carbohydrate quantities, the GTSN blunted the glucose positive area under the curve (AUC0 - 240 min) by 65% to 82% compared to the STD formulation (p < 0.001). GTSN also elicited ~50% lower insulin positive AUC0 - 240 min (p < 0.05), while postprandial GLP-1 responses were increased (p = 0.018) vs. STD. In the CHO Type Study, glucose positive AUC0 - 240 min tended to be lower for GTSN-SDC (1477 ± 460) than GTSN-TS&F (2203 ± 412 ; p = 0 .062) an d GTSN-I&RS ( 2190 ± 412; p = 0.076). No differences were observed between GTSN-TS&F and GTSN-I&RS. Conclusions: These results demonstrate the effectiveness of several GTSN products and suggest that both CHO quantity and type play important roles in postprandial glycemic response in men and women with type 2 diabetes. Furthermore, GTSN products containing slow-di- gesting carbohydrates can blunt postmeal glucose and insulin concentration despite delivering greater total grams of CHO, which provides a dietary benefit for people with diabetes. Keywords: Diabetes; Oral Nutritional Supplement; Glycemia-Targeted Specialized-Nutrition; Glucagon-Like Peptide 1; Glycemic Control; Low-Glycemic/Slowly-Digested Carbohydrates 1. INTRODUCTION In 2007, pre-diabetes and diabetes cost the United States (US) an estimated $218 billion in medical expenditures and lost productivity [1]. Higher rates of health care utili- zation among individuals with diabetes may be attributed to long-term complications including heart disease and stroke, high blood pressure, blindness, kidney disease, nervous system disease, amputations, dental disease, *Author Disclosure Statement: AAD, JAW, YSC, DSH, and VAM are employees of the sponsor company, Abbott Laboratories. Funding: Abbott Nutrition, Abbott Laboratories funded both clinical studies described herein. #Corresponding author. OPEN ACCESS  A. A. Devitt et al. / Advances in Bioscience and Biotechnology 4 (2013) 1-10 2 pregnancy complications, ketosis, and increased suscep- tibility to other illnesses [2]. Epidemiological observa- tions suggest that the risk of developing these complica- tions, particularly those related to the macro- and mi- crovasculature, in individuals with type 2 diabetes as well impaired glucose tolerance can be dramatically re- duced by improving glycemic control [3-5]. Both fasting and postprandial glucose concentrations are important targets for improving long-term outcomes [3-10]. Cur- rent guidelines for treating diabetes recommend the use of pharmacologic therapies that lower postprandial glu- cose levels as well as adjunctive diet therapy, including consumption of glycemia-targeted specialized-nutrition (GTSN) products [4,5]. The use of diabetes-specific enteral nutrition formulas is reported to be associated with improved glycemic con- trol compared with standard enteral nutrition formulas that are generally high in carbohydrate (mostly high gly- cemic sources), and low in fat and fiber [11-23]. GTSN products often utilize two distinct approaches to impart glycemic control 1) manipulation of carbohydrate quan- tity by providing less total carbohydrate (35% - 40% of energy) and/or 2) manipulation of carbohydrate type by utilization of specialized carbohydrates with differing digestion and absorption profiles. The studies described herein examined the glucose, insulin, and glucagon-like peptide 1 (GLP-1) responses to consumption of several commercially available US and non-US manufactured GTSN beverages with different quantities or types of glycemia-targeted carbohydrates, and a standard nutrition beverage, in men and women with type 2 diabetes. 2. METHODS 2.1. Study Design This paper describes the results from two separate ran- domized, double-blind, three-treatment crossover studies conducted at one clinical research site (Radiant Research, Cincinnati, OH). Where one study assessed the impact of the quantity of carbohydrate consumed (CHO Quantity Study) and the other study assessed the type of carbohy- drate consumed (CHO Type Study). The studies were conducted according to Good Clinical Practice Guide- lines, all applicable privacy regulations, Food and Drug Administration regulations, and the ethical principles that have their origin in the Declaration of Helsinki. An ex- ternal institutional review board (Schulman Associates IRB, Inc., Cincinnati, OH) approved each protocol be- fore the study began. Informed consent was obtained from all subjects prior to the initiation of any study-re- lated procedures, and subjects were informed of their right to withdraw from the study at any time. Subjects completed a screening visit and, if eligible, three treat- ment visits which were separated by 7 - 14 days. A meal tolerance test was performed at each treatment visit. 2.2. Subjects Both studies recruited men and women between 18 and 75 years of age, inclusive, who stated that they had type 2 diabetes [as evidenced by the use of oral hypoglycemic medication(s) for at least two months prior to screening], and who had a body mass index 18.5 kg/m2 and ≤ 35 kg/m2. Women of childbearing potential who were not pregnant or lactating, and who were at least six weeks postpartum prior to the screening visit, could enroll if they were practicing an acceptable method of birth con- trol. Individuals with type 1diabetes were excluded from participation as were those using exogenous insulin or exenitide, and anyone with a history of diabetic ketoaci- dosis, congestive heart failure, severe gastroparesis, renal disease, end-stage organ failure, or who had received an organ transplant. The occurrence of a significant cardio- vascular event, such as myocardial infarction or stroke, less than six months prior to screening was also exclu- sionary, as was having an active malignancy (excluding basal and squamous cell carcinomas and carcinoma in-situ of the cervix), clotting or bleeding disorder, he- patic disease, or a chronic contagious infectious disease (such as tuberculosis, hepatitis B or C, or HIV). Subjects with a current infection requiring medication or hospi- talization, or who had undergone surgery or received sys- temic corticosteroid treatment in the past three months, or antibiotics in the past three weeks, were not enrolled. With the exception of oral hypoglycemic medication(s) and stable-dose (for at least two months prior to screen- ing) antihypertensive, lipid-lowering, thyroid, or hor- mone therapy, all other medications and herbal and die- tary supplements that could profoundly affect blood glu- cose, were disallowed. 2.3. Test Products To assess the impact of the quantity of carbohydrate (CHO Quantity Study), eligible participants were ran- domly assigned in a double-blind, crossover manner, to receive a single serving of either 1) a standard nutri- tional beverage [STD; Ensure®, Abbott Nutrition, Co- lumbus, OH], 2) a GTSN beverage with tapioca dextrin [GTSN-TDX; Boost Glucose Control®, Nestlé Health- Care Nutrition, Ontario, Canada], or 3) a GTSN bever- age with a proprietary blend of slow-digesting carbohy- drates including resistant maltodextrin and sucromalt [GTSN-SDC; Glucerna SR®, Abbott Nutrition] (Table 1). Assessment of the impact of the type of carbohydrate (CHO Type Study) was done by randomly assigning eli- gible participants in a double-blind, crossover manner, to receive a single serving of either 1) the same slow-di- gesting carbohydrate GTSN beverage administered in the Copyright © 2013 SciRes. OPEN ACCESS 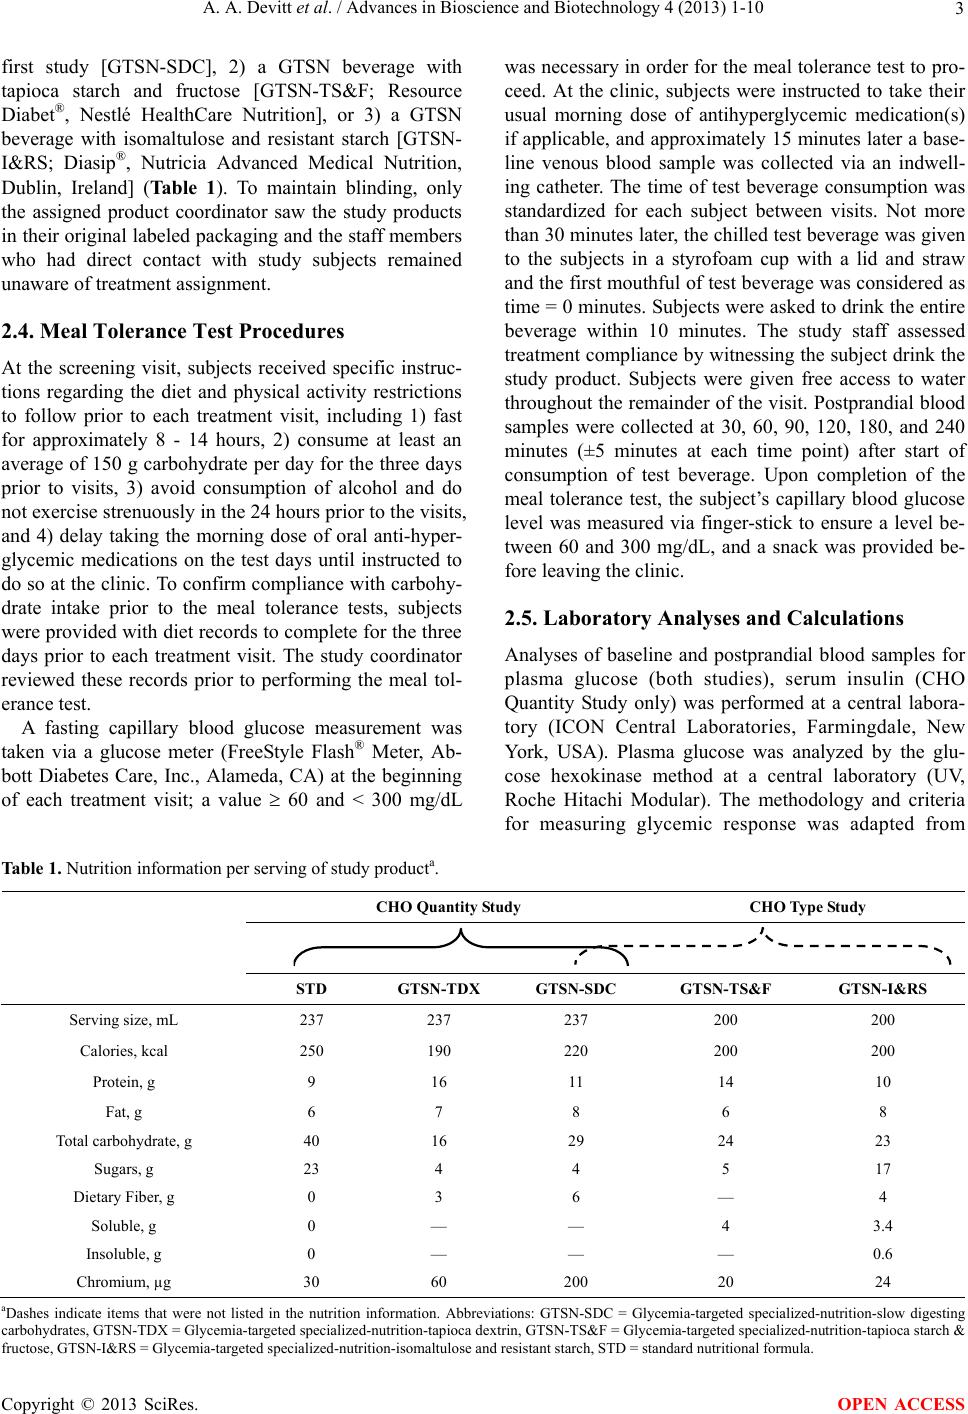 A. A. Devitt et al. / Advances in Bioscience and Biotechnology 4 (2013) 1-10 Copyright © 2013 SciRes. 3 first study [GTSN-SDC], 2) a GTSN beverage with tapioca starch and fructose [GTSN-TS&F; Resource Diabet®, Nestlé HealthCare Nutrition], or 3) a GTSN beverage with isomaltulose and resistant starch [GTSN- I&RS; Diasip®, Nutricia Advanced Medical Nutrition, Dublin, Ireland] (Table 1). To maintain blinding, only the assigned product coordinator saw the study products in their original labeled packaging and the staff members who had direct contact with study subjects remained unaware of treatment assignment. was necessary in order for the meal tolerance test to pro- ceed. At the clinic, subjects were instructed to take their usual morning dose of antihyperglycemic medication(s) if applicable, and approximately 15 minutes later a base- line venous blood sample was collected via an indwell- ing catheter. The time of test beverage consumption was standardized for each subject between visits. Not more than 30 minutes later, the chilled test beverage was given to the subjects in a styrofoam cup with a lid and straw and the first mouthful of test beverage was considered as time = 0 minutes. Subjects were asked to drink the entire beverage within 10 minutes. The study staff assessed treatment compliance by witnessing the subject drink the study product. Subjects were given free access to water throughout the remainder of the visit. Postprandial blood samples were collected at 30, 60, 90, 120, 180, and 240 minutes (±5 minutes at each time point) after start of consumption of test beverage. Upon completion of the meal tolerance test, the subject’s capillary blood glucose level was measured via finger-stick to ensure a level be- tween 60 and 300 mg/dL, and a snack was provided be- fore leaving the clinic. 2.4. Meal Tolerance Test Procedures At the screening visit, subjects received specific instruc- tions regarding the diet and physical activity restrictions to follow prior to each treatment visit, including 1) fast for approximately 8 - 14 hours, 2) consume at least an average of 150 g carbohydrate per day for the three days prior to visits, 3) avoid consumption of alcohol and do not exercise strenuously in the 24 hours prior to the visits, and 4) delay taking the morning dose of oral anti-hyper- glycemic medications on the test days until instructed to do so at the clinic. To confirm compliance with carbohy- drate intake prior to the meal tolerance tests, subjects were provided with diet records to complete for the three days prior to each treatment visit. The study coordinator reviewed these records prior to performing the meal tol- erance test. 2.5. Laboratory Analyses and Calculations Analyses of baseline and postprandial blood samples for plasma glucose (both studies), serum insulin (CHO Quantity Study only) was performed at a central labora- tory (ICON Central Laboratories, Farmingdale, New York, USA). Plasma glucose was analyzed by the glu- cose hexokinase method at a central laboratory (UV, Roche Hitachi Modular). The methodology and criteria for measuring glycemic response was adapted from A fasting capillary blood glucose measurement was taken via a glucose meter (FreeStyle Flash® Meter, Ab- bott Diabetes Care, Inc., Alameda, CA) at the beginning of each treatment visit; a value 60 and < 300 mg/dL Table 1. Nutrition information per serving of study producta. CHO Quantity Study CHO Type St udy STD GTSN-TDX GTSN-SDC GTSN-TS&F GTSN-I&RS Serving size, mL 237 237 237 200 200 Calories, kcal 250 190 220 200 200 Protein, g 9 16 11 14 10 Fat, g 6 7 8 6 8 Total carbohydrate, g 40 16 29 24 23 Sugars, g 23 4 4 5 17 Dietary Fiber, g 0 3 6 — 4 Soluble, g 0 — — 4 3.4 Insoluble, g 0 — — — 0.6 Chromium, µg 30 60 200 20 24 aDashes indicate items that were not listed in the nutrition information. Abbreviations: GTSN-SDC = Glycemia-targeted specialized-nutrition-slow digesting carbohydrates, GTSN-TDX = Glycemia-targeted specialized-nutrition-tapioca dextrin, GTSN-TS&F = Glycemia-targeted specialized-nutrition-tapioca starch & fructose, GTSN-I&RS = Glycemia-targeted specialized-nutrition-isomaltulose and resistant starch, STD = standard nutritional formula. OPEN ACCESS 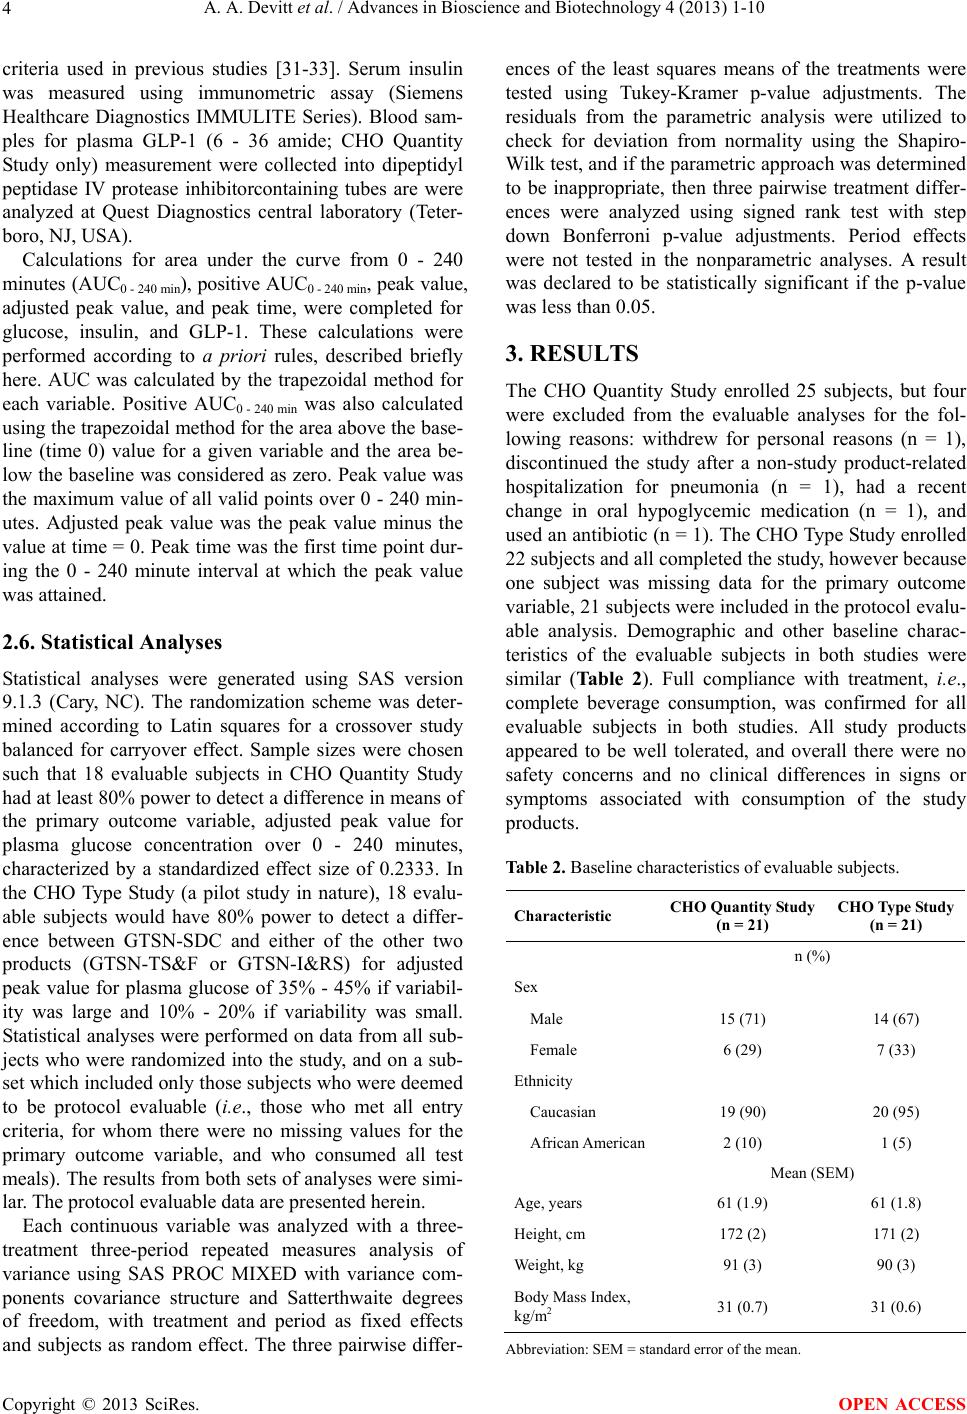 A. A. Devitt et al. / Advances in Bioscience and Biotechnology 4 (2013) 1-10 4 criteria used in previous studies [31-33]. Serum insulin was measured using immunometric assay (Siemens Healthcare Diagnostics IMMULITE Series). Blood sam- ples for plasma GLP-1 (6 - 36 amide; CHO Quantity Study only) measurement were collected into dipeptidyl peptidase IV protease inhibitorcontaining tubes are were analyzed at Quest Diagnostics central laboratory (Teter- boro, NJ, USA). Calculations for area under the curve from 0 - 240 minutes (AUC0 - 240 min), positive AUC0 - 240 min, peak value, adjusted peak value, and peak time, were completed for glucose, insulin, and GLP-1. These calculations were performed according to a priori rules, described briefly here. AUC was calculated by the trapezoidal method for each variable. Positive AUC0 - 240 min was also calculated using the trapezoidal method for the area above the base- line (time 0) value for a given variable and the area be- low the baseline was considered as zero. Peak value was the maximum value of all valid points over 0 - 240 min- utes. Adjusted peak value was the peak value minus the value at time = 0. Peak time was the first time point dur- ing the 0 - 240 minute interval at which the peak value was attained. 2.6. Statistical Analyses Statistical analyses were generated using SAS version 9.1.3 (Cary, NC). The randomization scheme was deter- mined according to Latin squares for a crossover study balanced for carryover effect. Sample sizes were chosen such that 18 evaluable subjects in CHO Quantity Study had at least 80% power to detect a difference in means of the primary outcome variable, adjusted peak value for plasma glucose concentration over 0 - 240 minutes, characterized by a standardized effect size of 0.2333. In the CHO Type Study (a pilot study in nature), 18 evalu- able subjects would have 80% power to detect a differ- ence between GTSN-SDC and either of the other two products (GTSN-TS&F or GTSN-I&RS) for adjusted peak value for plasma glucose of 35% - 45% if variabil- ity was large and 10% - 20% if variability was small. Statistical analyses were performed on data from all sub- jects who were randomized into the study, and on a sub- set which included only those subjects who were deemed to be protocol evaluable (i.e., those who met all entry criteria, for whom there were no missing values for the primary outcome variable, and who consumed all test meals). The results from both sets of analyses were simi- lar. The protocol evaluable data are presented herein. Each continuous variable was analyzed with a three- treatment three-period repeated measures analysis of variance using SAS PROC MIXED with variance com- ponents covariance structure and Satterthwaite degrees of freedom, with treatment and period as fixed effects and subjects as random effect. The three pairwise differ- ences of the least squares means of the treatments were tested using Tukey-Kramer p-value adjustments. The residuals from the parametric analysis were utilized to check for deviation from normality using the Shapiro- Wilk test, and if the parametric approach was determined to be inappropriate, then three pairwise treatment differ- ences were analyzed using signed rank test with step down Bonferroni p-value adjustments. Period effects were not tested in the nonparametric analyses. A result was declared to be statistically significant if the p-value was less than 0.05. 3. RESULTS The CHO Quantity Study enrolled 25 subjects, but four were excluded from the evaluable analyses for the fol- lowing reasons: withdrew for personal reasons (n = 1), discontinued the study after a non-study product-related hospitalization for pneumonia (n = 1), had a recent change in oral hypoglycemic medication (n = 1), and used an antibiotic (n = 1). The CHO Type Study enrolled 22 subjects and all completed the study, however because one subject was missing data for the primary outcome variable, 21 subjects were included in the protocol evalu- able analysis. Demographic and other baseline charac- teristics of the evaluable subjects in both studies were similar (Table 2). Full compliance with treatment, i.e., complete beverage consumption, was confirmed for all evaluable subjects in both studies. All study products appeared to be well tolerated, and overall there were no safety concerns and no clinical differences in signs or symptoms associated with consumption of the study products. Table 2. Baseline characteristics of evaluable subjects. Characteristic CHO Quantity Study (n = 21) CHO Ty pe Study (n = 21) n (%) Sex Male 15 (71) 14 (67) Female 6 (29) 7 (33) Ethnicity Caucasian 19 (90) 20 (95) African American2 (10) 1 (5) Mean (SEM) Age, years 61 (1.9) 61 (1.8) Height, cm 172 (2) 171 (2) Weight, kg 91 (3) 90 (3) Body Mass Index, kg/m2 31 (0.7) 31 (0.6) Abbreviation: SEM = standard error of the mean. Copyright © 2013 SciRes. OPEN ACCESS 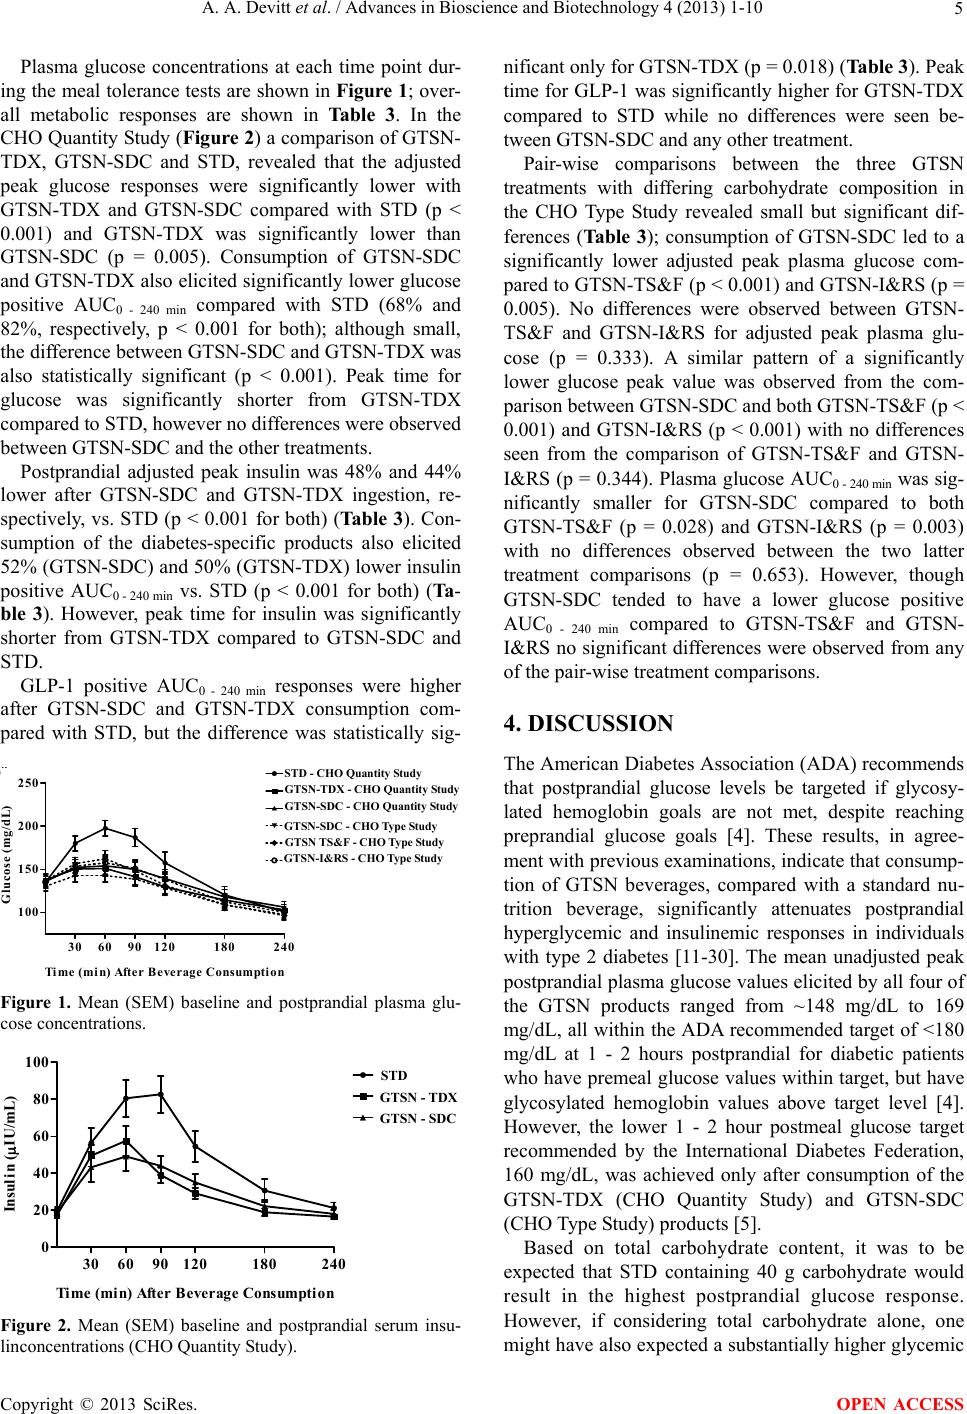 A. A. Devitt et al. / Advances in Bioscience and Biotechnology 4 (2013) 1-10 5 Plasma glucose concentrations at each time point dur- ing the meal tolerance tests are shown in Figure 1; over- all metabolic responses are shown in Table 3. In the CHO Quantity Study (Figure 2) a comparison of GTSN- TDX, GTSN-SDC and STD, revealed that the adjusted peak glucose responses were significantly lower with GTSN-TDX and GTSN-SDC compared with STD (p < 0.001) and GTSN-TDX was significantly lower than GTSN-SDC (p = 0.005). Consumption of GTSN-SDC and GTSN-TDX also elicited significantly lower glucose positive AUC0 - 240 min compared with STD (68% and 82%, respectively, p < 0.001 for both); although small, the difference between GTSN-SDC and GTSN-TDX was also statistically significant (p < 0.001). Peak time for glucose was significantly shorter from GTSN-TDX compared to STD, however no differences were observed between GTSN-SDC and the other treatments. Postprandial adjusted peak insulin was 48% and 44% lower after GTSN-SDC and GTSN-TDX ingestion, re- spectively, vs. STD (p < 0.001 for both) (Ta ble 3). Con- sumption of the diabetes-specific products also elicited 52% (GTSN-SDC) and 50% (GTSN-TDX) lower insulin positive AUC0 - 240 min vs. STD (p < 0.001 for both) (Ta- ble 3). However, peak time for insulin was significantly shorter from GTSN-TDX compared to GTSN-SDC and STD. GLP-1 positive AUC0 - 240 min responses were higher after GTSN-SDC and GTSN-TDX consumption com- pared with STD, but the difference was statistically sig- Time (min) After Beverage Consumption Glu cose (mg/dL) 100 150 200 250 STD DSN-TDX DSN-SDC - Stu dy 1 DSN-SDC - Stu dy 2 DSN-TS&F DSN-I&RS 306090120 180 240 GTSN-I&RS - CHO T ype S tudy GTSN-TDX - CHO Quantity Study GTSN TS&F - CHO Type S tudy STD - CHO Quantit Stud GTSN-SDC - CHO Quantity Study GTSN-SDC - CHO Type Study Figure 1. Mean (SEM) baseline and postprandial plasma glu- cose concentrations. Time (min) After Beverage Consumpt ion Insulin (IU/mL) 0 20 40 60 80 100 STD DSN-TDX DSN-SDC 306090120 180 240 STD GTSN - TDX GTSN - SDC Figure 2. Mean (SEM) baseline and postprandial serum insu- linconcentrations (CHO Quantity Study). nificant only for GTSN-TDX (p = 0.018) (Table 3). Peak time for GLP-1 was significantly higher for GTSN-TDX compared to STD while no differences were seen be- tween GTSN-SDC and any other treatment. Pair-wise comparisons between the three GTSN treatments with differing carbohydrate composition in the CHO Type Study revealed small but significant dif- ferences (Tab le 3 ); consumption of GTSN-SDC led to a significantly lower adjusted peak plasma glucose com- pared to GTSN-TS&F (p < 0.001) and GTSN-I&RS (p = 0.005). No differences were observed between GTSN- TS&F and GTSN-I&RS for adjusted peak plasma glu- cose (p = 0.333). A similar pattern of a significantly lower glucose peak value was observed from the com- parison between GTSN-SDC and both GTSN-TS&F (p < 0.001) and GTSN-I&RS (p < 0.001) with no differences seen from the comparison of GTSN-TS&F and GTSN- I&RS (p = 0.344). Plasma glucose AUC0 - 240 min was sig- nificantly smaller for GTSN-SDC compared to both GTSN-TS&F (p = 0.028) and GTSN-I&RS (p = 0.003) with no differences observed between the two latter treatment comparisons (p = 0.653). However, though GTSN-SDC tended to have a lower glucose positive AUC0 - 240 min compared to GTSN-TS&F and GTSN- I&RS no significant differences were observed from any of the pair-wise treatment comparisons. 4. DISCUSSION The American Diabetes Association (ADA) recommends that postprandial glucose levels be targeted if glycosy- lated hemoglobin goals are not met, despite reaching preprandial glucose goals [4]. These results, in agree- ment with previous examinations, indicate that consump- tion of GTSN beverages, compared with a standard nu- trition beverage, significantly attenuates postprandial hyperglycemic and insulinemic responses in individuals with type 2 diabetes [11-30]. The mean unadjusted peak postprandial plasma glucose values elicited by all four of the GTSN products ranged from ~148 mg/dL to 169 mg/dL, all within the ADA recommended target of <180 mg/dL at 1 - 2 hours postprandial for diabetic patients who have premeal glucose values within target, but have glycosylated hemoglobin values above target level [4]. However, the lower 1 - 2 hour postmeal glucose target recommended by the International Diabetes Federation, 160 mg/dL, was achieved only after consumption of the GTSN-TDX (CHO Quantity Study) and GTSN-SDC (CHO Type Study) products [5]. Based on total carbohydrate content, it was to be expected that STD containing 40 g carbohydrate would result in the highest postprandial glucose response. However, if considering total carbohydrate alone, one ight have also expected a substantially higher glycemic m Copyright © 2013 SciRes. OPEN ACCESS  A. A. Devitt et al. / Advances in Bioscience and Biotechnology 4 (2013) 1-10 Copyright © 2013 SciRes. 6 OPEN ACCESS Table 3. Glucose, insulin, and glucagon-like peptide-1 responses to meal tolerance tests1. CHO Quantity Study2 (n = 21) CHO Type St udy3 (n = 21) STD GTSN-TDXGTSN-SDC GTSN-SDC GTSN-TS&F GTSN-I&RS Mean (SEM) Plasma Glucose AUC0 - 240 min 36309 (2134)NA 31136 (1827)NA 32294 (2161)NA 29924 (1593)x31413 (1749)y 31851 (1743)y Positive AUC0 - 240 min 6266 (747)a 1144(252)b 2000(339)c 1477(460) 2203(412) 2190(412) Unadjusted Peak, mg/dL 206.6 (9.2)NA 156.1 (8.6)NA 162.1 (9.4)NA 148.3 (7.5)x 169.3 (8.7)y 164.0 (8.5)y Adjusted Peak, mg/dL 71.7 (5.8)a 18.4 (2.5)b 25.9 (2.7)b 17.9 (3.4)x 32.8 (4.1)y 28.6 (3.7)y Peak time, min 70.0 (5.2)a 48.6 (3.9)b 58.6 (5.3)ab 60.0 (5.9) 52.9 (4.6) 58.6 (4.8) Serum Insulin AUC0 - 240 min 11764 (1313)NA 7632 (697)NA 7848 (865)NA DNC DNC DNC Positive AUC0 - 240 min 7286 (930)a 3635 (492)b 3488 (602)b DNC DNC DNC Unadjusted Peak, µIU/mL 96.6 (11.3)NA 60.1 (7.8)NA 58.8 (9.1)NA DNC DNC DNC Adjusted Peak, µIU/mL 77.0 (9.9)a 42.8 (7.2)b 40.1 (8.4)b DNC DNC DNC Peak time, min 75.0 (5.1)a 52.5 (4.3)b 74.3 (7.1)a DNC DNC DNC Plasma GLP-1 AUC0 - 240 min 3967 (512)NA 5085 (532)NA 5435 (689)NA DNC DNC DNC Positive AUC0 - 240 min 1367 (213)a 2580 (322)b 2075 (372)ab DNC DNC DNC Unadjusted Peak, pmol/L 28.1 (3.4)NA 34.2 (3.5)NA 37.2 (5.4)NA DNC DNC DNC Adjusted Peak, pmol/L 16.6 (2.5) 23.5 (2.9) 21.8 (3.7) DNC DNC DNC Peak time, min 52.1 (8.5)a 97.9 (14.8)b 72.6 (9.3)ab DNC DNC DNC 1Abbreviations: GTSN-IR&S = Glycemia-targeted specialized-nutrition-isomaltulose, GTSN-SDC = Glycemia-targeted specialized-nutrition-slow digesting carbohydrates, GTSN-TDX = Glycemia-targeted specialized-nutrition-tapioca dextrin, GTSN-TS&F = Glycemia-targeted specialized-nutrition-tapioca starch & fructose, GLP-1 = glucagon-like peptide-1, SEM = standard error of the mean, STD = standard nutritional formula, DNC = data not collected. 2In the CHO Quantity Study, significant differences between treatments are denoted by differing superscripts (a,b,c; when p < 0.05), NA = Not Analyzed. 3In the CHO Type Study, significant differences between treatments are denoted by differing superscripts (x,y; when p < 0.05). response for GTSN-SDC, containing 29 g total carbohy- drate, compared with the other GTSN, containing lower carbohydrate levels (16 - 23 g). These results point to the importance of not only the quantity of carbohydrate, but also its type on the resulting glycemic response [15,34- 40]. The differences in postprandial glycemic responses among the GTSN beverages assessed in the CHO Type Study were a result of the carbohydrate sources in each formula. GTSN-SDC contained a blend of low glycemic index, slowly digestible carbohydrates including sucro- malt (a natural analog of sucrose) [41]. and a form of maltodextrin that is resistant to amylase digestion in the small intestine [42]. Isomaltulose, found in the GTSN- I&RS beverage, is another low-glycemic index, slowly digestible carbohydrate [43-47] which has a hydrolyza- tion rate of 20% - 25% that of sucrose [48]. The GTSN- TS&F product contained added fructose which has a very low-glycemic index and is often recommended, in limited quantities, in diabetes because it does not stimu- late pancreatic beta-cell insulin secretion, and aids in glucose clearance through the liver [49]. In the present head-to-head comparison, ingestion of GTSN-SDC was superior to both GTSN-I&RS and GTSN-TS&F for blunting postprandial hyperglycemia. In addition to the various carbohydrate blends in the nutritional beverages examined in these studies, differ- ences in caloric density and other nutrients may have also contributed to the postprandial glycemic responses. Per serving, STD provided the greatest number of calories (250 kcal) followed by GTSN-SDC (220 kcal), GTSN-TS&F and GTSN-I&RS (both 200 kcal), and GTSN-TDX (190 kcal). The quantity and type of protein ingested may also have some effect on postprandial hyperglycemia [50-52]. As the addition of protein to an oral glucose load has been shown to slow gastric empty- ing [52]. Proteins also enhance insulin secretion [53,54]. The STD beverage contained the least amount of protein (9 g/serving), and the GTSN-TDX beverage contained the largest amount (16 g/serving). Dietary fiber also plays an important role in postprandial glycemic response [55,56]. Consumption of some dietary fibers (mainly viscous, soluble fibers) can diminish postprandial glucose excur- sions by their effects on intestinal motility and gastro- intestinal hormones and enzymes [56]. The STD bever- age provided no dietary fiber; and, among the diabetes-  A. A. Devitt et al. / Advances in Bioscience and Biotechnology 4 (2013) 1-10 7 specific beverages, GTSN-SDC contained the greatest amount of dietary fiber (6 g soluble fiber/serving) com- pared with GTSN-TDX (3 g dietary fiber/serving, type not specified on the label), GTSN-TS&F (4 g soluble fiber/serving), and GTSN-I&RS (3.4 soluble and 0.6 insoluble fiber/serving). As shown previously [21], postprandial GLP-1, an in- cretin hormone that is released from gut endocrine cells during meals, and induces glucose-dependent stimulation of insulin secretion, while suppressing glucagon secre- tion, [57,58] responded in the opposite direction to post- prandial insulin. Postive AUC0 - 240 min for GLP-1 was increased after ingestion of GTSN-SDC but only signifi- cantly after consumption of GTSN-TDX, vs. STD, de- spite this difference postprandial insulin was signifi- cantly lower from both GTSN-SDC and GTSN-TDX compared to STD. This suggests that the GLP-1 positive AUC from GTSN-TDX wasn’t sufficient to elicit meta- bolic changes beyondGTSN-SDC. The exact mechanism for the effects of GLP-1 on glucose control remains to be determined [21]. Nevertheless, incretin-based therapies, such as GLP-1 agonists and dipeptidyl peptidase-4 in- hibitors that slow the removal of GLP-1 from the circu- lation, are becoming more widely used in the treatment of diabetes [59]. Although the study design of administering a single bolus of each beverage on separate days is typical for assessing postmeal glucose and insulin responses, it does not allow application of these findings to what might occur with long-term consumption. More studies exam- ining the impact of GTSN formulations on long-term glycemic control, as well as their effects on body weight, are needed. There is relatively large variability in glucose responses within (day-to-day) and among individual pa- tients consuming enteral feeding products [11]. Although variability was minimized by the use of a crossover study design, inter-subject variability might explain the difference between the two studies in the glycemic re- sponses to GTSN-SDC ingestion. Another potential limitation on the interpretation of these findings was the fact that STD was not examined in the second study. However, standard nutrition beverages have previously, and consistently, been shown to result in higher post- prandial glucose than diabetes-specific products [11-23]. so the side-by-side comparison of responses to STD consumption in the CHO Quantity Study with the re- sponses to ingestion of diabetes-specific beverages in the CHO Type Study, was not unreasonable. 5. CONCLUSION These results confirm the efficacy of GTSN products, compared with a standard nutritional beverage, for at- tenuating postprandial hyperglycemia in men and women with type 2 diabetes, and further demonstrate the impor- tance of carbohydrate amount and type on this effect. Among the GTSN products, the beverage containing a mixture of slowly-digestible carbohydrates including sucromalt and resistant maltodextrin was superior as it elicited glycemic control without reducing the quantity of carbohydrate consumed. Reducing postprandial blood glucose excursions by the use of GTSN is important for overall glycemic control, and would be expected to im- prove clinical outcomes in diabetic patients [3]. REFERENCES [1] Dall, T.M., Zhang, Y., Chen, Y.J., Quick, W.W., Yang, W.G. and Fogli, J. (2010) The economic burden of dia- betes. Health Affairs, 29, 297-303. doi:10.1377/hlthaff.2009.0155 [2] American Diabetes Association: National Diabetes Fact Sheet, 2005. http://www.cdc.gov/diabetes/pubs/factsheet05.htm [3] Heine, R.J. and Dekker, J.M. (2002) Beyond postprandial hyperglycemia: metabolic factors associated with cardio- vascular disease. Diabetologia, 45, 461-475. doi:10.1007/s00125-001-0726-0 [4] American Diabetes Association (2011) Standards of Me- dical Care in Diabetes—2011. Diabetes Care, 34, S11- S61. doi:10.2337/dc11-S011 [5] International Diabetes Federation: 2011 Guideline for management of postmeal glucose in diabetes. http://www.idf.org/sites/default/files/postmeal%20glucos e%20guidelines.pdf [6] Abrahamson, M.J. (2004) Optimal glycemic control in type 2 diabetes mellitus: fasting and postprandial glucose in context. Archives of Internal Medicine, 164, 486-491. doi:10.1001/archinte.164.5.486 [7] Ceriello, A. (2000) The post-prandial state and cardio- vascular disease: Relevance to diabetes mellitus. Diabe- tes/Metabolism Research and Reviews, 16, 125-132. doi:10.1002/(SICI)1520-7560(200003/04)16:2<125::AID -DMRR90>3.0.CO;2-4 [8] Ceriello, A. (2003) The possible role of postprandial hy- perglycaemia in the pathogenesis of diabetic complica- tions. Diabetologia, 46, M9-M16. [9] Ceriello, A. (2005) Postprandial hyperglycemia and dia- betes complications: Is it time to treat? Diabetes, 54, 1-7. doi:10.2337/diabetes.54.1.1 [10] Woerle, H.J., Neumann, C., Zschau, S., Tenner, S., Irsi- gler, A., Schirra, J., Gerich, J.E. and Göke, B. (2007) Impact of fasting and postprandial glycemia on overall glycemic control in type 2 diabetes. Importance of post- prandial glycemia to achieve target HbA1c levels. Dia- betes Resea rch and Clinical Practice, 77, 280-285. doi:10.1016/j.diabres.2006.11.011 [11] Peters, A.L. and Davidson, M.B. (1992) Effects of vari- ous enteral feeding products on postprandial blood glu- cose response in patients with type I diabetes. Journal of Parenteral and Enteral Nutrition, 16, 69-74. doi:10.1177/014860719201600169 Copyright © 2013 SciRes. OPEN ACCESS  A. A. Devitt et al. / Advances in Bioscience and Biotechnology 4 (2013) 1-10 8 [12] MacCargar, L.J., Innis, S.M., Bowron, E., Leichter, J., Dawson, K., Toth, E. and Wall, K. (1998) Effect of en- teral nutritional products differing in carbohydrate and fat on indices of carbohydrate and lipid metabolism in pa- tients with NIDDM. Molecular and Cellular Biochemis- try, 188, 81-89. doi:10.1023/A:1006872506658 [13] Sanz-Paris, A., Calvo, L., Guallard, A., Salazar, I. and Albero, R. (1998) High-fat versus high-carbohydrate en- teral formulae: effect on blood glucose, C-peptide and ketones in patients with type 2 diabetes treated with insu- lin or sulfonylurea. Nutrition, 14, 840-845. doi:10.1016/S0899-9007(98)00124-5 [14] del Carmen Crespillo, M., Olivera, G., de Adana, M.S., Rojo-Martínez, G., Garcia-Aleman, J., Olivera, P., Sori- guer, F. and Muñoz, A. (2003) Metabolic effects of an enteral nutrition formula for diabetes: Comparison with standard formulas in patients with type 1 diabetes. Clini- cal Nutrition, 22, 483-487. doi:10.1016/S0261-5614(03)00047-5 [15] Hofman, Z., van Drunen, J.D.E., de Later, C. and Kuipers, H. (2004) The effect of different nutritional feeds on the postprandial glucose response in healthy volunteers and patients with type II diabetes. European Journal of Clinical Nutrition, 58, 1553-1556. doi:10.1038/sj.ejcn.1602007 [16] Elia, M., Ceriello, A., Laube, H., Sinclair, A.J., Engfer, M. and Stratton, R.J. (2005) Enteral nutritional support and use of diabetes-specific formulas for patients with diabe- tes: A systematic review and meta-analysis. Diabetes Care, 28, 2267-2279. doi:10.2337/diacare.28.9.2267 [17] León-Sanz, M., García-Luna, P.P., Planas, M., Sanz-París, A., Gómez-Candela, C. and Casimiro, C. (2005) Glyce- mic and lipid control in hospitalized type 2 diabetic pa- tients: Evaluation of 2 enteral nutrition formulas (low carbohydrate-high monounsaturated fat vs. high carbohy- drate). Journal of Parenteral and Enteral Nutrition, 29, 21-29. doi:10.1177/014860710502900121 [18] González-Ortiz, M., Martínez-Abundis, E., Hernández- Salazar, E., Kam-Ramos, A.M. and Robles-Cervantes, J.A. (2006) Effect of a nutritional liquid supplement de- signed for the patient with diabetes mellitus (Glucerna SR) on the postprandial glucose state, insulin secretion and insulin sensitivity in healthy subjects. Diabetes, Obesity and Metabolism, 8, 331-335. [19] González-Ortiz, M., Ramos-Zavala, M.G., González-Ló- pez, R.C., Robles-Cervantes, J.A. and Martinez-Abun- dis, E. (2009) Effect of 2 liquid nutritional supplements for diabetes patients on postprandial glucose, insulin se- cretion and insulin sensitivity in healthy individuals. Journal of Parenteral and Enteral Nutrition, 33, 67-70. doi:10.1177/0148607108327048 [20] Li, Y.X., Zeng, J.B., Yu, K., Sun, Q., Liu, Q.Y., Qin, W., Zhang, Q., Yu, J.C. and Wang, H. (2008) Beneficial ef- fects of a diabetes specific formula on insulin sensitivity and free fatty acid in patients with type 2 diabetes melli- tus. Chinese Medical Journal, 121, 691-695. [21] Voss, A.C., Maki, K.C., Garvey, W.T., Hustead, D.S., Alish, C., Fix, B. and Mustad, V.A. (2008) Effect of two carbohydrate-modified tube-feeding formulas on meta- bolic responses in patients with type 2 diabetes. Nutrition, 24, 990-997. doi:10.1016/j.nut.2008.06.009 [22] Pohl, M., Mayr, P., Mertl-Roetzer, M., Lauster, F., Hasl- beck, M., Hipper, B., Steube, D., Tietjen, M., Eriksen, J. and Rahlfs, V.W. (2009) Glycemic control in patients with type 2 diabetes mellitus with a disease-specific en- teral formula: Stage II of a randomized, controlled multi- center trial. Journal of Parenteral and Enteral Nutrition, 33, 37-49. doi:10.1177/0148607108324582 [23] Alish, C.J., Garvey, W.T., Maki, K.C., Sacks, G.S., Hus- tead, D.S., Hegazi, R.A. and Mustad, V.A. (2010) A dia- betes-specific enteral formula improves glycemic vari- ability in patients with type 2 diabetes. Diabetes Tech- nology & Therapeutics, 12, 419-425. [24] Craig, L.D., Nicholson, S., Silverstone, F.A. and Kenne- dy, R.D. (1998) Use of a reduced-carbohydrate, modi- fied-fat enteral formula for improving metabolic control and clinical outcomes in long-term care residents with type 2 diabetes: Results of a pilot trial. Nutrition, 14, 529-534. doi:10.1016/S0899-9007(98)00062-8 [25] Vanschoonbeek, K., Lansink, M., van Laere, K.M.J., Sen- den, J.M.G., Verdijk, L.B. and van Loon, L.J.C. (2009) Slowly digestible carbohydrate sources can be used to at- tenuate the postprandial glycemic response to the inges- tion of diabetes-specific enteral formulas. Diabetes Edu- cation, 35, 631-640. [26] Garg, G. (1998) High-monounsaturated-fat diets for pa- tients with diabetes mellitus: A meta-analysis. The Ameri- can Journal of Clinical Nutrition, 67, 577S-582S. [27] Yokoyama, J., Someya, Y., Yoshihara, R. and Ishii, H. (2008) Effects of high-monounsaturated fatty acid enteral formula versus high-carbohydrate enteral formula on pla- sma glucose concentration and insulin secretion in healthy individuals and diabetic patients. Journal of In- ternational Medical Research, 36, 137-146. doi:10.1177/147323000803600117 [28] Heine, R.J., Balkau, B., Ceriello, A., DelPrato, S., Horton, E.S. and Taskinen, M.R. (2004) What does postprandial hyperglycaemia mean? Diabetic Medicine, 21, 208-213. doi:10.1111/j.1464-5491.2004.01149.x [29] Tushuizen, M.E., Diamant, M. and Heine, R.J. (2005) Postprandial dysmetabolism and cardiovascular disease in type 2 diabetes. Postgraduate Medical Journal, 81, 1-6. doi:10.1136/pgmj.2004.020511 [30] Marsh, K., Barclay, A., Colagiuri, S. and Brand-Miller, J. (2011) Glycemic index and glycemic load of carbohy- drates in the diabetes diet. Current Diabetes Reports, 11, 120-127. doi:10.1007/s11892-010-0173-8 [31] Klimt, C.R., Prout, T.E., Bradly, R.F., Dolger, H., Fisher, G., Gastineau, C.F., Marks, H., Meinert, C.L., Schuma- cher, O.P., Cooper, G.R., Mather, A., Hainline, A. and Andres, R. (1969) Standardization of the oral glucose tolerance test: Report of the Committee on Statistics of the American Diabetes Association. Diabetes, 18, 299- 307. [32] Wolever, T.M.S., Jenkins, D.J.A., Jenkins, A.L. and Josee, R.G. (1991) The glycemic index: Methodology and clinical implications. The American Journal of Clinical Nutrition, 54, 846-854. [33] Brouns, G.,Bjorck, I., Frayn, K.N., Gibbs, A.L., Lang, V., Copyright © 2013 SciRes. OPEN ACCESS  A. A. Devitt et al. / Advances in Bioscience and Biotechnology 4 (2013) 1-10 9 Slama, G. and Wolever, T.M. (2005) Glycaemic index methodology. Nutrition Research Reviews, 18, 145-171. doi:10.1079/NRR2005100 [34] Jenkins, D.J., Wolever, T.M., Taylor, R.H., Barker, H., Fielden, H., Baldwin, J.M., Bowling, A.C., Newman, H.C., Jenkins, A.L. and Goff, D.V. (1981) Glycemic in- dex of foods: A physiological basis for carbohydrate ex- change. The American Journal of Clinical Nutrition, 34, 362-366. [35] Wolever, T., Jenkins, D., Vuksan, V., Jenkins, A.L., Buckley, G.C., Wong, G.S. and Josse, R.G. (1992) Bene- ficial effect of a low glycaemic index diet in type 2 dia- betes. Diabetic Medicine, 9, 451-458. doi:10.1111/j.1464-5491.1992.tb01816.x [36] Brand-Miller, J., Hayne, S., Petocz, P. and Colagiuri, S. (2003) Low-glycemic index diets in the management of diabetes: A meta-analysis of randomized controlled trials. Diabetes Care, 26, 2261-2267. doi:10.2337/diacare.26.8.2261 [37] Brand-Miller, J.C. (2004) Postprandialglycemia, glyce- mic index, and the prevention of type 2 diabetes. Ameri- can Journal of Clinical Nutrition, 80, 243-244. [38] Hofman, Z., van Drunen, J.D.E. and Kuipers, H. (2006) The glycemic index of standard and diabetes-specific en- teral formulas. Asia Pacific Journal of Clinical Nutrition, 15, 412-417. [39] Barclay, A.W., Petocz, P., McMillan-Price, J., Flood, V.M., Prvan, T. and Mitchell, P., et al. (2008) Glycemic index, glycemic load, and chronic disease risk—A meta- analysis of observational studies. American Journal of Clinical Nutrition, 87, 627-637. [40] Wheeler, M.L. and Pi-Sunyer, F.X. (2008) Carbohydrate issues: Type and amount. Journal of the American Die- tetic Association, 108, S34-S39. doi:10.1016/j.jada.2008.01.024 [41] Grysman, A., Carlson, T. and Wolever, T.M. (2008) Ef- fects of sucromalt on postprandial responses in human subjects. European Journal of Clinical Nutrition, 62, 1364-1371. doi:10.1038/sj.ejcn.1602890 [42] Fastinger, N.D., Karr-Lilienthal, L.K., Spears, J.K., Swanson, K.S., Zinn, K.E., Nava, G.M., Ohkuma, K., Kanahori, S., Gordon, D.T. and Fahey Jr., G.C. (2008) A novel resistant maltodextrin alters gastrointestinal toler- ance factors, fecal characteristics and fecal microbiota in healthy adult humans. Journal of the American College of Nutrition, 27, 356-366. doi:10.1080/07315724.2008.10719712 [43] Dahlqvist, A. (1964) Method for assay of intestinal dis- accharidases. Analytical Biochemistry, 7, 18-25. doi:10.1016/0003-2697(64)90115-0 [44] MacDonald, I. (1983) The bio-availability of isomaltu- lose in man and rat. Nutrition reports international, 28, 1083-1090. [45] Liao, Z.H., Li, Y.B., Yao, B., Fan, H.D., Hu, G.L. and Weng, J.P. (2001) The effect of isomaltulose on blood glucose and lipids for diabetic subjects. Diabetes, 50, A366. [46] Ceriello, A., Lansink, M., Rouws, C.H.F.C., van Laere, K.M.J. and Frost, G.S. (2009) Administration of a new diabetes-specific enteral formula results in an improved 24 h glucose profile in type 2 diabetic patients. Diabetes Research and Clinical Practice, 84, 259-266. doi:10.1016/j.diabres.2009.02.013 [47] Holub, I., Gostner, A., Theis, S., Nosek, L., Kudlich, T., Melcher, R. and Scheppach, W. (2010) Novel findings on the metabolic effects of the low glycaemic carbohydrate isomaltulose (Palatinose). British Journal of Nutrition, 103, 1730-1737. doi:10.1017/S0007114509993874 [48] Gunther, S. and Heymann, H. (1998) Di- and oligosac- charide substrate specificities and subsite binding ener- gies of pig intestinal glucoamylase-maltase. Archives of Biochemistry and Biophysics, 354, 111-116. doi:10.1006/abbi.1998.0684 [49] Basciano, H., Federico, L. and Adeli, K. (2005) Fructose, insulin resistance, and metabolic dyslipidemia. Nutrition & Metabolism, 21, 5. doi:10.1186/1743-7075-2-5 [50] Nuttall, F.Q., Mooradian, A.D., Gannon, M.C., Billington, C. and Krezowski, P. (1984) Effect of protein ingestion on the glucose and insulin response to a standardized oral glucose load. Diabetes Care, 7, 465-470. doi:10.2337/diacare.7.5.465 [51] Tessari, P., Kiwanuka, E., Cristini, M., Zaramella, M., Enslen, M., Zurlo, C. and Carci-Rodendas, C. (2007) Low versus fast proteins in the stimulation of beta-cell response and the activation of the enter-insular axis in type 2 diabetes. Diabetes/Metabolism Research and Re- views, 23, 378-385. doi:10.1002/dmrr.698 [52] Karamanlis, A., Chaikomin, R., Doran, S., Bellon, M., Bartholomeusz, F.D., Wishart, J.M., Jones, K.L., Horo- witz, M. and Rayner, C.K. (2007) Effects of protein on glycemic and incretin responses and gastrin emptying af- ter oral glucose in healthy subjects. The American Jour- nal of Clinical Nutrition, 86, 1364-1368. [53] Frid, A.H., Nilsson, M., Holst, J.J. and Bjorck, I.M. (2005) Effect of whey on blood glucose and insulin responses to composite breakfast and lunch meals in type 2 diabetic subjects. The American Journal of Clinical Nutrition, 82, 69-75. [54] Manders, R.J., Wagenmakers, A.J., Koopman, R., Zorenc, A.H., Menheere, P.P., Schaper, N.C., Saris, W.H. and van Loon, L.J. (2005) Co-ingestion of a protein hydrolysate and amino acid mixture with carbohydrate improves plasma glucose disposal in patients with type 2 diabetes. The American Journal of Clinical Nutrition, 82, 76-83. [55] Vinik, A.I. and Jenkins, D.J.A. (1988) Dietary fiber in management of diabetes. Diabetes Care, 11, 160-173. doi:10.2337/diacare.11.2.160 [56] Jenkins, A.L., Jenkins, D.J., Zdravkovic, U., Wursch, P. and Vuksan, V. (2002) Depression of the glycemic index by high levels of beta-glucan fiber in two functional foods tested in type 2 diabetes. European Journal of Clinical Nutrition, 56, 622-628. doi:10.1038/sj.ejcn.1601367 [57] Nauck, M.A. (2004) Glucagon-like peptide 1 (GLP-1) in the treatment of diabetes. Hormone and Metabolic Re- search, 36, 852-858. doi:10.1055/s-2004-826175 [58] Holst, J.J., Vilsboll, T. and Deacon, C.F. (2009) The in- Copyright © 2013 SciRes. OPEN ACCESS  A. A. Devitt et al. / Advances in Bioscience and Biotechnology 4 (2013) 1-10 Copyright © 2013 SciRes. 10 OPEN ACCESS cretin system and its role in type 2 diabetes mellitus. Mo- lecular and Cellular Endocrinology, 297, 127-136. doi:10.1016/j.mce.2008.08.012 [59] Unger, J. (2011) Clinical efficacy of GLP-1 agonists and their place in the diabetes treatment algorithm. The Jour- nal of the American Osteopathic Association, 111, eS2- eS9.
|