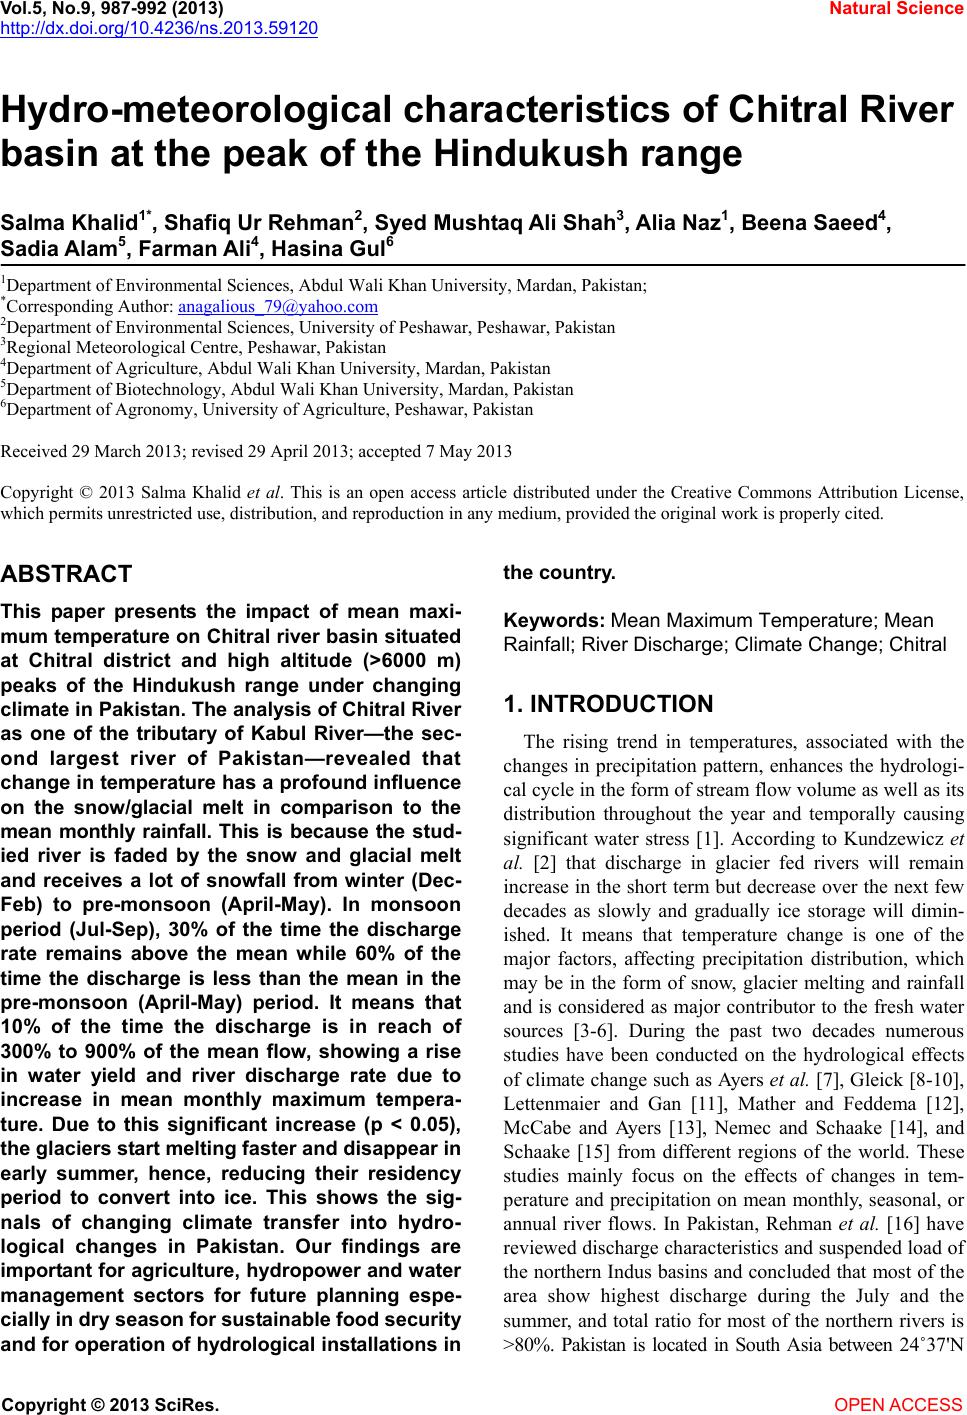
 Vol.5, No.9, 987-992 (2013) Natural Science http://dx.doi.org/10.4236/ns.2013.59120 Hydro-meteorological characteristics of Chitral River basin at the peak of the Hindukush range Salma Khalid1*, Shafiq Ur Rehman2, Syed Mushtaq Ali Shah3, Alia Naz1, Beena Saeed4, Sadia Alam5, Farman Ali4, Hasina Gul6 1Department of Environmental Sciences, Abdul Wali Khan University, Mardan, Pakistan; *Corresponding Author: anagalious_79@yahoo.com 2Department of Environmental Sciences, University of Peshawar, Peshawar, Pakistan 3Regional Meteorological Centre, Peshawar, Pakistan 4Department of Agriculture, Abdul Wali Khan University, Mardan, Pakistan 5Department of Biotechnology, Abdul Wali Khan University, Mardan, Pakistan 6Department of Agronomy, University of Agriculture, Peshawar, Pakistan Received 29 March 2013; revised 29 April 2013; accepted 7 May 2013 Copyright © 2013 Salma Khalid et al. This is an open access article distributed under the Creative Commons Attribution License, which permits unrestricted use, distribution, and reproduction in any medium, provided the original work is properly cited. ABSTRACT This paper presents the impact of mean maxi- mum temperature on Chitral river basin situated at Chitral district and high altitude (>6000 m) peaks of the Hindukush range under changing climate in Pakistan. The analysis of Chitral River as one of the tributary of Kabul River—the sec- ond largest river of Pakistan—revealed that change in temperature has a profound influence on the snow/glacial melt in comparison to the mean monthly rainfall. This is because the stud- ied river is faded by the snow and glacial melt and receives a lot of snowfall from winter (Dec- Feb) to pre-monsoon (April-May). In monsoon period (Jul-Sep), 30% of the time the discharge rate remains above the mean while 60% of the time the discharge is less than the mean in the pre-monsoon (April-May) period. It means that 10% of the time the discharge is in reach of 300% to 900% of the mean flow, showing a rise in water yield and river discharge rate due to increase in mean monthly maximum tempera- ture. Due to this significant increase (p < 0.05), the glaciers start melting faster and disappear in early summer, hence, reducing their residency period to convert into ice. This shows the sig- nals of changing climate transfer into hydro- logical changes in Pakistan. Our findings are important for agriculture, hydropow er and w ater management sectors for future planning espe- cially in dry seaso n for sustainable food security and for operation of hydrological installations in the country. Keywords: Mean Maximum Temperature; Mean Rainfall; River Discharge; Climate Change; Chitral 1. INTRODUCTION The rising trend in temperatures, associated with the changes in precipitation pattern, enhances the hydrologi- cal cycle in the form of stream flow volume as well as its distribution throughout the year and temporally causing significant water stress [1]. According to Kundzewicz et al. [2] that discharge in glacier fed rivers will remain increase in the short term but decrease over the next few decades as slowly and gradually ice storage will dimin- ished. It means that temperature change is one of the major factors, affecting precipitation distribution, which may be in the form of snow, glacier melting and rainfall and is considered as major contributor to the fresh water sources [3-6]. During the past two decades numerous studies have been conducted on the hydrological effects of climate change such as Ayers et al. [7], Gleick [8-10], Lettenmaier and Gan [11], Mather and Feddema [12], McCabe and Ayers [13], Nemec and Schaake [14], and Schaake [15] from different regions of the world. These studies mainly focus on the effects of changes in tem- perature and precipitation on mean monthly, seasonal, or annual river flows. In Pakistan, Rehman et al. [16] have reviewed discharge characteristics and suspended load of the northern Indus basins and concluded that most of the area show highest discharge during the July and the summer, and total ratio for most of the northern rivers is >80%. Pakistan is located in South Asia between 24˚37'N Copyright © 2013 SciRes. OPEN ACCESS 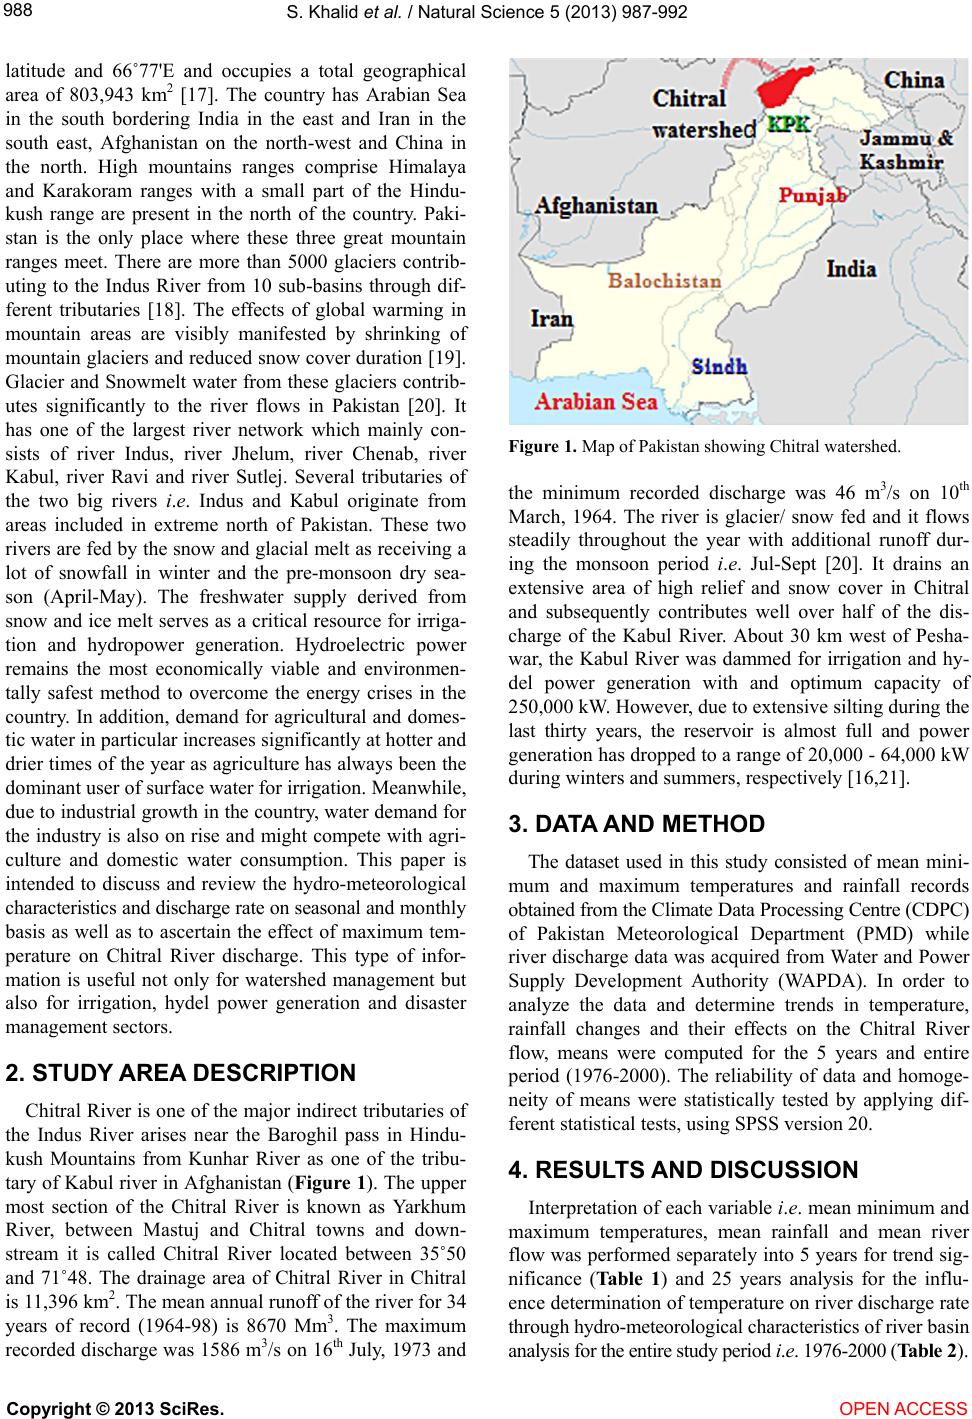 S. Khalid et al. / Natural Science 5 (2013) 987-992 988 latitude and 66˚77'E and occupies a total geographical area of 803,943 km2 [17]. The country has Arabian Sea in the south bordering India in the east and Iran in the south east, Afghanistan on the north-west and China in the north. High mountains ranges comprise Himalaya and Karakoram ranges with a small part of the Hindu- kush range are present in the north of the country. Paki- stan is the only place where these three great mountain ranges meet. There are more than 5000 glaciers contrib- uting to the Indus River from 10 sub-basins through dif- ferent tributaries [18]. The effects of global warming in mountain areas are visibly manifested by shrinking of mountain glaciers and reduced snow cover duration [19]. Glacier and Snowmelt water from these glaciers contrib- utes significantly to the river flows in Pakistan [20]. It has one of the largest river network which mainly con- sists of river Indus, river Jhelum, river Chenab, river Kabul, river Ravi and river Sutlej. Several tributaries of the two big rivers i.e. Indus and Kabul originate from areas included in extreme north of Pakistan. These two rivers are fed by the snow and glacial melt as receiving a lot of snowfall in winter and the pre-monsoon dry sea- son (April-May). The freshwater supply derived from snow and ice melt serves as a critical resource for irriga- tion and hydropower generation. Hydroelectric power remains the most economically viable and environmen- tally safest method to overcome the energy crises in the country. In addition, demand for agricultural and domes- tic water in particular increases significantly at hotter and drier times of the year as agriculture has always been the dominant user of surface water for irrigation. Meanwhile, due to industrial growth in the country, water demand for the industry is also on rise and might compete with agri- culture and domestic water consumption. This paper is intended to discuss and review the hydro-meteorological characteristics and discharge rate on seasonal and monthly basis as well as to ascertain the effect of maximum tem- perature on Chitral River discharge. This type of infor- mation is useful not only for watershed management but also for irrigation, hydel power generation and disaster management sectors. 2. STUDY AREA DESCRIPTION Chitral River is one of the major indirect tributaries of the Indus River arises near the Baroghil pass in Hindu- kush Mountains from Kunhar River as one of the tribu- tary of Kabul river in Afghanistan (Figure 1). The upper most section of the Chitral River is known as Yarkhum River, between Mastuj and Chitral towns and down- stream it is called Chitral River located between 35˚50 and 71˚48. The drainage area of Chitral River in Chitral is 11,396 km2. The mean annual runoff of the river for 34 years of record (1964-98) is 8670 Mm3. The maximum recorded discharge was 1586 m3/s on 16th July, 1973 and Figure 1. Map of Pakistan showing Chitral watershed. the minimum recorded discharge was 46 m3/s on 10th March, 1964. The river is glacier/ snow fed and it flows steadily throughout the year with additional runoff dur- ing the monsoon period i.e. Jul-Sept [20]. It drains an extensive area of high relief and snow cover in Chitral and subsequently contributes well over half of the dis- charge of the Kabul River. About 30 km west of Pesha- war, the Kabul River was dammed for irrigation and hy- del power generation with and optimum capacity of 250,000 kW. However, due to extensive silting during the last thirty years, the reservoir is almost full and power generation has dropped to a range of 20,000 - 64,000 kW during winters and summers, respectively [16,21]. 3. DATA AND METHOD The dataset used in this study consisted of mean mini- mum and maximum temperatures and rainfall records obtained from the Climate Data Processing Centre (CDPC) of Pakistan Meteorological Department (PMD) while river discharge data was acquired from Water and Power Supply Development Authority (WAPDA). In order to analyze the data and determine trends in temperature, rainfall changes and their effects on the Chitral River flow, means were computed for the 5 years and entire period (1976-2000). The reliability of data and homoge- neity of means were statistically tested by applying dif- ferent statistical tests, using SPSS version 20. 4. RESULTS AND DISCUSSION Interpretation of each variable i.e. mean minimum and maximum temperatures, mean rainfall and mean river flow was performed separately into 5 years for trend sig- nificance (Table 1 ) and 25 years analysis for the influ- ence determination of temperature on river discharge rate through hydro-meteorological characteristics of river basin analysis for the entire study period i.e. 1976-2000 (Table 2). Copyright © 2013 SciRes. OPEN ACCESS  S. Khalid et al. / Natural Science 5 (2013) 987-992 Copyright © 2013 SciRes. OPEN ACCESS 989 Table 1. Five years trend of hydro-meteorological variables. Hydro- Meteorological variables Years Mean Std. Error 95% CI for M ea n Upper Value Lower Value 1976-1980 9.0 0.1 8.6 9.4 1981-1985 8.9 0.1 8.6 9.2 1986-1990 8.4 0.2 7.9 8.9 1991-1995 9.0 0.4 8.0 9.9 Mean Minimum temperature F = 0.96, p = 0.45 1996-2000 8.8 0.3 8.0 9.6 1976-1980 23.6 0.4 22.6 24.6 1981-1985 23.1 0.3 22.2 24.0 1986-1990 23.7 0.1 23.4 24.0 1991-1995 23.0 0.3 21.9 23.7 Mean Maximum temperature F = 3.23, p = 0.03* 1996-2000 *24.2 0.3 23.3 25.0 1976-1980 26.9 3.1 18.2 35.6 1981-1985 32.8 3.7 22.6 43.0 1986-1990 44.3 3.7 34.0 54.7 1991-1995 *53.1 3.3 43.9 62.3 Mean Rainfall F = 10.53, p = 0.00* 1996-2000 42.6 1.2 39.3 45.9 Mean River discharge 1976-1980 262.0 6.8 243.3 280.7 1981-1985 267.6 15.1 225.7 309.5 F = 7.134, p = 0.00* 1986-1990 272.8 17.2 225.1 320.5 1991-1995 *295.4 10.3 266.8 324.0 1996-2000 *285.2 6.0 268.4 302.0 *Most significant p < 0.05. Table 2. Hydro-meteorological characteristics of Chitral River basin on mean monthly basis. Chitral River (766,622 m3/s water yield per annum) Months Min Temp (˚C) Max Temp (˚C) Rainfall (mm) Discharge (m3/s) Jan −0.51 9.45 47.82 77.15 Feb 0.80 10.68 57.19 68.36 Mar 3.91 14.83 117.27 66.44 Apr 8.28 22.60 70.45 90.61 May 12.12 28.31 43.28 191.34 Jun 16.92 34.14 14.61 463.97 Jul 19.99 36.02 8.39 841.90 Aug 18.48 34.56 6.49 758.03 Sep 13.10 31.73 14.14 386.19 Oct 7.16 25.29 18.35 172.03 Nov 2.59 18.94 30.40 112.77 Dec 0.23 12.53 39.36 90.27 4.1. 5 Years Trend To get a better understanding of observed trends, the annual mean of minimum and maximum temperatures, rainfall and river discharge data were carefully analyzed through ANOVA test into five years trend for their sig- nificance at p < 0.05. In the Table 1, mean maximum, rainfall and river discharge have been observed most sig- nificant as compared to mean minimum temperature. 4.2. 25 Years Trend Hydro-meteorological characteristics have been deter- mined through water yield/contribution per annum in  S. Khalid et al. / Natural Science 5 (2013) 987-992 990 catchment’s basin and river basin analysis (Table 2). W ater Yield Calculation Daily water yield D calculation has been carried out through an annual average value X from the mean annual values of different years. This average value was then multiplied with the factor 86,400 (seconds are changed into days) to get amount of water in cubic meters per day Y. Y was then divided by the catchments area Z of a par- ticular station to get daily yield in m3/s of the catchment area. DYZ WhereYX86, 400 According to WAPDA [22] that precipitation rate in Chitral river catchment’s area is comparatively low, es- pecially the influence of the monsoon rainfall, which makes the more northern parts of the valley quite arid. Because of high altitude, precipitation mostly comes in the form of snowfall that feeds snowfields and glaciers of Hindukush Mountains. The dataset of Chitral River shows the mean annual discharge of 277 m3/s (Table 1) with a strong monthly variance ranging from a maximum of 841.90 m3/s in July to a minimum of 66.44 m3/s in March (Table 2). It has also been noted from the weather record of Chi- tral station that on average July is the hottest and driest month of the year having mean maximum temperature of 36˚C and 8 mm of average rainfall whereas the mean maximum temperature of March is about 15˚C and an average of 117 mm rainfall. Hence it is clear that tem- perature has a profound influence on the snow/glacial melt in comparison to rainfall. The discharge of Chitral River increases almost 12 times from March to July (Figure 2). The analysis also shows that maximum flow (60%) takes place in the monsoon period i.e. Jul-Sep followed by 23% flow in pre-monsoon period. The flow duration curve (Figure 3) indicates that the discharge remains above the mean approximately 30% of the time while 60% of the time the discharge is less than the mean value. It also shows that up to 10% of the time the dis- charge in access of 300% to 900% of the mean flow. It means that snow/glacial cover of the area melt or retreats with respect to the climate and respond in similar way to seasonal and annual variations in discharge as suggested by Ferguson [23]. Plotting discharge values as time series (Figure 4) shows that the highest annual discharge took place in 1988 and 1992 (320 m3/s) whereas the lowest discharge of 220 m3/s was recorded in 1982. The results of the highest annual discharge are in consistent with the study of Rehman et al. [16]. The trend line indicates a clear increasing trend in the discharge rate from 1976 to 2000. The same significance trend is shown by the ANOVA result presented in Table 1. 5. CONCLUSION In order to examine the influence of the rapid snow melting on Chitral river discharge at Chitral district dur- ing monsoon period July to September, the hydro-mete- orological data were carefully compiled into five and twenty five year periods. The results of the study re- vealed that mean monthly maximum temperature has a strong influence on river discharge and impact of rainfall is relatively small because large bulk of river discharge occurs during May-September due to snow/glacial melt and receives a lot of snowfall from winter (Dec-Feb) to pre-monsoon (April-May). In the present study, 30% of the time the discharge rate remains above the mean in the monsoon period (Jul-Sep), while 60% of the time the discharge is less than the mean in the pre-monsoon (April-May) period. It means that 10% of the time the discharge is in reach of 300% to 900% of the mean flow, indicating the signals of climate change i.e. a rise in wa- ter yield, river discharge and shortened the snow fall pe- riod due to increase in mean monthly maximum tem- perature. Therefore, the present study will be useful for irrigated agriculture, hydel power generation and water- shed management sectors for future planning and response capabilities to disastrous effects of change in hydrologi- cal cycle on national level. Figure 2. Monthly flow availability of Chitral River. Copyright © 2013 SciRes. OPEN ACCESS 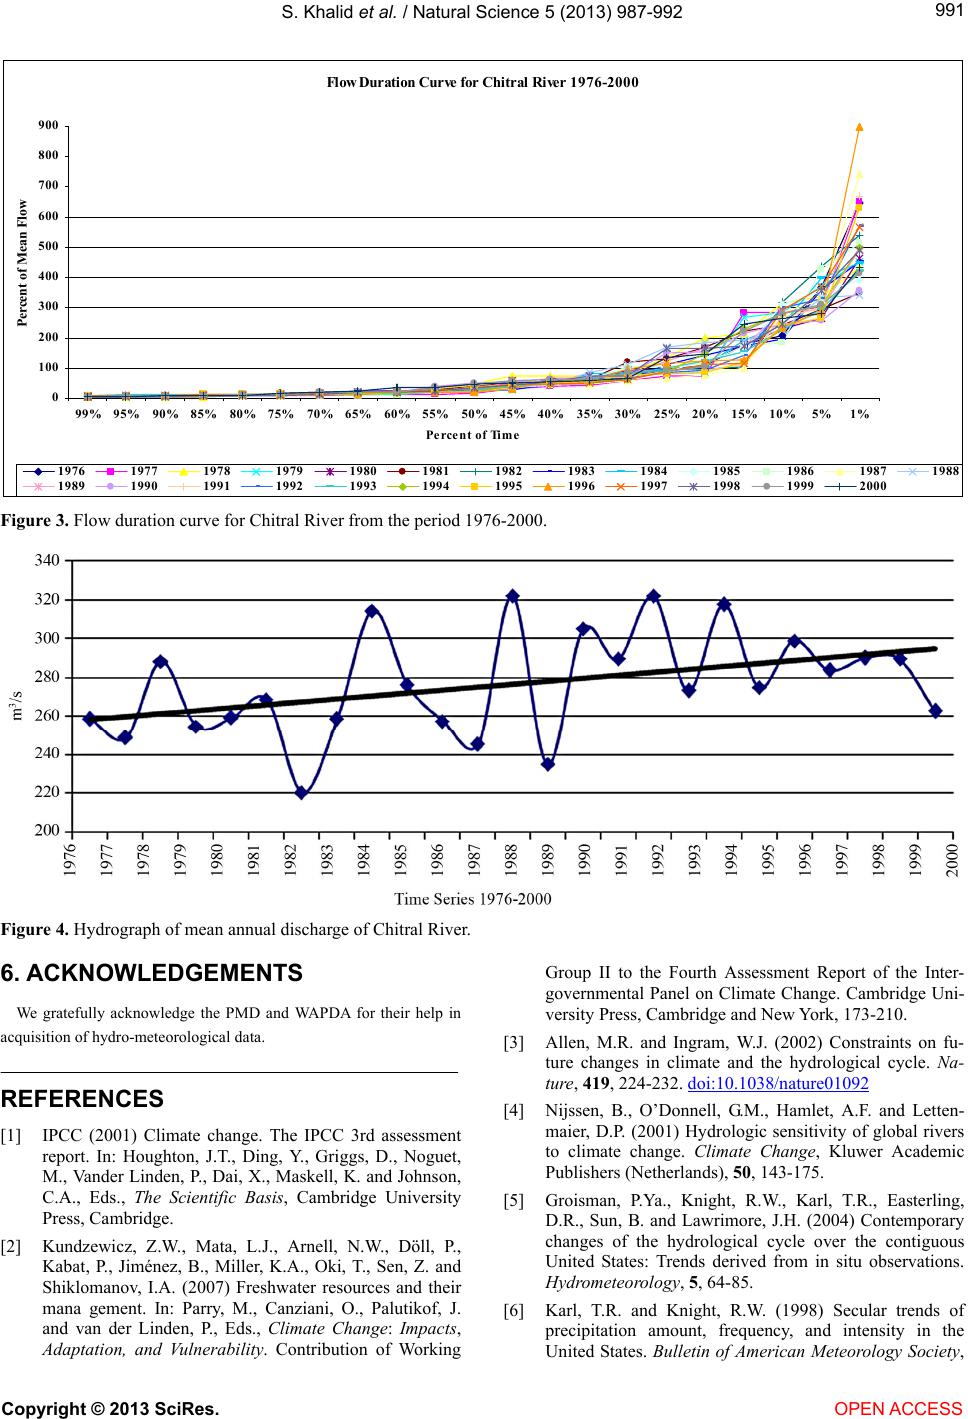 S. Khalid et al. / Natural Science 5 (2013) 987-992 991 Flow Du ration Curve for Chit r al River 1976-2000 0 100 200 300 400 500 600 700 800 900 99% 95%90% 85%80% 75%70% 65%60% 55%50% 45% 40%35% 30%25% 20%15% 10%5%1% Percent o f Ti me Percent of Mean Flow 1976 1977 1978 19791980 1981 1982 1983 1984 19851986 1987 1988 1989 1990 1991 19921993 1994 1995 1996 1997 19981999 2000 Figure 3. Flow duration curve for Chitral River from the period 1976-2000. Figure 4. Hydrograph of mean annual discharge of Chitral River. 6. ACKNOWLEDGEMENTS We gratefully acknowledge the PMD and WAPDA for their help in acquisition of hydro-meteorological data. REFERENCES [1] IPCC (2001) Climate change. The IPCC 3rd assessment report. In: Houghton, J.T., Ding, Y., Griggs, D., Noguet, M., Vander Linden, P., Dai, X., Maskell, K. and Johnson, C.A., Eds., The Scientific Basis, Cambridge University Press, Cambridge. [2] Kundzewicz, Z.W., Mata, L.J., Arnell, N.W., Döll, P., Kabat, P., Jiménez, B., Miller, K.A., Oki, T., Sen, Z. and Shiklomanov, I.A. (2007) Freshwater resources and their mana gement. In: Parry, M., Canziani, O., Palutikof, J. and van der Linden, P., Eds., Climate Change: Impacts, Adaptation, and Vulnerability. Contribution of Working Group II to the Fourth Assessment Report of the Inter- governmental Panel on Climate Change. Cambridge Uni- versity Press, Cambridge and New York, 173-210. [3] Allen, M.R. and Ingram, W.J. (2002) Constraints on fu- ture changes in climate and the hydrological cycle. Na- ture, 419, 224-232. doi:10.1038/nature01092 [4] Nijssen, B., O’Donnell, G.M., Hamlet, A.F. and Letten- maier, D.P. (2001) Hydrologic sensitivity of global rivers to climate change. Climate Change, Kluwer Academic Publishers (Netherlands), 50, 143-175. [5] Groisman, P.Ya., Knight, R.W., Karl, T.R., Easterling, D.R., Sun, B. and Lawrimore, J.H. (2004) Contemporary changes of the hydrological cycle over the contiguous United States: Trends derived from in situ observations. Hydrometeorology, 5, 64-85. [6] Karl, T.R. and Knight, R.W. (1998) Secular trends of precipitation amount, frequency, and intensity in the United States. Bulletin of American Meteorology Society, Copyright © 2013 SciRes. OPEN ACCESS 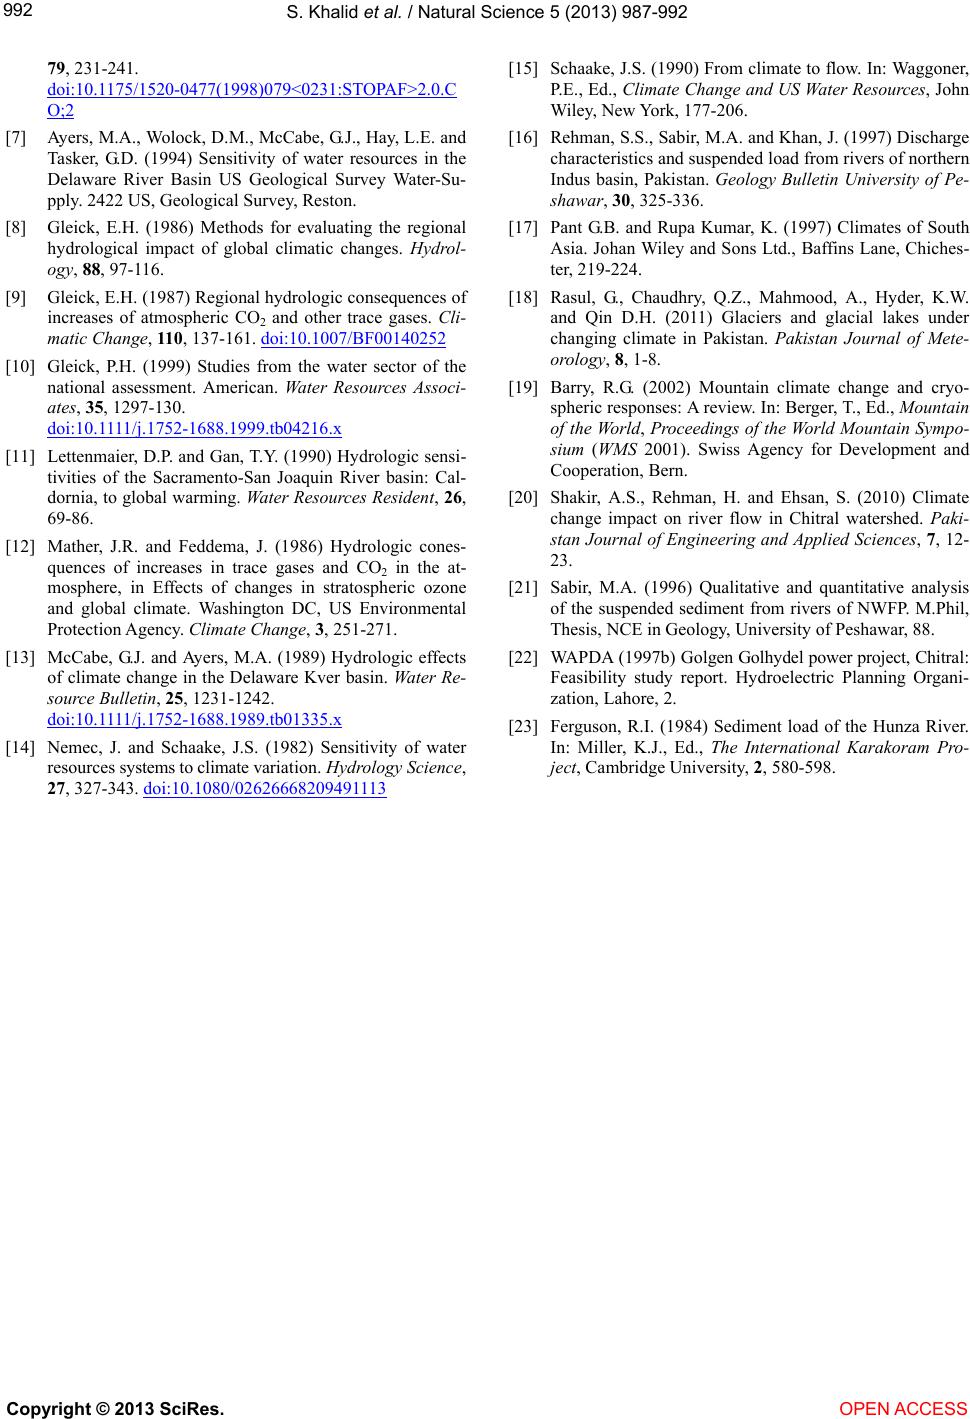 S. Khalid et al. / Natural Science 5 (2013) 987-992 992 79, 231-241. doi:10.1175/1520-0477(1998)079<0231:STOPAF>2.0.C O;2 [7] Ayers, M.A., Wolock, D.M., McCabe, G.J., Hay, L.E. and Tasker, G.D. (1994) Sensitivity of water resources in the Delaware River Basin US Geological Survey Water-Su- pply. 2422 US, Geological Survey, Reston. [8] Gleick, E.H. (1986) Methods for evaluating the regional hydrological impact of global climatic changes. Hydrol- ogy, 88, 97-116. [9] Gleick, E.H. (1987) Regional hydrologic consequences of increases of atmospheric CO2 and other trace gases. Cli- matic Change, 110, 137-161. doi:10.1007/BF00140252 [10] Gleick, P.H. (1999) Studies from the water sector of the national assessment. American. Water Resources Associ- ates, 35, 1297-130. doi:10.1111/j.1752-1688.1999.tb04216.x [11] Lettenmaier, D.P. and Gan, T.Y. (1990) Hydrologic sensi- tivities of the Sacramento-San Joaquin River basin: Cal- dornia, to global warming. Water Resources Resident, 26, 69-86. [12] Mather, J.R. and Feddema, J. (1986) Hydrologic cones- quences of increases in trace gases and CO2 in the at- mosphere, in Effects of changes in stratospheric ozone and global climate. Washington DC, US Environmental Protection Agency. Climate Change, 3, 251-271. [13] McCabe, G.J. and Ayers, M.A. (1989) Hydrologic effects of climate change in the Delaware Kver basin. Water Re- source Bulletin, 25, 1231-1242. doi:10.1111/j.1752-1688.1989.tb01335.x [14] Nemec, J. and Schaake, J.S. (1982) Sensitivity of water resources systems to climate variation. Hydrology Science, 27, 327-343. doi:10.1080/02626668209491113 [15] Schaake, J.S. (1990) From climate to flow. In: Waggoner, P.E., Ed., Climate Change and US Water Resources, John Wiley, New York, 177-206. [16] Rehman, S.S., Sabir, M.A. and Khan, J. (1997) Discharge characteristics and suspended load from rivers of northern Indus basin, Pakistan. Geology Bulletin University of Pe- shawar, 30, 325-336. [17] Pant G.B. and Rupa Kumar, K. (1997) Climates of South Asia. Johan Wiley and Sons Ltd., Baffins Lane, Chiches- ter, 219-224. [18] Rasul, G., Chaudhry, Q.Z., Mahmood, A., Hyder, K.W. and Qin D.H. (2011) Glaciers and glacial lakes under changing climate in Pakistan. Pakistan Journal of Mete- orology, 8, 1-8. [19] Barry, R.G. (2002) Mountain climate change and cryo- spheric responses: A review. In: Berger, T., Ed., Mountain of the World, Proceedings of the World Mountain Sympo- sium (WMS 2001). Swiss Agency for Development and Cooperation, Bern. [20] Shakir, A.S., Rehman, H. and Ehsan, S. (2010) Climate change impact on river flow in Chitral watershed. Paki- stan Journal of Engineering and Applied Sciences, 7, 12- 23. [21] Sabir, M.A. (1996) Qualitative and quantitative analysis of the suspended sediment from rivers of NWFP. M.Phil, Thesis, NCE in Geology, University of Peshawar, 88. [22] WAPDA (1997b) Golgen Golhydel power project, Chitral: Feasibility study report. Hydroelectric Planning Organi- zation, Lahore, 2. [23] Ferguson, R.I. (1984) Sediment load of the Hunza River. In: Miller, K.J., Ed., The International Karakoram Pro- ject, Cambridge University, 2, 580-598. Copyright © 2013 SciRes. OPEN ACCESS
|