T. Tsvetkova et al. / Natural Science 5 (2013) 8-17
10
(CLIPPERTON II) and ZnS scintillators were applied.
The data were recorded in the “memory” of the device
every hour (for photodiodes) or every 5 min (for ZnS
scintillator). And Rn detectors were placed in dry cellars
with stable temperatures. The influence of meteorologi-
cal factors (change of air temperature, humidity, atmos-
pheric precipitations and pressure) on Rn data when
compared with seismic processes was there minimal.
Water Rn was measured by degassing of samples and
by scintillation measurement of the alpha activity of the
allocated gas. The minimal activity of water 0.1 Bq/l was
achieved at 30 min of degassing and 30 min of meas-
urement of alpha activity. CO2 was simultaneously
measured in the allocated gas. Infra-red detector PGA-7
(Russia) was used. 4 wells at the depth of 30, 180, 280
and 270 m were investigated in the set of Kholmsky. The
depth of the wells in other settlements was 10 - 30 m.
Water samples of 0.5l were selected from all the wells
each day at 9-00 GMT. Only from the well at 30 m depth
in the set of Kholmsky water samples were selected three
times a day at 4-00, 9-00 and 15-00.
Low level radiation was measured with low back-
ground gamma spectrometer consists of scintillation
crystal in the metal screen. In the galleries NaI (Tl) in the
size 90 mm × 90 mm in dia. with the photomultiplier in
dia. of 80 cm was applied. At the Earth’s surface in the
set of Kholmsky big crystal CsI (Tl) 150 mm × 200 mm
in dia. and the photomultiplier in dia. of 170 mm for the
continuous monitoring of gamma background was ap-
plied. From the photomultiplier pulses after amplification
get in the 128-channel amplitude-digital converter. After
processing the quantity of pulses in all 128 channels re-
corded in the “memory” of the device each 5 minutes.
The metal screen of the device was collected from
pig-iron rings in external dia of 750 mm and internal dia.
570 mm. The height of the screen is 1600 mm. Outside
pig-iron rings are closed by Pb sheets in the thickness of
5 sm. Inside of the pig-iron the crystals cover from an
external background by layers of the “old” Pb (it is made
till 1940, thickness of 50 mm) and W (30 mm).
Tritium (T) was measured in water samples in the
volume 0.5l. Electrolytic procedure was used. The device
SL-4000 measured further beta activity of the rest. Con-
centrations of some chemical elements were measured in
water samples in the chemical laboratory by standard
analytical devices.
4. RESULTS
4.1. Soil Rn in the Galleries and Cave
Tsvetkova et al. have shown monthly, daily and hourly
changes of soil Rn concentration in galleries and caves
[4]. Changes in the monthly data exceeded the changes
in regional seismicity for 3 - 4 months. This analysis was
based on the seismic catalogue of the Central Experi-
mental Expedition (CEE) of the Geophysical Service of
the Russian Academy of Sciences (GS RAS)).
The choice of earthquakes for the analysis was made
by criteria [6,7]. Monthly Rn data in the gallery “Sa-
chalin” are shown in [4]. Similar results were obtained in
the galleries “Novorossiysk” (N1, N2) and “Abrau” (Ab).
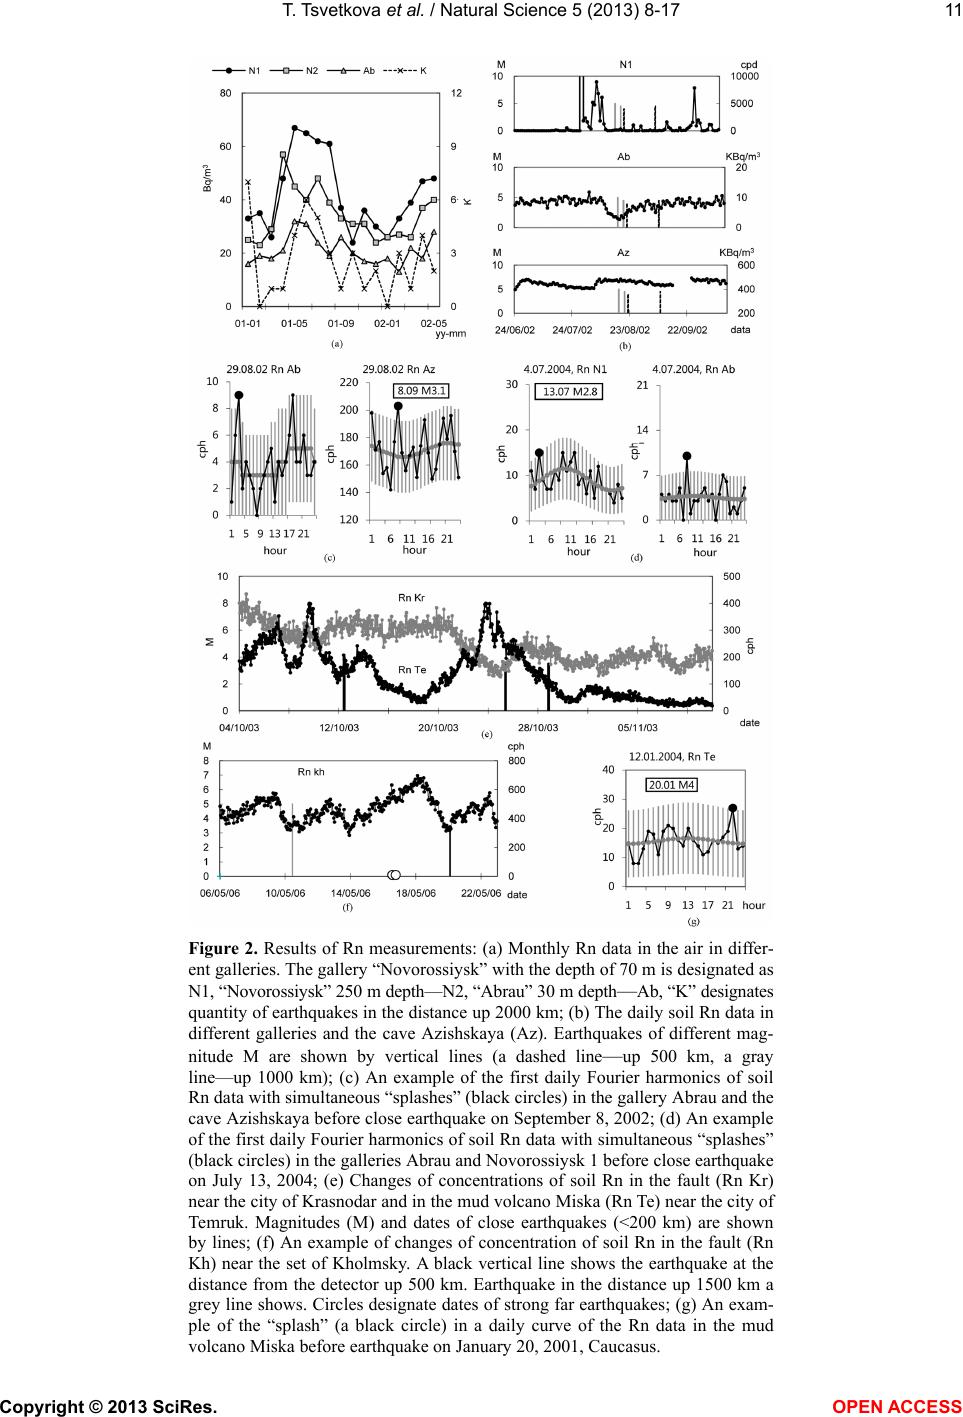
The monthly Rn data in the air of galleries varied in de-
pendence on a season (Figure 2(a)). Factor of the corre-
lation with regional earthquakes was 48% (N1); 23%
(N2); 22% (Ab). Monthly Rn data in the air of galleries
with intensive ventilation can not be used for seismol-
ogical application. The daily concentration of soil Rn
increased several days prior to the earthquakes. In Fig-
ure 2(b), the daily underground Rn data as an example
are shown. Regional earthquakes are shown in the same
place. The concentration of Rn began to decrease before
the earthquakes had occurred. This process occurred in
the all galleries. Changes of Rn data were sometimes
observed even without earthquakes only in “Novorossi-
ysk 1”. It may be explained by strong meteorological
influence on Rn data in this gallery. Gallery N1 has
length of 50 m, big diameter (5 m) and an open entrance.
Because of change of external atmospheric temperature
very strong processes of hashing of air are observed in
the gallery. Probably, it is another reason of strong
changes of concentration of soil Rn. Some Rn “splashes”
coincided with strong meteorological processes (e.g.,
hurricanes and tornados, as shown in Figure 2(b)—(last
Rn “splash” in N1)). Connection between atmospheric
pressure and daily underground Rn data is not found out
[4]. Connection of changes in the cave of daily concen-
trations of soil Rn with earthquakes is also not found out
yet.
The first Fourier harmonic was allocated in all the
daily Rn data. Hourly “splash” for 9 1 days before re-
gional earthquakes (up to 200 km of distance) were ob-
served in all the galleries and cave. “Splashes” were ob-
served above mistakes 2
a smooth daily curve (Figures
2(c), (d)).
4.2. Soil Rn at the Earth’s Surface
Tsvetkova et al. have shown monthly, daily and hourly
changes of soil Rn concentration in faults and mud vol-
canoes in the Western Caucasus [7]. The factor of corre-
lation of the monthly Rn activity in faults with the
monthly number of earthquakes within a radius of 2000
km was equal to 40%. The earthquake quantity data (for
research forecasting the seismicity) concerning the
monthly Rn concentrations were retrospectively dis-
placed at monthly intervals from 1 to 6 months. A sig-
nificant correlation for any interval of displacement was
not found. The factor of correlation of Rn data in mud
volcanoes with the number of earthquakes father than
Copyright © 2013 SciRes. OPEN A CCESS