 Advances in Physical Education 2013. Vol.3, No.3, 136-144 Published Online August 2013 in SciRes (http://www.scirp.org/journal/ape) http://dx.doi.org/10.4236/ape.2013.33023 Copyright © 2013 SciRes. 136 Physiological Differences between Ethiopian and Caucasian Distance Runners and Their Effects on 10 km Running Performance* R. Rafael Wishnizer1, Omri Inbar2#, Eliezer Klinman1, Gershon Fink1 1Exercise Physiology Lab, Department of Pulmonary Medicine, Kaplan Medical Centre, Rehovot, Israel 2Physiology Lab, Givat Washington College, Kvutzat Yavne, Israel Email: #inbar@wincol.ac.il Received March 17th, 2013; revised April 17th, 2013; accepted April 24th, 2013 Copyright © 2013 R. Rafael Wishnizer et al. This is an open access article distributed under the Creative Com- mons Attribution License, which permits unrestricted use, distribution, and reproduction in any medium, pro- vided the original work is properly cited. Objective: Ethiopian athletes currently dominate long distance running events in Israel. In an attempt to explain the apparently superior running ability of Israeli Ethiopian athletes at distances >5 km, we com- pared anatomical and physiological measurements in the fastest 21 Israeli Caucasian (CA) and 22 Israeli Ethiopian (ET) long distance runners with similar mean age, years of training, and weekly volume of training. Methods: Two to six months prior to or following official 10 km track race, subjects underwent an incremental maximal and sub-maximal exercise testing in an attempt to identify which of the measured anatomical and/or physiological variable/s explain best the success of the of Israeli Ethiopian long dis- tance runners. Results: The ET runners were significantly shorter and lighter and possessed a lower BMI than the CA runners. Whereas mean (ml/kg/min) was 10.3% lower in the Ethiopian runners (p = 0.007), their mean 10,000 m run time was 6.2% faster than their Caucasian counterparts (p < 0.001). Al- though anaerobic threshold-related variables were similar in the two ethnic groups, the Ethiopians’ run- ning economy (cost) was significantly higher than that of the CA ( = 40.3 vs. 45.5 ml/kg/min in the ET and CA respectively) (p > 0.001). Conclusion: The results suggest that factors associated with running cost, independent of body size, play a crucial role in the performance of 10 km running. The re- sults also suggest, though indirectly, that genetic and early life phenotypic factors are more dominant than later-life environmental factors (including training) at the 10 km performance level. 2peak VO 2sub VO Keywords: Long Distance Running; Running Economy; Anaerobic Threshold; Peak VO2; Ethiopians; Caucasians Introduction Many factors have been identified as having an influence on success in distance running. The observation of significant rela- tionships between VO2 max, the fraction of slow twitch fibers, the fraction of VO2 max which can be utilized, and running economy has implicated these factors, and a number of others, as being associated with success in distance running (Costill et al., 1976; Daniels, 1974; Rusko et al., 1978). The physiological characteristics and capabilities of the elite athlete are developed from a combination of genetic predisposi- tion and arduous physical training (Ruiz et al., 2009; Saltin, 2003; Scott et al., 2005). While it is our belief that these physiological factors repre- sent some of the most important determinants of athletic suc- cess, it should be acknowledged that biomechanical, psycholo- gical, tactical, nutritional and environmental factors also have the potential to impact upon performance to a greater or lesser extent. Running events from the middle distances (800 - 10,000 m) to long distances (half- and full-marathon) are dominated by East African black runners (Noakes, 2002; Noakes, 2000; Saltin, 1995). These populations may have a genotypic or phenotypic advantage when it comes to endurance running; several investi- gators have searched for phenotypic differences between black and white endurance athletes from South Africa, Kenya, and Eri- trea (Bosch et al., 1990; Coetzer et al., 1993; Lucia et al., 2006; Saltin, 1995; Weston et al., 2000). Studies comparing South and East African and Caucasian long distance runners have presented some consistent but also some inconsistent findings. Two studies indicated that black runners ran at a higher percentage of their maximum oxygen consumption (VO2 max) during either a simulated treadmill marathon (Bosch et al., 1990) (higher percentage of their VO2 max-marathon) or at a 10-km race pace (Weston et al., 2000) compared with their white counterparts. VO2 max differed in one (Weston et al., 2000) but not the other study (Bosch et al., *Grants: This study was supported in part by the Israeli Olympic Committee. Competing interests: None. Patient consent: Obtained. Ethics approval: This study was conducted with the approval of the the Kaplan Medical Center’s Helsinki Committee. #Corresponding author.  R. R. WISHNIZER ET AL. 1990). Similarly, one study found no difference in running eco- nomy at either 17 or 21 km/h (Coetzer et al., 1993), while an- other found a significant difference (Weston et al., 2000). A more consistent finding was that black endurance runners had lower blood lactate concentrations during submaximal exercise tests (Bosch et al., 1990; Coetzer et al., 1993; Weston et al., 2000). As stated above, it has been suggested that running economy may be related to performance in long distance running, with running economy defined as the oxygen consumption (l/min and ml/kg/min) for a given standardized sub-maximal treadmill velocity. However, it has also been pointed out that the varia- tion of all of the above mentioned parameters cannot always ex- plain running performance, especially in subjects with a limited range of performance levels (Costill et al., 1973; Daniels, 1974; Pollock, 1997). Studies have shown that the ability to run without accumu- lating lactate as a fatigue substance in active muscles is more critical than the magnitude of VO2 max (Costill et al., 1973; Fay et al., 1989). These studies have recommended several blood lactate-related indices, such as lactate threshold (LT), maximal lactate steady-state (maxLaSS) and speed at the anaerobic thre- shold (speed@AT) as better predictors for endurance running performance than VO2 max (Noakes et al., 1990). The above findings suggest that many factors are related to success in distance running, and that runners may set a race pace which closely approximates the running velocity at which running cost is at its lowest and/or at or just below the lactate threshold. No adequate study has so far been carried out to analyse the relationships among anatomical, pulmonary and exercise-re- lated cardiopulmonary parameters, and 10 k running perform- ance in Israel. The current study, therefore, it intended to ex- amine the power of some 30 physical and physiological labora- tory-based parameters (sub-maximal and maximal) in identify- ing the dominant factor/s that, singularly or in combination, explain and/or contribute to 10 k running performance in sub- elite competitive, though heterogeneous, Israeli long distance runners. Additionally, in an attempt to explain the apparently superior running ability of Israeli Ethiopian athletes at distances > 5 km, we compared physiological measurements in the fastest 21 Israeli Caucasian and 22 Israeli Ethiopian long distance run- ners with similar mean age, years of training and weekly vol- ume of training. Material and Methods Subjects Thirty of Israel’s top male long distance runners (16 ethnic Ethiopians and 14 Caucasians) were recruited from local athle- tic clubs. Athletes were informed about all the tests and the pos- sible risks and discomfort involved. Each athlete signed a writ- ten informed consent before testing. The Kaplan Medical Cen- ter’s Helsinki Committee approved this study. Inclusion criteria included currently competing in official long distance races, a current 10 k road race time of <32:40 min, no illness or injury in the previous 6 months, and training of >70 km/wk. The Ethiopian runners were born in Ethiopia but had been living and training in Israel for the last 10 to 20 years. The Caucasian runners were all born and trained in Israel and were of European, Arabicor North American descent, repre- senting most Caucasians living in Israel. Each athlete completed a detailed questionnaire reporting re- cent and career 10 k personal and season-best time, and his ty- pical training volume per week specifically for the previous six months. Six months prior to or following a formal 10 k race and after the study’s procedures had been explained to them, each subject underwent a thorough medical examination, which included phy- sical examination, full spirometric evaluation, and a cardiopul- monary exercise test (CPET). Most of the subjects had partici- pated in several national and international level competitions in long distance running, including 10 k, and half- and full-mara- thon races. The subjects’ selected physical characteristics and training profile, as well as their 10 k run time, are presented in Table 1. Cardiopulmonary Exercise Tests (CPET) Prior to the exercise challenge, anthropometric measure- ments were taken (weight, height, BMI) and a full resting pul- monary function test was performed (ZAN-600, Germany). Runners were encouraged to be well rested and to perform very low-intensity training the day before testing. All athletes were thoroughly familiarized with the treadmill (including ex- posure to low- and high-speed running on the treadmill) before the running tests. The CPET was performedon a treadmill (RAM 770 s, Ger- many) using a sub-maximal and maximal incremental exercise testprotocol (Inbar et al., 2001). The exercise protocol consisted of 1-min stages with workload incrementsof 1 km/h (speed) (the treadmill’s elevation remained constant at 1.5% throughout the test) until the subject reached the speed of 12 or 14 km/h depending on the runner’s best 10 k run time (~70% of 2 peak). This work rate (speed) was kept constant for 5 minutes in order to secure steady state conditions (verified by unchang- ed HR and 2 for at least two consecutive minutes). Fol- lowing the constant-sub-maximal stage, the 1-min stages pro- tocol with speed incrementsof 1 km/h was reinstated (keeping the slope unchanged) until the patient reached his maximum to- lerable effort (typical total CPET time was 13 - 17 min). Run- ners were said to have attained their maximal ability when at least two of the following criteria were fulfilled: VO VO Table 1. Physical characteristic, training profile and 10 k run time-Ethiopian (ET) vs. Caucasian (CA) runners. Ethiopian (n = 16) Caucasian (n = 14) Parameter Mean SD Mean SD P* Age, yr 27.9 8.1 28.4 6.1 0.875 Height, cm 167.47.4 175.9 4.5 0.001 Mass, kg 54.3 4.3 63.8 6.4 <0.001 BMI, kg/m2 19.4 1.5 20.6 2.0 0.062 Years training, yrs 9.6 6.6 8.2 4.3 0.519 Weekly distance, km 98.1 17.6 94.3 14.5 0.524 10 k time, min:sec 30:3600:43 32:24 00:20<0.001 10 k average speed, km/h19:3700:27 18:27 00:17<0.001 Note: *Bold numbers denote significant difference between groups. Copyright © 2013 SciRes. 137  R. R. WISHNIZER ET AL. 1) A plateau in 2 during the last two stages of the test 2) RER ≥ 1.15; 3) PETCO2 down-sloping during the last two min- utes of the test; and 4) HR within 10 beats/min of age-predicted maximum heart rate (220-age). A plateau in 2 was consi- dered as less than one-half the expected rise in oxygen con- sumption for the workload compared with the linear relation- ship between oxygen consumption and speed during the incre- mental test. Whenever these criteria were not fulfilled, the ath- letes had to perform the same test on another visit and were en- couraged verbally during the test to perform better. VO VO Continuous 12-lead ECG was monitored throughout the test, with recordings made at baseline and at the end of each minute of exercise as well as during the recovery period. Expired O2 and CO2 gases and the rate of airflow were mea- sured breath-by-breath at rest and throughout the exercise pe- riod using the ZAN-600 (Germany) automated metabolic and respiratory diagnostic system (metabolic cart). The system was calibrated before each test using standard reference gases with known concentrations. The following parameters were determined for each test on a breath-by-breath basis, and used for the interpretation of the results: Oxygen uptake (2), carbon dioxide output (2), heart rate (HR), oxygen pulse (O2 pulse), ventilatory anaerobic threshold (VAT), minute ventilation (VE), tidal volume (Vt), breathing frequency (Bf), end-tidal PO2 (PETO2), and end-tidal PCO2 (PETCO2). VO VCO The VAT was determined visually by two experienced re- viewers and expressed as 2 (ml/kg/min) and speed (km/h), using previously established criteria (Beaver et al., 1986). VO Maximal volitional effort was attempted in each test unless there were overt limiting symptoms such as fatigue, shortness of breath, leg pain, chest pain, BP abnormalities, arrhythmias or marked ST segment displacement (>3 mm). Running economy (running cost) was determined by using the mean 2 of the last three min during the steady-state phase of the CPET. VO Statistical Treatment All measured parameters (physical, anthropometric, maximal, sub-maximal and pulmonary) were compared between the Ethi- opian (ET) and the Caucasian (CA) groups, using an independ- ent t-test. Pairwise Pearson correlation was used to calculate the level of association between all measured parameters and 10 k running time. To identify the factors that can discriminate between groups Ethiopian/Caucasian), a logistic regression model was applied (the parameters that were included in the model were those that demonstrated significant correlation with 10 k run time). To identify the parameters that significantly affect the 10 k run time a multiple linear regression was applied, with a step- wise selection method and validation for multicolinearity. Sig- nificance level was defined as α ≤ 0.05. All analyses were car- ried out using SPSS version 20.0.01. Results The physical and performance characteristics, as well as the groups’ training profile, are presented in Table 1. Each of the Ethiopian runners outperformed his Caucasian counterpart in the study’s 10 k time trial (see Table 1). The respective mean (±SD) 10 k run time of the ET and the CA groups were 30:36 (±00:43) and 32:24 (±00:20) min, respec- tively (p > 0.001). There were no significant differences in age, weekly training volume, and years of training between the CA and the ET ath- letes. However, the ET runners were significantly shorter and lighter (P < 0.001) and possessed a lower BMI (P < 0.05) than the CA runners. Table 2 presents and compares selected pulmonary functions of the ET and the CA runners. It was noted that for absolute VC, FVC, FEV1, and FEV1/FVC, the ET runners had values signi- ficantly lower than those of the CA runners. However, the rela- tive DLCO (to VA-DLCO/VA) was significantly higher in the ET than in the CA runners, suggesting relatively (to VA) more efficient pulmonary gas diffusion in the former. FEV1/ FVC % of pred, DLCO and TGV/TLC were similar in the two running groups (Table 2). Responses during Maximal Treadmill Testing (CPET) Table 3 compares the peak cardiopulmonary responses (rea- ched during the CPET) between the ET and the CA runners. Absolute 2peak (l/min), peak CO2 (l/min), peak O2 pulse (ml−beat) and Vtpeak (l) were all significantly lower in the ET compared with the CA runners. Moreover, even when val- ues were corrected for body mass (2peak , ml/kg/min, or peak 2peak −0.75 kg, and peak O2 pulse, ml/kg/beat*100), sig- nificant differences between the two groups were still apparent, with the ET group presenting significantly lower values (see Table 3). It should be pointed out that when comparing popula- tions differing in body stature, it is more accurateto express oxygen uptake as milliliters per minute per kilogram0.75 than milliliters per minute per kilogram (Svedenhag, 1995). VO V VO VO Only peakBf (b/min) and peakVd/Vt (%) showed signifi- cantly higher values in the ET than in the CA runners (Table 3). Table 2. Resting pulmonary function-Ethiopian (ET) vs. Caucasian (CA) run- ners. Ethiopian (n = 16) Caucasian (n = 14) Parameter Mean SD Mean SD P* FVC, l 3.8 0.5 5.1 0.5 <0.001 FVC % pred 86.1 11.1 102.1 9.0 <0.001 FEV1, l/sec 3.3 0.5 4.3 0.5 <0.001 FEV1, % pred 85.6 9.9 102.5 11.7 <0.001 FEV1/FVC, % 86.4 6.4 79.2 22.0 0.239 FEV1/FVC, % pred106.3 6.8 102.3 10.5 0.234 DLCO, (mL/min/mmHg) 35.2 4.6 35.5 10.0 0.999 DLCO/VA, (mL/min/mmHg)/l 6.6 1.2 5.5 0.6 0.010 TGV/TLC, l/l 59.5 7.3 54.7 6.3 0.088 Note: *Bold numbers denote significant difference between groups. FVC = Force vital capacity; FEV1 = Force expiratory volume in one second; %pred. = Percent of predicted value; DLCO = Diffusing capacity of lung for carbon monoxide; DLCO/VA = The ratio of the DLCO to alveolar volume; TGV/TLC = The ratio of thoracic gas volume to total lung capacity. Copyright © 2013 SciRes. 138  R. R. WISHNIZER ET AL. Table 3. Peak physiological data measured during maximal treadmill test. Ethiopian (n = 16) Caucasian (n = 14) Parameter Mean SD Mean SD P* 2peak VO , l/min 3.6 0.6 4.8 0.5 <0.001 CO2 V peakl/min 3.2 0.6 4.2 0.5 <0.001 2peak VO , ml/kg/min 59.5 8.5 65.6 6.2 0.007 2peak VO −0.75 kg, ml/−0.75 kg/min 161.8 24.5 184.6 17.4 0.007 Speed@ km/h 2peak VO , 21.5 1.3 21.6 0.9 0.777 peakRER, l/l 1.1 0.1 1.2 0.1 0.388 peakHR, b/min 184.0 8.2 181.1 9.0 0.367 peakO2pulse, ml/kg/beat*100 32.4 4.3 36.3 2.6 0.006 peakVE, l/min 112.3 11.2 147.0 18.8<0.001 peakVt, l 1.7 0.3 2.5 0.3 <0.001 peakBf, b/min 65.9 7.7 60.0 11.0<0.001 BR, l/min 35.2 18.1 43.5 16.90.210 peakVE/ l/l 2 VO , 32.2 4.5 34.0 5.8 0.330 peakVE/ l/l CO2 V, 29.1 3.7 30.1 5.6 0.580 peakPETO2, mmHg 118.6 3.5 119.5 4.8 0.569 endPETCO2, mmHg 34.0 3.9 33.4 5.9 0.729 endVd/Vt, % 26.3 2.0 22.3 2.2 <0.001 Note: *Bold numbers denote significant difference between groups. VO = Rate of Oxygen uptake at maximal effort; = Rate of CO2 production at ma- ximal effort; , ml/kg/min = Oxygen uptake at maximal effort in ml/kg*min; −0.75 kg = Oxygen uptake at maximal effort in ml/kg75*min; Speed@ = Running speed at ; peakHR = Heart rate at maximal effort; peak O2pulse = Oxygen pulse at maximal effort; peakRER = Respiratory exchange ratio at maxi- mal effort; peakVE = Minute ventilation at maximal effort; peakVt = Tidal vol- ume at maximal effort; peakBf = Breathing frequency at maximal effort; BR = Breathing reserve at maximal effort; peakVE/2 VO = Respiratory equivalent for O2 at maximal effort; peakVE/ CO2 V = Respiratory equivalent for CO2 at maximal effort; peakPETO2 = End tidalO2 at maximal effort; end PETCO2 = End tidal CO2 at maximal effort; endVd/Vt = Physiological dead space at maximal effort. 2peak 2peak VCO 2peak VO 2peak VO 2peak VO 2peak VO PeakRER (l/l), peakHR (b/min), Speed@2peak (km/h), peakBR (l/min), peakVE/2 (l/l), peak2 CO (l/l), peak- PETO2 (mmHg), and peakPETCO2 (mmHg) demonstrated similar values in the two groups (see Table 3). VO V VO It is apparent that both groups reached similarly high peak CPET values as well as treadmill speeds at maximal treadmill tests, as would be expected for athletes of that caliber. Further- more, when observing the selected and relevant peak values (RER, HR and PETCO2) it is evident that maximal volitional efforts were reached in both groups (see Table 3). Responses during Sub-Maximal (Steady-State) Effort: At sub-maximal workload (12 or 14 km/h and approx. 70% 2 peak), no differences were observed between the two runners’ groups for RER, HR or O2 pulse/kg, confirming similar relative exercise intensity for both groups (Table 4). In addition, during the sub-maximal effort, 2, l/min, CO2, l/min, 2, ml/kg/min, 2 ml−0.75 kg/min and Vt, l, demonstrated significantly lower values in the ET compared with the CA group, while Bf, br/min, VE/2, l/l, VE/CO2, l/l, PETO2, mmHg, and Vd/Vt, %, showed higher values in the ET than in the CA runners (Table 4). VO VO VO V VO VO V As seen in Table 4, both VE and PETCO2 were also appre- ciably lower in the ET than in the CA group, though the differ- ence in these two variables did not reach a significant level (p = 0.07). Variables associated with the runners’ ventilatory anaerobic threshold (VAT, ml/kg/min, Speed@VAT, km/h, and VAT/ 2peak , %) were similar in the ET and the CA runners (Table 4). However, the 10 k AvSpeed/speed@2peak was signifi- cantly faster in the ET compared with that of the CA (92 vs. 86%; p > 0.001) (Table 4). It is also evident that, on the aver- VO VO Table 4. Physiological data obtained during sub-maximal treadmill test (~70% VO2peak). Ethiopian (n = 16) Caucasian (n = 14) Parameter** Mean SD Mean SD P* 2 VO , l/min 2.1 0.4 3.0 0.3<0.000 2 VCO , l/min 2.1 0.4 2.8 0.3<0.000 2 VO , ml/kg/min 40.3 4.1 45.5 2.80.000 2 VO −0.75 kg, ml−0.75 kg/min 103.5 16.8 131.8 17.9<0.001 RER, l/l 1.0 0.1 0.9 0.00.099 HR, b/min 148.7 9.0 153.6 9.7 0.120 O2 pulse, ml/kg/beat*100 27.5 2.8 29.1 2.60.122 VE, l/min 64.7 10.4 74.4 7.70.077 Vt, l 1.3 0.2 2.0 0.3<0.001 Bf, br/min 49.4 8.4 40.4 5.10.001 VE/ l/l 2 VO , 27.9 2.5 25.5 2.20.001 VE/ l/l 2 VCO , 27.8 2.6 25.8 1.80.019 PETO2, mmHg 112.4 3.2 109.4 3.6 0.018 PETCO2, mmHg 35.3 3.3 37.4 2.50.072 Vd/Vt, % 29.3 2.3 25.7 3.10.001 VAT, ml/kg/min 51.6 8.5 54.5 5.90.304 Speed@VAT, km/h 18.4 1.6 17.8 1.30.310 VAT/peakVO2, % 86.6 6.1 84.4 4.50.276 10 k Avspeed/speed@, % 2 VO peak 0.92 0.05 0.86 0.040.001 Note: *Bold numbers denote significant difference between groups. **Respective abriviations as in Table 3 but for submaximal steady-state effort (sub). VAT = Ventilatory anaerobic threshold; Speed@VAT = Running speed at VAT; 10 k AvSpeed/speed@ 2 = % of 10 k average speed of the speed at 2peak VO 2peak VO . Copyright © 2013 SciRes. 139 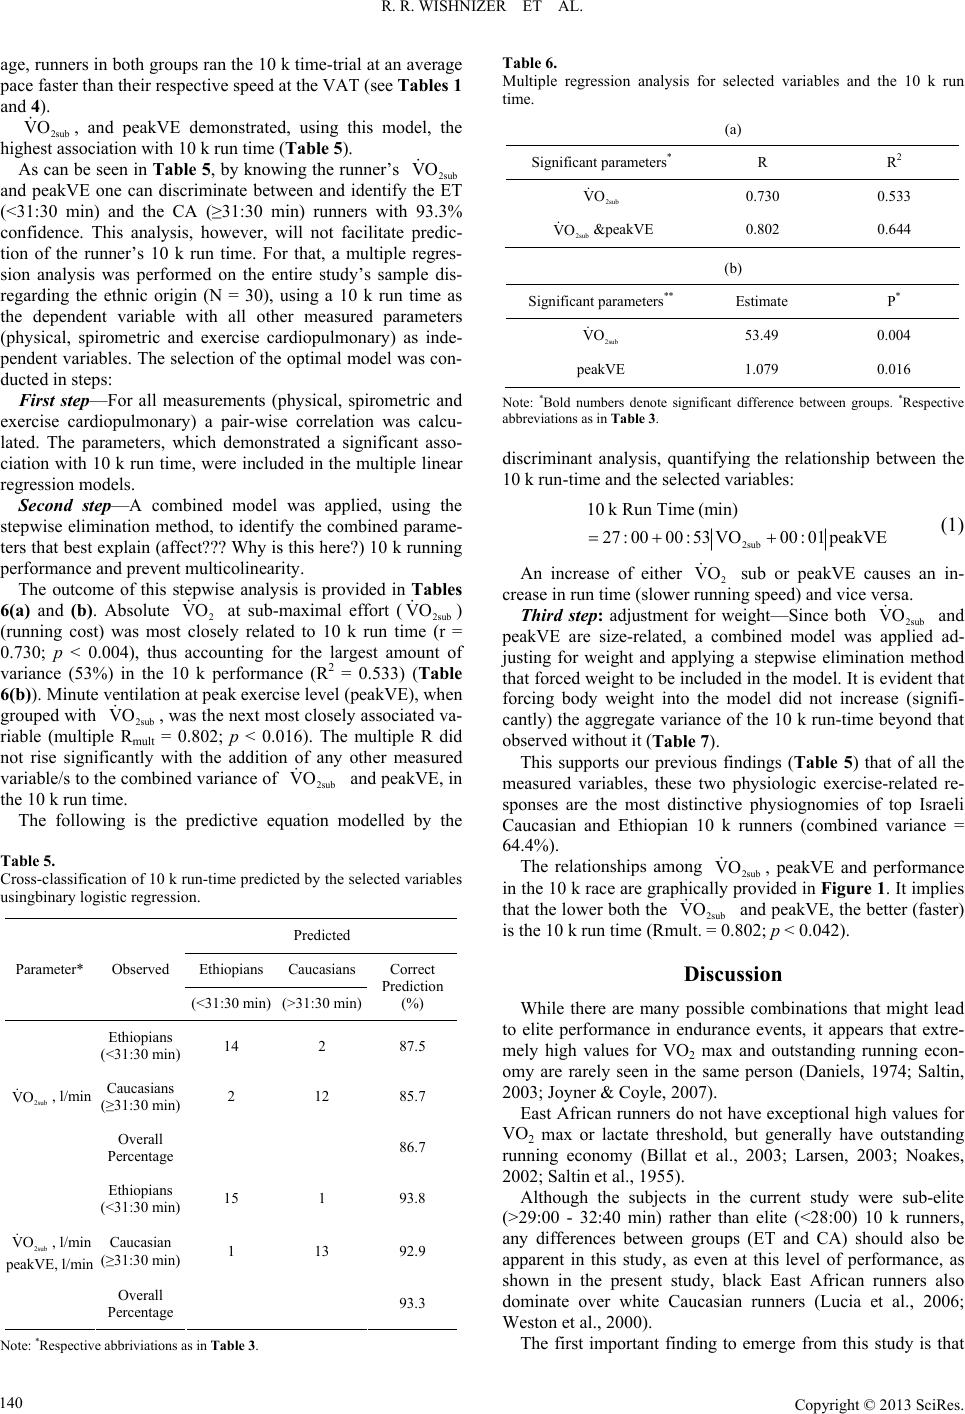 R. R. WISHNIZER ET AL. age, runners in both groups ran the 10 k time-trial at an average pace faster than their respective speed at the VAT (see Tables 1 and 4). 2sub , and peakVE demonstrated, using this model, the highest association with 10 k run time (Table 5). VO As can be seen in Table 5, by knowing the runner’s 2sub and peakVE one can discriminate between and identify the ET (<31:30 min) and the CA (≥31:30 min) runners with 93.3% confidence. This analysis, however, will not facilitate predic- tion of the runner’s 10 k run time. For that, a multiple regres- sion analysis was performed on the entire study’s sample dis- regarding the ethnic origin (N = 30), using a 10 k run time as the dependent variable with all other measured parameters (physical, spirometric and exercise cardiopulmonary) as inde- pendent variables. The selection of the optimal model was con- ducted in steps: VO First step—For all measurements (physical, spirometric and exercise cardiopulmonary) a pair-wise correlation was calcu- lated. The parameters, which demonstrated a significant asso- ciation with 10 k run time, were included in the multiple linear regression models. Second step—A combined model was applied, using the stepwise elimination method, to identify the combined parame- ters that best explain (affect??? Why is this here?) 10 k running performance and prevent multicolinearity. The outcome of this stepwise analysis is provided in Tables 6(a) and (b). Absolute 2 at sub-maximal effort (2sub ) (running cost) was most closely related to 10 k run time (r = 0.730; p < 0.004), thus accounting for the largest amount of variance (53%) in the 10 k performance (R2 = 0.533) (Table 6(b)). Minute ventilation at peak exercise level (peakVE), when grouped with , was the next most closely associated va- riable (multiple Rmult = 0.802; p < 0.016). The multiple R did not rise significantly with the addition of any other measured variable/s to the combined variance of and peakVE, in the 10 k run time. VO VO 2sub VO 2sub VO The following is the predictive equation modelled by the Table 5. Cross-classification of 10 k run-time predicted by the selected variables usingbinary logistic regression. Predicted Ethiopians Caucasians Parameter* Observed (<31:30 min) (>31:30 min) Correct Prediction (%) Ethiopians (<31:30 min) 14 2 87.5 Caucasians (≥31:30 min) 2 12 85.7 2sub VO , l/min Overall Percentage 86.7 Ethiopians (<31:30 min) 15 1 93.8 Caucasian (≥31:30 min) 1 13 92.9 2sub peakVE, l/min VO , l/min Overall Percentag e 93.3 Note: *Respective abbriviations as in Table 3. Table 6. Multiple regression analysis for selected variables and the 10 k run time. (a) Significant parameters* R R2 2sub VO 0.730 0.533 2sub VO &peakVE 0.802 0.644 (b) Significant parameters** Estimate P* 2sub VO 53.49 0.004 peakVE 1.079 0.016 Note: *Bold numbers denote significant difference between groups. *Respective abbreviations as in Table 3. discriminant analysis, quantifying the relationship between the 10 k run-time and the selected variables: 2sub 10 kRunTime (min) 27 : 0000:53VO00 :01peakVE (1) An increase of either 2 sub or peakVE causes an in- crease in run time (slower running speed) and vice versa. VO Third step: adjustment for weight—Since both 2sub and peakVE are size-related, a combined model was applied ad- justing for weight and applying a stepwise elimination method that forced weight to be included in the model. It is evident that forcing body weight into the model did not increase (signifi- cantly) the aggregate variance of the 10 k run-time beyond that observed without it (Table 7). VO This supports our previous findings (Table 5) that of all the measured variables, these two physiologic exercise-related re- sponses are the most distinctive physiognomies of top Israeli Caucasian and Ethiopian 10 k runners (combined variance = 64.4%). The relationships among 2sub , peakVE and performance in the 10 k race are graphically provided in Figure 1. It implies that the lower both the 2sub and peakVE, the better (faster) is the 10 k run time (Rmult. = 0.802; p < 0.042). VO VO Discussion While there are many possible combinations that might lead to elite performance in endurance events, it appears that extre- mely high values for VO2 max and outstanding running econ- omy are rarely seen in the same person (Daniels, 1974; Saltin, 2003; Joyner & Coyle, 2007). East African runners do not have exceptional high values for VO2 max or lactate threshold, but generally have outstanding running economy (Billat et al., 2003; Larsen, 2003; Noakes, 2002; Saltin et al., 1955). Although the subjects in the current study were sub-elite (>29:00 - 32:40 min) rather than elite (<28:00) 10 k runners, any differences between groups (ET and CA) should also be apparent in this study, as even at this level of performance, as shown in the present study, black East African runners also dominate over white Caucasian runners (Lucia et al., 2006; Weston et al., 2000). The first important finding to emerge from this study is that Copyright © 2013 SciRes. 140 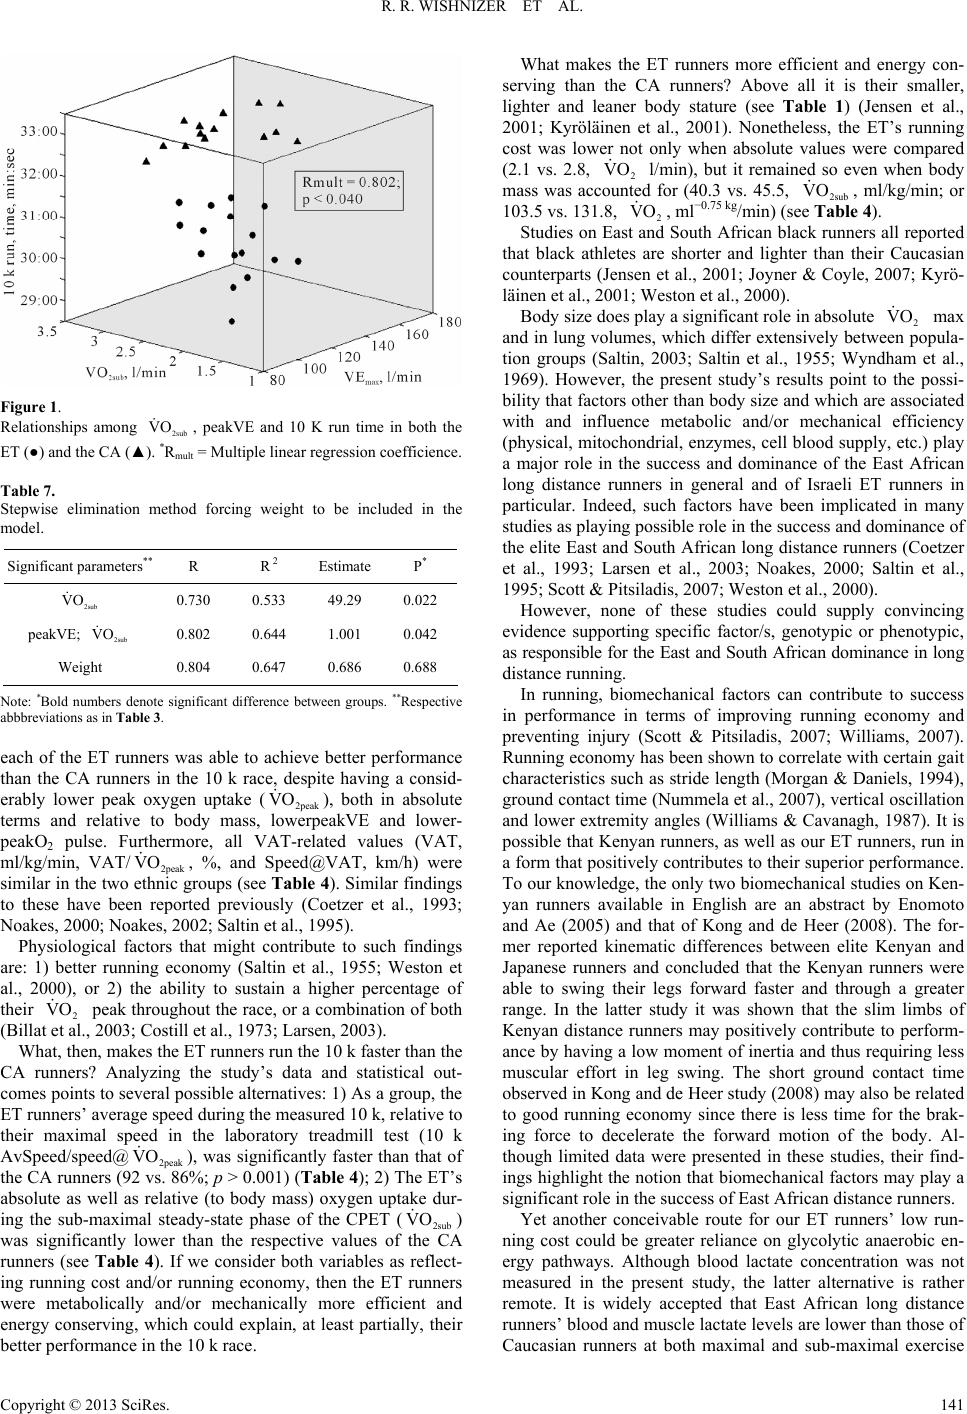 R. R. WISHNIZER ET AL. Figure 1. Relationships among , peakVE and 10 K run time in both the ET (●) and the CA (▲). *Rmult = Multiple linear regression coefficience. 2sub VO Table 7. Stepwise elimination method forcing weight to be included in the model. Significant parameters** R R 2 Estimate P* 2sub VO 0.730 0.533 49.29 0.022 peakVE; 2sub VO 0.802 0.644 1.001 0.042 Weight 0.804 0.647 0.686 0.688 Note: *Bold numbers denote significant difference between groups. **Respective abbbreviations as in Table 3. each of the ET runners was able to achieve better performance than the CA runners in the 10 k race, despite having a consid- erably lower peak oxygen uptake (2peak VO ), both in absolute terms and relative to body mass, lowerpeakVE and lower- peakO2 pulse. Furthermore, all VAT-related values (VAT, ml/kg/min, VAT/2peak , %, and Speed@VAT, km/h) were similar in the two ethnic groups (see Table 4). Similar findings to these have been reported previously (Coetzer et al., 1993; Noakes, 2000; Noakes, 2002; Saltin et al., 1995). VO Physiological factors that might contribute to such findings are: 1) better running economy (Saltin et al., 1955; Weston et al., 2000), or 2) the ability to sustain a higher percentage of their 2 peak throughout the race, or a combination of both (Billat et al., 2003; Costill et al., 1973; Larsen, 2003). VO What, then, makes the ET runners run the 10 k faster than the CA runners? Analyzing the study’s data and statistical out- comes points to several possible alternatives: 1) As a group, the ET runners’ average speed during the measured 10 k, relative to their maximal speed in the laboratory treadmill test (10 k AvSpeed/speed@ 2peak VO ), was significantly faster than that of the CA runners (92 vs. 86%; p > 0.001) (Table 4); 2) The ET’s absolute as well as relative (to body mass) oxygen uptake dur- ing the sub-maximal steady-state phase of the CPET (2sub ) was significantly lower than the respective values of the CA runners (see Table 4). If we consider both variables as reflect- ing running cost and/or running economy, then the ET runners were metabolically and/or mechanically more efficient and energy conserving, which could explain, at least partially, their better performance in the 10 k race. VO What makes the ET runners more efficient and energy con- serving than the CA runners? Above all it is their smaller, lighter and leaner body stature (see Table 1) (Jensen et al., 2001; Kyröläinen et al., 2001). Nonetheless, the ET’s running cost was lower not only when absolute values were compared (2.1 vs. 2.8, 2 l/min), but it remained so even when body mass was accounted for (40.3 vs. 45.5, 2sub , ml/kg/min; or 103.5 vs. 131.8, , ml−0.75 kg/min) (see Table 4). VO VO VO 2 Studies on East and South African black runners all reported that black athletes are shorter and lighter than their Caucasian counterparts (Jensen et al., 2001; Joyner & Coyle, 2007; Kyrö- läinen et al., 2001; Weston et al., 2000). Body size does play a significant role in absolute 2 max and in lung volumes, which differ extensively between popula- tion groups (Saltin, 2003; Saltin et al., 1955; Wyndham et al., 1969). However, the present study’s results point to the possi- bility that factors other than body size and which are associated with and influence metabolic and/or mechanical efficiency (physical, mitochondrial, enzymes, cell blood supply, etc.) play a major role in the success and dominance of the East African long distance runners in general and of Israeli ET runners in particular. Indeed, such factors have been implicated in many studies as playing possible role in the success and dominance of the elite East and South African long distance runners (Coetzer et al., 1993; Larsen et al., 2003; Noakes, 2000; Saltin et al., 1995; Scott & Pitsiladis, 2007; Weston et al., 2000). VO However, none of these studies could supply convincing evidence supporting specific factor/s, genotypic or phenotypic, as responsible for the East and South African dominance in long distance running. In running, biomechanical factors can contribute to success in performance in terms of improving running economy and preventing injury (Scott & Pitsiladis, 2007; Williams, 2007). Running economy has been shown to correlate with certain gait characteristics such as stride length (Morgan & Daniels, 1994), ground contact time (Nummela et al., 2007), vertical oscillation and lower extremity angles (Williams & Cavanagh, 1987). It is possible that Kenyan runners, as well as our ET runners, run in a form that positively contributes to their superior performance. To our knowledge, the only two biomechanical studies on Ken- yan runners available in English are an abstract by Enomoto and Ae (2005) and that of Kong and de Heer (2008). The for- mer reported kinematic differences between elite Kenyan and Japanese runners and concluded that the Kenyan runners were able to swing their legs forward faster and through a greater range. In the latter study it was shown that the slim limbs of Kenyan distance runners may positively contribute to perform- ance by having a low moment of inertia and thus requiring less muscular effort in leg swing. The short ground contact time observed in Kong and de Heer study (2008) may also be related to good running economy since there is less time for the brak- ing force to decelerate the forward motion of the body. Al- though limited data were presented in these studies, their find- ings highlight the notion that biomechanical factors may play a significant role in the success of East African distance runners. Yet another conceivable route for our ET runners’ low run- ning cost could be greater reliance on glycolytic anaerobic en- ergy pathways. Although blood lactate concentration was not measured in the present study, the latter alternative is rather remote. It is widely accepted that East African long distance runners’ blood and muscle lactate levels are lower than those of Caucasian runners at both maximal and sub-maximal exercise Copyright © 2013 SciRes. 141  R. R. WISHNIZER ET AL. levels (Larsen, 2003; Saltin, 2003; Saltin et al., 1995). The findings reported above (low blood and muscle lactate levels) could partially elucidate the present study’s observation that the ET runners’ average speed during the measured 10 k race, relative to their maximal speed in the laboratory treadmill test (10 k AvSpeed/speed@), was significantly faster than that of the CA runners. 2peak VO The observed lower VEsub and peakVE in our ET runners could be an additional contributing factor to the ET runners’ lower O2 uptake at both sub-maximal and maximal exertion, and consequently to their lower running cost. The ET runners’ significantly higher relative (to VA) pulmonary gas diffusion, as implicated by their significantly higher DLCO/VA (6.6 vs. 5.5, mL/min/mmHg/L; p < 0.010) (see Table 2) could be re- lated to their lower VEsub and peakVE and, though indirectly, to their better running economy and faster 10k run time. Other compensations for a slower rate of O2 uptake, both at maximal and submaximal effort, could be more efficient O2 utilization (Scott et al., 2005; Scott & Pitsiladis, 2007) or a specific leg muscle morphology (Saltin, 2003; Saltin et al., 1995). Although all the VAT-related variables were statistically si- milar in the study’s two ethnic groups, it is clear that runners in both groups possessed the ability to utilize a relatively large fraction of their 2peak during the 10 k race. Costill et al. (1973) found that a similar group of runners utilized an esti- mated 51.1 mllkg/min and 86% VO2 max while running a ten mile race. These values are in close agreement with the 51.6 - 54.5 ml/kg/min and 86.6% - 84.4% values found in the present study. VO 2peak VO To further explore the differences between the ET and the CA 10k runners and to identify those responses/features that best discriminate between the “fast” (ET) and the “slow” (CA) runners, three additional steps/procedures were carried out. 1) A logistic regression model, signifying that by knowing the runner’s 2sub and peakVE one can confidently discri- minate between and identify the ET (<31:30 min) and the CA (≥31:30 min) runners with 93.3% confidence. VO 2) A multiple regression analysis on the entire study’s sam- ple, disregarding the ethnic origin (N = 30), using a 10 k run time as the dependent variable, with all other measured para- meters (physical, spirometric and exercise cardiopulmonary) as independent variables. Here again, the most closely related re- sponses/variables to the 10 k run time were 2sub and peakVE (Table 6(a)). Looking at and solving Equation (1) in- dicates that entering both 2sub and peakVE to the regres- sion equation explains 64.4% of the total variance in 10 k run time (Table 6(a)). The remaining variance in 10 k running per- formance (35.6%) could not be explained by any single variable or a combination of the variables measured in the present study. Further, the above equation (Equation (1)) suggests that reduc- ing O2 consumption during a 10 k run by 1 l/min will improve the 10 k run time by approximately 1 min (53.5 sec). Reducing peakVE at the end of an all-out running task by 1 l/min will enhance 10 k running performance by only 1 sec (Table 6(b) and Equation (1)). VO VO 3) Since both 2sub and peakVE are size-related, a com- bined model was applied, adjusting for weight and applying a stepwise elimination method that forced weight to be included in the model (Table 7). It is apparent that forcing body weight into the model did not (significantly) increase the aggregate va- riation in the 10 k run time beyond that observed without it (Table 7). VO This model confirms that both mechanical and/or metabolic efficiency, defined in this study as the oxygen consumption du- ring running at a treadmill velocity of 12 - 14 km/h (~70% 2peak ) (2 sub), and, though to a smaller extent, minute ventilation at maximal effort during a treadmill test, play major roles in 10 k run-time. VO VO Several questions has arisen concerning our ET runners’ low- er running cost and lower peakVE in the face of their faster 10 k run-time. Is this mostly genetic, environmental, or a combina- tion of both? A growing body of evidence suggests that genetic variation does influence athletic performance, yet despite the speculation that East African athletes have a genetic advantage for endurance performance, there is no genetic evidence to sug- gest that this is indeed the case (Scott et al., 2005; Scott & Pit- siladis, 2007). There are just three relevant studies in the scientific literature that have examined physiological differences between Africans and non-Africans, and none of the three looked specifically at gene quality. That is no surprise since scientists don’t actually know which genes code for endurance performance; they can’t possibly determine whether Africans have a lock-hold on supe- rior genetic material. The malleability of mammalian biology during early life car- ries considerable weight throughout the course of the lifespan (Scott et al., 2005). Factors such as socioeconomic status (Flou- ris et al., 2009) and early mental stimulation are associated with life cognitive as well as metabolic and physiologic adjustments that could translate into enhanced physical performance in later life (Buchowicz et al., 2010; Julian et al., 2009). Potential can- didates include, but are not limited to, training at high altitude, increased level (intensity) of daily physical activity, fatigue re- sistance, differences in running economy and genetics (Holden, 2004). The present study’s ET runners are somewhat unique in that their birth, childhood and adolescence took place in Ethiopia while most of their adult life, and thus training, was spent in Is- rael. With such a unique background our ET runners possess both Ethiopian genotypic and phenotypic characteristics blend- ed with Israeli phenotypic/environmental features. The Ethiopian runner’s unconditional dominance in endur- ance running events, both globally and in Israel, implies a more dominant influence of Ethiopian-associated genetic and early life phenotypic factors than of later life factors (adulthood en- vironmental and training), on their performance of long dis- tance running in general, and that of the 10 k in particular. Conclusion Elite sporting performance results from the combination of innumerable factors, which interact with one another in a poor- ly understood but complex manner to mould a talented athlete into a champion. Within the field of sports science, elite per- formance is understood to be the result of both genotypic and phenotypic factors. However, the extent to which champions are born or made is a question yet unsolved. The present study describes the contributions made by selected physical, training and physiological (spirometric and exercise-related) parameters to the attainment of a high level 10 k performance. The results suggest that factors associated with running cost, independent of body size, play a crucial role in the performance of 10 k running. The results also suggest, though indirectly, that genetic and early life phenotypic factors are more dominant than la- Copyright © 2013 SciRes. 142  R. R. WISHNIZER ET AL. ter-life environmental factors (including training) at the 10 k performance level. Acknowledgements We thank the athletes for participating in the study. The authors acknowledge with thanks significant contribu- tion from Dr. ZmiraSilman (statistical analyses), and from Mrs. Dina Olswang (final editing of the manuscript). REFERENCES Beaver, W. L., Wasserman, K., & Whipp, B. J. (1986). A new method for detecting anaerobic threshold by gas exchange. Journal of Ap- plied Physiology, 60, 2020-2027. Billat, V. L., Lepretre, P. M., Heugas, A. M., et al. (2003). Training and bioenergetic characteristics in elite male and female Kenyan runners. Medicine & Science in Sports & Exercise, 35, 297-304. doi:10.1249/01.MSS.0000053556.59992.A9 Bosch, A. N., Goslin, B. R., Noakes, T. D., et al. (1990). Physiological differences between black and white runners during a treadmill mara- thon. European Journal o f Applied Physiology, 61, 68-72. doi:10.1007/BF00236696 Buchowicz, B., Yu, T., Nance, D. M., et al. (2010). Increased rat neo- natal activity influences adult cytokine levels and relative muscle mass. Pediatric Research, 68, 399-404. Coetzer, P., Noakes, T.D., Sanders, B., et al. (1993). Superior fatigue resistance of elite black South African distance runners. Journal of Applied Physiology, 75, 1822-1827. Costill, D. L., Fink, W. J., & Pollock, M. L. (1976). Muscle fiber com- position and enzyme activities of elite distance runners. Medical Science Sports, 8, 96-100. Costill, D. L., Thomason, H., & Roberts, E. (1973). Fractional utiliza- tion of the aerobic capacity during distance running. Medical Science Sports, 5, 248-252. Daniels, J. (1974). Physiological characteristics of champion male ath- letes. Res Q, 45, 342-348. Enomoto, Y., & Ae, M. (2005). Biomechanical comparison of Kenyan and Japanese elite long distance runners’s technics. In: Book of Ab- stracts, XXth Congress of the International Society of Biomechanics (abstract no. 852). Cleveland, OH: International Society of Biome- chanics. Fay, L., Londeree, B. R., LaFontaine, T. P., et al. (1989). Physiological parameters related to distance running performance in female ath- letes. Medical Science Sports Exercise, 21, 319-324. doi:10.1249/00005768-198906000-00016 Flouris, A. D., Spiropouous, Y., Sakellarious, G. J., et al. (2009). Effect of seasonal programming on fetal development and longevity: Links with environmental temperature. American Journal of Human Bio- logy, 21, 214-216. doi:10.1002/ajhb.20818 Holden, C. (2004). Peering under the hood of Africa’s runners. Science, 305, 637-649. doi:10.1126/science.305.5684.637 Inbar, O., Dlin, R., Rotstein, A., et al. (2001). Physiological responses to incremental exercise in patients with chronic fatigue syndrome. Medical Science Sports Exercise, 33, 1463-1470. doi:10.1097/00005768-200109000-00007 Jensen, K., Johansen, L., & Secher, N. H. (2001). Influence of body mass on maximal oxygen uptake: Effect of sample size. European Journal of Appllied Physiology, 84, 201-205. doi:10.1007/s004210170005 Joyner, M. J., & Coyle, E. F. (2007). Endurance exercise performance: The physiology of champions. Journal of Physiology, 586, 35-44. doi:10.1113/jphysiol.2007.143834 Julian, C. G., Wilson, M. J., & Moor, L. G. (2009. Evolutionary adapta- tion to high altitude: a view from in utero. American Journal of Hu- man Biology, 21, 614-622. doi:10.1002/ajhb.20900 Kong, P. W., & de Heer, H. (2008). Anthropometric, gait and strength characteristics of Kenyan distance runners. Journal of Sports Science Medicine, 7, 499-504. Kyröläinen, H., Belli, A., & Komi, P. V. (2001). Biomechanical factors affecting running economy. Medicine & Science in Sports & Exer- cise, 33, 1330-1337. doi:10.1097/00005768-200108000-00014 Larsen, H. (2003). Kenya dominance in distance running. Comparative Biochemistry and Physiol o g y, 136, 161-170. Lucia, A., Esteve-Lanao, J., Oliván, J., et al. (2006). Physiological cha- racteristics of the best Eritrean runners-exceptional running economy. Applied Physiology, Nutrition, and Metabolism, 31, 530-540. doi:10.1139/h06-029 Morgan, D.W., & Daniels, J. T. (1994). Relationship between VO2 max and the aerobic demand of running in elite distance runners. Inter- national Journal of S p orts Medicine, 15, 426-429. doi:10.1055/s-2007-1021082 Noakes, T. D. (2000). Physiological models to understand exercise fa- tigue and the adaptations that predict or enhance athletic performance. Scandinavian Journal of Medicine & Science in Sports, 10, 123-145. doi:10.1034/j.1600-0838.2000.010003123.x Noakes, T. D. (2002). Interactions among dietary fat, mineral status, and performance of endurance athletes: A case study. International Journal of Sport Nutr i t ion and Exercise Metab o l i s m , 12, 381-382. Noakes, T. D., Myburgh, K. H., & Schall, R. (1990). Peak treadmill running velocity during the VO2 max test predicts running perform- ance. Journal of Sports Science, 8 , 35-45. doi:10.1080/02640419008732129 Nummela, A., Keränen, T., & Mikkelsson, L. O. (2007). Factors related to top running speed and economy. International Journal of Sports Medicine, 28, 655-661. doi:10.1055/s-2007-964896 Pollock, M. L. (1977). Submaximal and maximal working capacity of elite distance runners. Part I: Cardiorespiratory aspects. Annals of the New York Academy of Sciences, 301, 310-322. doi:10.1111/j.1749-6632.1977.tb38209.x Ruiz, J. R., Gómez-Gallego, F., Santiago, C., et al. (2009). Is there an optimum endurance polygenic profile? Journal of Physiology, 587, 1527-1534. doi:10.1113/jphysiol.2008.166645 Rusko, H., Havu, M., & Karvinen, E. (1978). Aerobic performance ca- pacity in athletes. European Journal of Applied Physiology and Oc- cupational Physiology, 20, 151-159. Saltin, B. (2003). The Kenya report. New Studies in Athletics, 18, 15- 24. Saltin, B., Kim, C. K., Terrados, N., et al. (1995). Morphology, enzyme activities and buffer capacity in leg muscles of Kenyan and Scandi- navian runners. Scandinavian Journal of Medicine & Science in Sports, 5, 222-230. doi:10.1111/j.1600-0838.1995.tb00038.x Saltin, B., Larsen, H., Terados, N., et al. (1955). Aerobic exercise capa- city at sea level and at altitude in Kenyan boys, junior and senior run- ners compared with Scandinavian runners. Scandinavian Journal of Medicine & Science in Sports, 5, 209-221. doi:10.1111/j.1600-0838.1995.tb00037.x Scott, R. A., Moran, C., Wilson, R.H., et al. (2005). No association be- tween Angiotestin Converting Enzyme (ACE) gene variation and en- durance athlete status in Kenyans. Comparative Biochemistry and Physiology Part A: Molecular & Integrative Physiology, 141, 169- 175. Scott, R. A., & Pitsiladis, Y. P. (2007). Genotypes and distance running: Clues from Africa. Sports Medicine, 37, 424-427. doi:10.2165/00007256-200737040-00039 Svedenhag, J. (1995). Maximal and submaximal oxygen uptake during running: How should body mass be accounted for? Scandinavian Journal of Medicine & Science in Sports, 5, 175-180. doi:10.1111/j.1600-0838.1995.tb00033.x Weston, A. R., Karamizrak, O., Smith, A., et al. (1999). African run- ners exhibit greater fatigue resistance, lower lactate accumulation, and higher oxidative enzyme-activity. Journal of A pp li e d Physiology, 86, 915-923. Weston, A. R., Mbambo, Z., & Myburgh, K. H. (2000). Running econ- omy of African and Caucasian runners. Medicine & Science in S p o r t s & Exercise, 32, 1130-1134. doi:10.1097/00005768-200006000-00015 Williams, K R. (2007). Biomechanical factors contributing to marathon race success. Sports Medicine, 37, 420-423. doi:10.2165/00007256-200737040-00038 Williams, K. R., & Cavanagh, P. R. (1987). Relationship between dis- Copyright © 2013 SciRes. 143  R. R. WISHNIZER ET AL. Copyright © 2013 SciRes. 144 tance running mechanics, running economy, and performance. Jour- nal of Applied Physiology, 63 , 1236-1245. W yndham, C. H., Strydom, N. B., van Rensburg, A. J., et al. (1969). Physiological requirements for world-class performances in endur- ance running. South African Medical Journal, 43, 996-1002.
|