C. Y. YONG ET AL. 21
sensor: this sensor measure angular velocity in rad/s. Com-
pass: measures rotation angle with earth magnetic pole as
references. Hence, any magnetic or metal object might
disrupt the reading of this sensor, measured in degree.
3. Materials and Methods
3.1. Data Collection
A test subject was selected and his movement was evalu-
ated thoroughly to differentiate the motion of a subject.
The subject for this experiment is a healthy male indi-
vidual, with the age of 23, without medical record of
defect or other sicknesses. The test subject was attached
with the 3-space sensor on his upper arm, for jogging and
walking assessment. These motions were performed on a
controlled treadmill with wireless connection from the
sensor to the wireless dongle. Treadmill was used as a
medium for test subject to perform a regular motion with
lowest bias.
A preliminary speed testing was done before collecting
any data. The test subject needs to perform a normal
walk and jog on ground for a distance of 10 meter. Time
was stamped to record the period for the test subject to
cover up the activities. Hence, the test subject’s normal
walking and jogging speed was identified with walking
3.7 feet/second and jogging 6.5 feet/second. This infor-
mation was used as speed setting of the treadmill.
For walking motion, the test subject was asked to per-
form a normal walking on the treadmill with speed of 3.7
feet/second for a 10 meter, 15 meter, 20 meter, 25 meter
and 30 meter as a session. Then, every single session was
repeated 10 times for each of the different distance. Jog-
ging activity with speed 6.5 feet/second was performed
using the same characteristics of the walking activity.
Thus 50 sets of data for jogging and walking motion
were logged by the sensor were saved in .txt file.
3.2. Angular Velocity
The leg and arm are playing important role in human
motion. These two components are moving in a periodi-
cal wave while the test subject is performing jogging and
walking activities. The arm of the subject is the main
focus of the study.
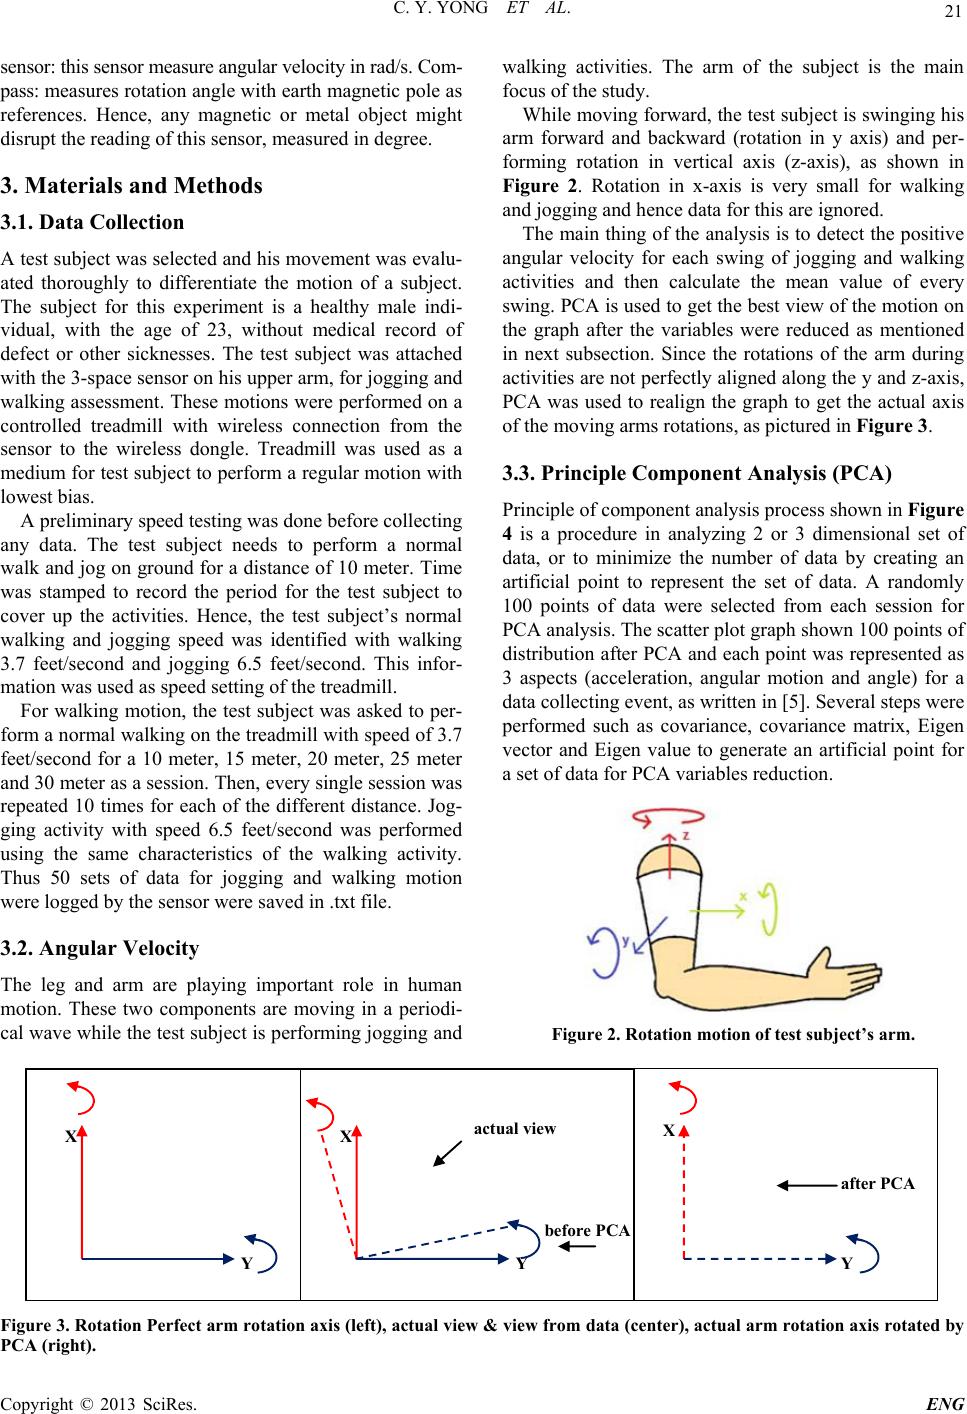
While moving forward, the test subject is swinging his
arm forward and backward (rotation in y axis) and per-
forming rotation in vertical axis (z-axis), as shown in
Figure 2. Rotation in x-axis is very small for walking
and jogging and hence data for this are ignored.
The main thing of the analysis is to detect the positive
angular velocity for each swing of jogging and walking
activities and then calculate the mean value of every
swing. PCA is used to get the best view of the motion on
the graph after the variables were reduced as mentioned
in next subsection. Since the rotations of the arm during
activities are not perfectly aligned along the y and z-axis,
PCA was used to realign the graph to get the actual axis
of the moving arms rotations, as pictured in Figure 3.
3.3. Principle Component Analysis (PCA)
Principle of component analysis process shown in Figure
4 is a procedure in analyzing 2 or 3 dimensional set of
data, or to minimize the number of data by creating an
artificial point to represent the set of data. A randomly
100 points of data were selected from each session for
PCA analysis. The scatter plot graph shown 100 points of
distribution after PCA and each point was represented as
3 aspects (acceleration, angular motion and angle) for a
data collecting event, as written in [5]. Several steps were
performed such as covariance, covariance matrix, Eigen
vector and Eigen value to generate an artificial point for
a set of data for PCA variables reduction.
Figure 2. Rotation motion of test subject’s arm.
X
Y
X
Y
actual view
before PCA
after PCA
X
Y
Figure 3. Rotation Perfect arm rotation axis (left), actual view & view from data (center), actual arm rotation axis rotated by
PCA (right).
Copyright © 2013 SciRes. ENG