Paper Menu >>
Journal Menu >>
 iBusiness, 2010, 2, 395-400 doi:10.4236/ib.2010.24052 Published Online December 2010 (http://www.scirp.org/journal/ib) Copyright © 2010 SciRes. iB Research of Logistics and Regional Economic Growth Ana Wang Dongbei University of Finance and Economics, Dalian, China. E-mail: wangana@dufe.edu.cn Received August 11th, 2010; revised October 6th, 2010; accepted November 19th, 2010. ABSTRACT This paper used Granger causality test method to analyze regional GDP growth in the domestic and regional freight turnover. And this paper used logistic model to analyze the reasons that regional logistics promote Anhui economic growth. Through the analysis that find Anhui economic growth on the leading role of regional logistics is not obvious. This showed that the role of regional logistics in promoting economic growth in Anhui Province has not been fully played out, which was not showing a good momentum of development co-ordination. So logistics will play an active role in the economy of Anhui province in the future. Keywords: Logistics, Economic Growth, Granger Causality Test, Logistic Model 1. Introduction With economic globalization and the deepening of social division labor, logistics as a sophisticated organization and management technology, which showed more and more important strategic position in the region economic development, and gradually cause for concern. Thus the interaction between regional logistics and regional eco- nomic growth has also thus become a hot research spot. Foreign theoretical studies on the relationship of regional logistics and regional economic growth started from We- ber’s Industrial location theory. Danuta. Kisperka-Moron [1] studied the relationship between economy and logis- tics in the period of economic transformation. He pointed out that the logistics problem is important issues of economy in the economic transition. Different economic period’s inventory reflects the changes of logistics. Keith G. Debbage (1999) and Kenneth Button, Samantha Tay- lor [2] studied the relationship between the air transport and regional economic development. Keith G. Debbage [3] thought that the air transport and regional economic development have an important link. Kenneth Button established a relational model of a new economic system of the United States and inter-regional air transport. Wei-Bin Zhang [4] studied the conditions of transport on economic growth and the impact of the economic zone. Taking into account transport is the most important part of logistics, and the research of the relationship between transportation and regional economic can reflect its in- trinsic role at a certain extent. In addition, Hunsoo Lee and Han Mo Yang [5] studied the development strategy of South Korea Incheon International Airport. The re- search identified its development potential as the logistics center of Northeast Asia. Domestic studies on the relationship between re- gional economic and regional logistics started in the 20th century. Some studies are fully aware of the dynamic role of regional logistics in economic development. These research results further deepen the internal rela- tionship between regional logistics and regional eco- nomic. And it provides some new ideas and methods for studying the relationship from many facts. Zhang Wenjie [6] used regional economy and trade theory to demonstrate the relationship between regional logistics and regional economic and pointed out that China’s economic development promoted the develop- ment of modern logistics. As the same time modern lo- gistics development also changed the regional economic growth ways and promoted the formation of new indus- tries and optimizes the regional industrial structure. Zhonggang [7] defined the exact meanings of regional logistics and regional economic growth. He selected three variables (freight, freight turnover, logistics net- work) as indicators to describe logistics from different aspects and also took every region’s GDP as its descrip- tion indicators of economic growth. He had established 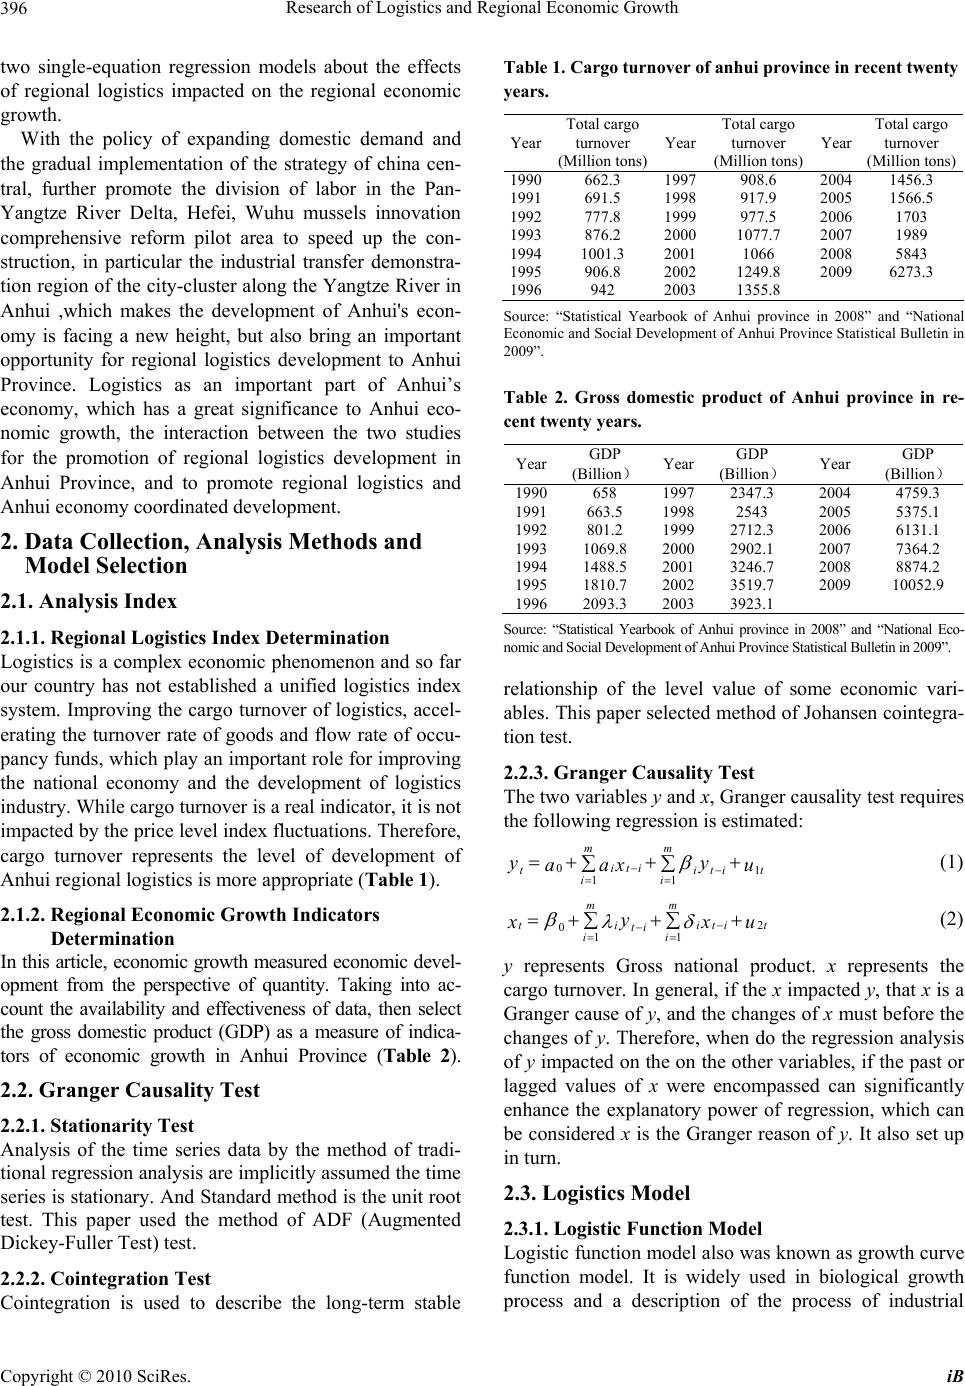 Research of Logistics and Regional Economic Growth Copyright © 2010 SciRes. iB 396 two single-equation regression models about the effects of regional logistics impacted on the regional economic growth. With the policy of expanding domestic demand and the gradual implementation of the strategy of china cen- tral, further promote the division of labor in the Pan- Yangtze River Delta, Hefei, Wuhu mussels innovation comprehensive reform pilot area to speed up the con- struction, in particular the industrial transfer demonstra- tion region of the city-cluster along the Yangtze River in Anhui ,which makes the development of Anhui's econ- omy is facing a new height, but also bring an important opportunity for regional logistics development to Anhui Province. Logistics as an important part of Anhui’s economy, which has a great significance to Anhui eco- nomic growth, the interaction between the two studies for the promotion of regional logistics development in Anhui Province, and to promote regional logistics and Anhui economy coordinated development. 2. Data Collection, Analysis Methods and Model Selection 2.1. Analysis Index 2.1.1. Regional Logistics Index Determination Logistics is a complex economic phenomenon and so far our country has not established a unified logistics index system. Improving the cargo turnover of logistics, accel- erating the turnover rate of goods and flow rate of occu- pancy funds, which play an important role for improving the national economy and the development of logistics industry. While cargo turnover is a real indicator, it is not impacted by the price level index fluctuations. Therefore, cargo turnover represents the level of development of Anhui regional logistics is more appropriate (Table 1). 2.1.2. Regional Economic Growth Indicators Determination In this article, economic growth measured economic devel- opment from the perspective of quantity. Taking into ac- count the availability and effectiveness of data, then select the gross domestic product (GDP) as a measure of indica- tors of economic growth in Anhui Province (Table 2). 2.2. Granger Causality Test 2.2.1. Stationarity Test Analysis of the time series data by the method of tradi- tional regression analysis are implicitly assumed the time series is stationary. And Standard method is the unit root test. This paper used the method of ADF (Augmented Dickey-Fuller Test) test. 2.2.2. Cointegration Test Cointegration is used to describe the long-term stable Table 1. Cargo turnover of anhui province in recent twenty years. Year Total cargo turnover (Million tons) Year Total cargo turnover (Million tons) Year Total cargo turnover (Million tons) 1990662.3 1997 908.6 2004 1456.3 1991691.5 1998 917.9 2005 1566.5 1992777.8 1999 977.5 2006 1703 1993876.2 20001077.7 2007 1989 19941001.3 20011066 2008 5843 1995906.8 20021249.8 2009 6273.3 1996942 20031355.8 Source: “Statistical Yearbook of Anhui province in 2008” and “National Economic and Social Development of Anhui Province Statistical Bulletin in 2009”. Table 2. Gross domestic product of Anhui province in re- cent twenty years. Year GDP (Billion)Year GDP (Billion) Year GDP (Billion) 1990658 19972347.3 2004 4759.3 1991 663.5 19982543 2005 5375.1 1992801.2 19992712.3 2006 6131.1 19931069.8 20002902.1 2007 7364.2 19941488.5 20013246.7 2008 8874.2 1995 1810.7 2002 3519.7 2009 10052.9 1996 2093.3 2003 3923.1 Source: “Statistical Yearbook of Anhui province in 2008” and “National Eco- nomic and Social Development of Anhui Province Statistical Bulletin in 2009”. relationship of the level value of some economic vari- ables. This paper selected method of Johansen cointegra- tion test. 2.2.3. Granger Causality Test The two variables y and x, Granger causality test requires the following regression is estimated: 01 11 mm iti it tti ii yy aax u (1) 2 011 mm tiitit ti ii y x xu (2) y represents Gross national product. x represents the cargo turnover. In general, if the x impacted y, that x is a Granger cause of y, and the changes of x must before the changes of y. Therefore, when do the regression analysis of y impacted on the on the other variables, if the past or lagged values of x were encompassed can significantly enhance the explanatory power of regression, which can be considered x is the Granger reason of y. It also set up in turn. 2.3. Logistics Model 2.3.1. Logistic Function Model Logistic function model also was known as growth curve function model. It is widely used in biological growth process and a description of the process of industrial 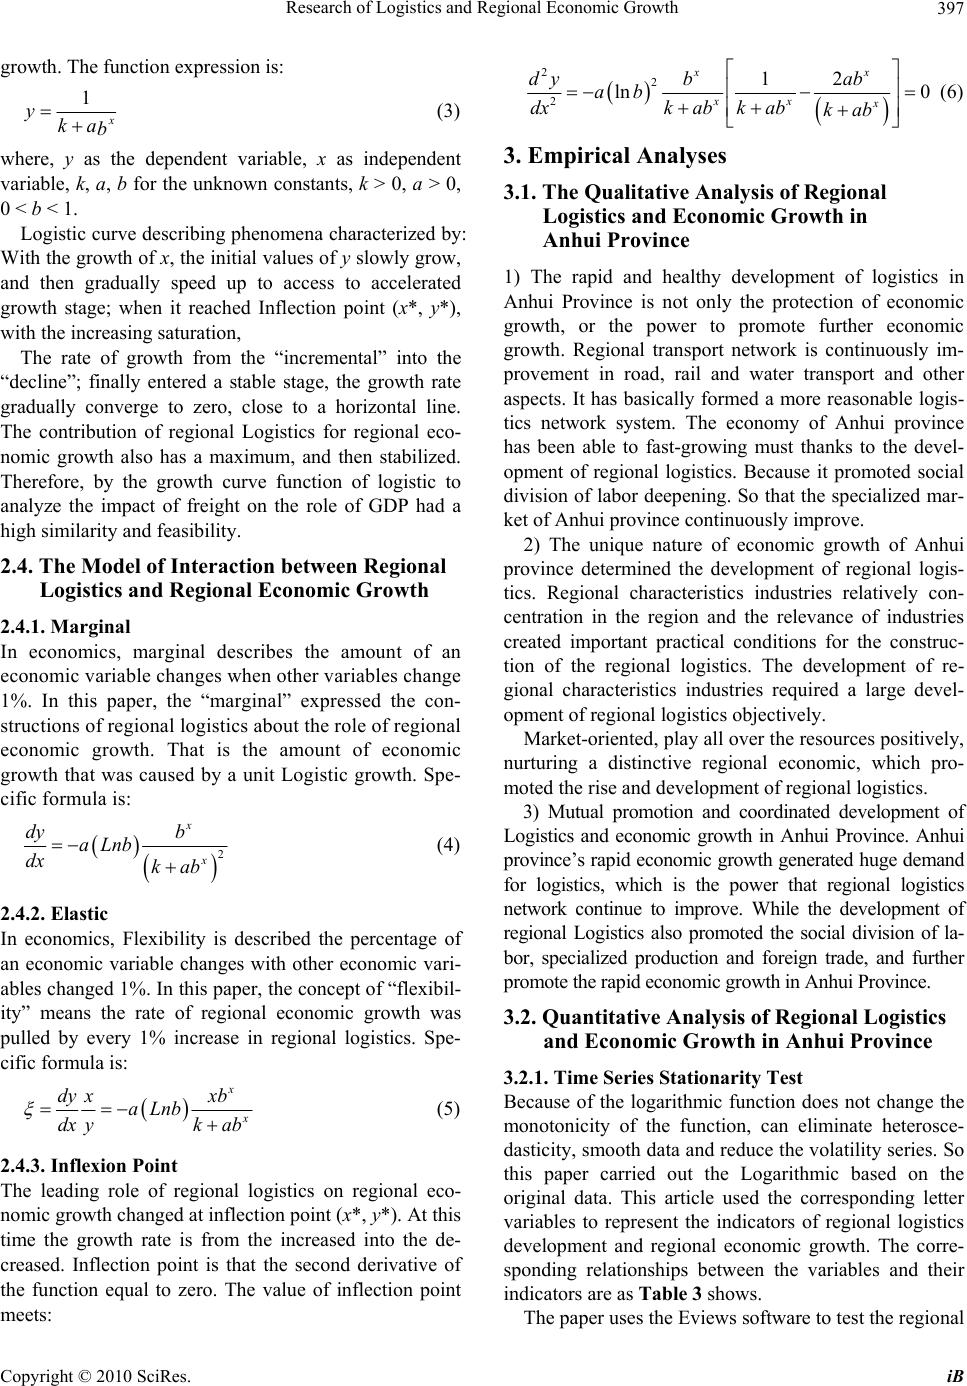 Research of Logistics and Regional Economic Growth Copyright © 2010 SciRes. iB 397 growth. The function expression is: 1 x yka b (3) where, y as the dependent variable, x as independent variable, k, a, b for the unknown constants, k > 0, a > 0, 0 < b < 1. Logistic curve describing phenomena characterized by: With the growth of x, the initial values of y slowly grow, and then gradually speed up to access to accelerated growth stage; when it reached Inflection point (x*, y*), with the increasing saturation, The rate of growth from the “incremental” into the “decline”; finally entered a stable stage, the growth rate gradually converge to zero, close to a horizontal line. The contribution of regional Logistics for regional eco- nomic growth also has a maximum, and then stabilized. Therefore, by the growth curve function of logistic to analyze the impact of freight on the role of GDP had a high similarity and feasibility. 2.4. The Model of Interaction between Regional Logistics and Regional Economic Growth 2.4.1. Marginal In economics, marginal describes the amount of an economic variable changes when other variables change 1%. In this paper, the “marginal” expressed the con- structions of regional logistics about the role of regional economic growth. That is the amount of economic growth that was caused by a unit Logistic growth. Spe- cific formula is: 2 x x dy b aLnb dx kab (4) 2.4.2. Elastic In economics, Flexibility is described the percentage of an economic variable changes with other economic vari- ables changed 1%. In this paper, the concept of “flexibil- ity” means the rate of regional economic growth was pulled by every 1% increase in regional logistics. Spe- cific formula is: x x dy xxb aLnb dx ykab (5) 2.4.3. Inflexion Point The leading role of regional logistics on regional eco- nomic growth changed at inflection point (x*, y*). At this time the growth rate is from the increased into the de- creased. Inflection point is that the second derivative of the function equal to zero. The value of inflection point meets: 22 2 12 ln 0 xx xx x dy bab ab dxk abk abkab (6) 3. Empirical Analyses 3.1. The Qualitative Analysis of Regional Logistics and Economic Growth in Anhui Province 1) The rapid and healthy development of logistics in Anhui Province is not only the protection of economic growth, or the power to promote further economic growth. Regional transport network is continuously im- provement in road, rail and water transport and other aspects. It has basically formed a more reasonable logis- tics network system. The economy of Anhui province has been able to fast-growing must thanks to the devel- opment of regional logistics. Because it promoted social division of labor deepening. So that the specialized mar- ket of Anhui province continuously improve. 2) The unique nature of economic growth of Anhui province determined the development of regional logis- tics. Regional characteristics industries relatively con- centration in the region and the relevance of industries created important practical conditions for the construc- tion of the regional logistics. The development of re- gional characteristics industries required a large devel- opment of regional logistics objectively. Market-oriented, play all over the resources positively, nurturing a distinctive regional economic, which pro- moted the rise and development of regional logistics. 3) Mutual promotion and coordinated development of Logistics and economic growth in Anhui Province. Anhui province’s rapid economic growth generated huge demand for logistics, which is the power that regional logistics network continue to improve. While the development of regional Logistics also promoted the social division of la- bor, specialized production and foreign trade, and further promote the rapid economic growth in Anhui Province. 3.2. Quantitative Analysis of Regional Logistics and Economic Growth in Anhui Province 3.2.1. Time Series Stationarity Test Because of the logarithmic function does not change the monotonicity of the function, can eliminate heterosce- dasticity, smooth data and reduce the volatility series. So this paper carried out the Logarithmic based on the original data. This article used the corresponding letter variables to represent the indicators of regional logistics development and regional economic growth. The corre- sponding relationships between the variables and their indicators are as Table 3 shows. The paper uses the Eviews software to test the regional 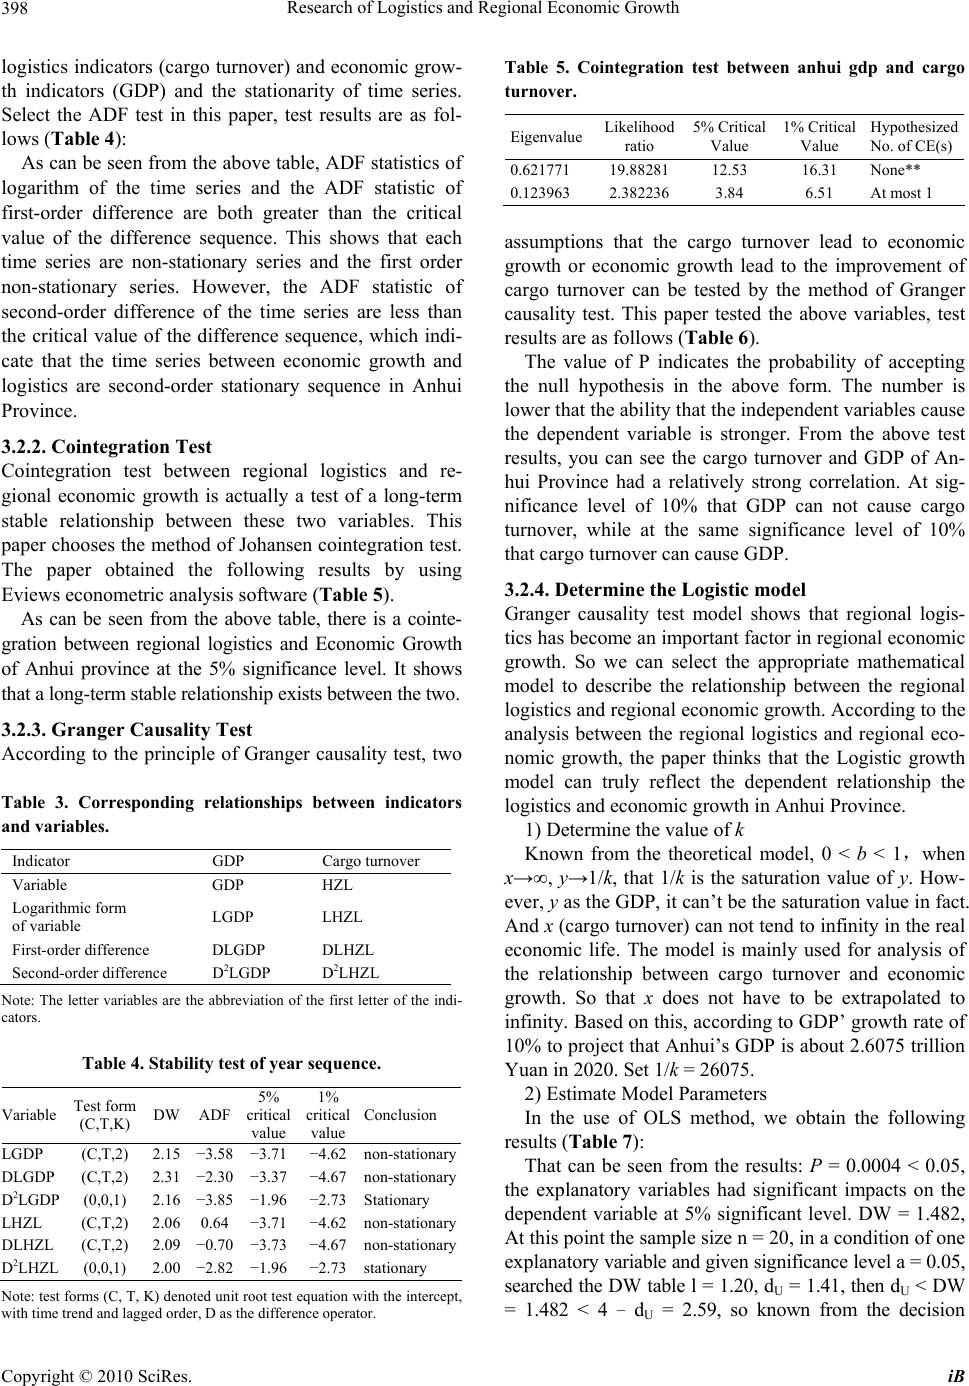 Research of Logistics and Regional Economic Growth Copyright © 2010 SciRes. iB 398 logistics indicators (cargo turnover) and economic grow- th indicators (GDP) and the stationarity of time series. Select the ADF test in this paper, test results are as fol- lows (Table 4): As can be seen from the above table, ADF statistics of logarithm of the time series and the ADF statistic of first-order difference are both greater than the critical value of the difference sequence. This shows that each time series are non-stationary series and the first order non-stationary series. However, the ADF statistic of second-order difference of the time series are less than the critical value of the difference sequence, which indi- cate that the time series between economic growth and logistics are second-order stationary sequence in Anhui Province. 3.2.2. Cointegration Test Cointegration test between regional logistics and re- gional economic growth is actually a test of a long-term stable relationship between these two variables. This paper chooses the method of Johansen cointegration test. The paper obtained the following results by using Eviews econometric analysis software (Table 5). As can be seen from the above table, there is a cointe- gration between regional logistics and Economic Growth of Anhui province at the 5% significance level. It shows that a long-term stable relationship exists between the two. 3.2.3. Granger Causality Test According to the principle of Granger causality test, two Table 3. Corresponding relationships between indicators and variables. Indicator GDP Cargo turnover Variable GDP HZL Logarithmic form of variable LGDP LHZL First-order difference DLGDP DLHZL Second-order difference D2LGDP D2LHZL Note: The letter variables are the abbreviation of the first letter of the indi- cators. Table 4. Stability test of year sequence. Variable Test form (C,T,K) DW ADF 5% critical value 1% critical value Conclusion LGDP (C,T,2) 2.15 −3.58 −3.71 −4.62 non-stationary DLGDP (C,T,2) 2.31 −2.30 −3.37 −4.67 non-stationary D2LGDP (0,0,1) 2.16 −3.85 −1.96 −2.73 Stationary LHZL (C,T,2) 2.06 0.64 −3.71 −4.62 non-stationary DLHZL (C,T,2) 2.09 −0.70 −3.73 −4.67 non-stationary D2LHZL (0,0,1) 2.00 −2.82 −1.96 −2.73 stationary Note: test forms (C, T, K) denoted unit root test equation with the intercept, with time trend and lagged order, D as the difference operator. Table 5. Cointegration test between anhui gdp and cargo turnover. Eigenvalue Likelihood ratio 5% Critical Value 1% Critical Value Hypothesized No. of CE(s) 0.621771 19.8828112.53 16.31 None** 0.123963 2.3822363.84 6.51 At most 1 assumptions that the cargo turnover lead to economic growth or economic growth lead to the improvement of cargo turnover can be tested by the method of Granger causality test. This paper tested the above variables, test results are as follows (Table 6). The value of P indicates the probability of accepting the null hypothesis in the above form. The number is lower that the ability that the independent variables cause the dependent variable is stronger. From the above test results, you can see the cargo turnover and GDP of An- hui Province had a relatively strong correlation. At sig- nificance level of 10% that GDP can not cause cargo turnover, while at the same significance level of 10% that cargo turnover can cause GDP. 3.2.4. Determine the Logistic model Granger causality test model shows that regional logis- tics has become an important factor in regional economic growth. So we can select the appropriate mathematical model to describe the relationship between the regional logistics and regional economic growth. According to the analysis between the regional logistics and regional eco- nomic growth, the paper thinks that the Logistic growth model can truly reflect the dependent relationship the logistics and economic growth in Anhui Province. 1) Determine the value of k Known from the theoretical model, 0 < b < 1,when x→∞, y→1/k, that 1/k is the saturation value of y. How- ever, y as the GDP, it can’t be the saturation value in fact. And x (cargo turnover) can not tend to infinity in the real economic life. The model is mainly used for analysis of the relationship between cargo turnover and economic growth. So that x does not have to be extrapolated to infinity. Based on this, according to GDP’ growth rate of 10% to project that Anhui’s GDP is about 2.6075 trillion Yuan in 2020. Set 1/k = 26075. 2) Estimate Model Parameters In the use of OLS method, we obtain the following results (Table 7): That can be seen from the results: P = 0.0004 < 0.05, the explanatory variables had significant impacts on the dependent variable at 5% significant level. DW = 1.482, At this point the sample size n = 20, in a condition of one explanatory variable and given significance level a = 0.05, searched the DW table l = 1.20, dU = 1.41, then dU < DW = 1.482 < 4 − d U = 2.59, so known from the decision 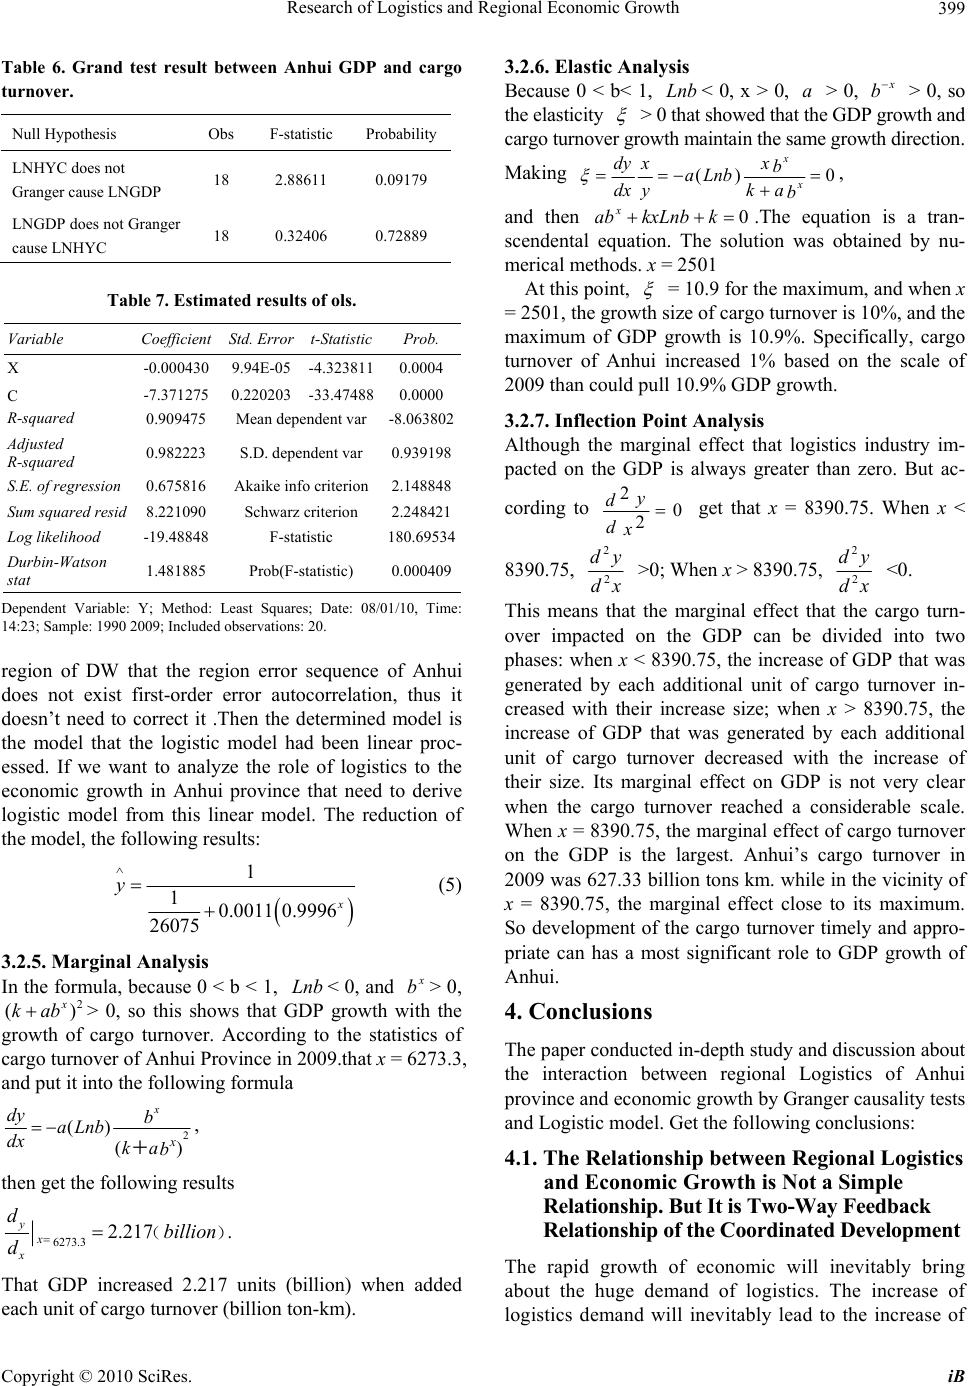 Research of Logistics and Regional Economic Growth Copyright © 2010 SciRes. iB 399 Table 6. Grand test result between Anhui GDP and cargo turnover. Null Hypothesis Obs F-statistic Probability LNHYC does not Granger cause LNGDP 18 2.88611 0.09179 LNGDP does not Granger cause LNHYC 18 0.32406 0.72889 Table 7. Estimated results of ols. Variable Coefficient Std. Error t-Statistic Prob. X -0.000430 9.94E-05 -4.323811 0.0004 C -7.371275 0.220203 -33.47488 0.0000 R-squared 0.909475 Mean dependent var -8.063802 Adjusted R-squared 0.982223 S.D. dependent var 0.939198 S.E. of regression 0.675816 Akaike info criterion 2.148848 Sum squared resid 8.221090 Schwarz criterion 2.248421 Log likelihood -19.48848 F-statistic 180.69534 Durbin-Watson stat 1.481885 Prob(F-statistic) 0.000409 Dependent Variable: Y; Method: Least Squares; Date: 08/01/10, Time: 14:23; Sample: 1990 2009; Included observations: 20. region of DW that the region error sequence of Anhui does not exist first-order error autocorrelation, thus it doesn’t need to correct it .Then the determined model is the model that the logistic model had been linear proc- essed. If we want to analyze the role of logistics to the economic growth in Anhui province that need to derive logistic model from this linear model. The reduction of the model, the following results: 1 10.00110.9996 26075 x y (5) 3.2.5. Marginal Analysis In the formula, because 0 < b < 1, Lnb < 0, and x b> 0, 2 )( x abk > 0, so this shows that GDP growth with the growth of cargo turnover. According to the statistics of cargo turnover of Anhui Province in 2009.that x = 6273.3, and put it into the following formula )( )( 2 b ak b Lnba dx dy x x , then get the following results )( billion d d x x y217.2 3.6273 . That GDP increased 2.217 units (billion) when added each unit of cargo turnover (billion ton-km). 3.2.6. Elastic Analysis Because 0 < b< 1, Lnb< 0, x > 0, a > 0, x b > 0, so the elasticity > 0 that showed that the GDP growth and cargo turnover growth maintain the same growth direction. Making 0)( b ak b x Lnba y x dx dy x x , and then 0 kkxLnbabx.The equation is a tran- scendental equation. The solution was obtained by nu- merical methods. x = 2501 At this point, = 10.9 for the maximum, and when x = 2501, the growth size of cargo turnover is 10%, and the maximum of GDP growth is 10.9%. Specifically, cargo turnover of Anhui increased 1% based on the scale of 2009 than could pull 10.9% GDP growth. 3.2.7. Inflection Point Analysis Although the marginal effect that logistics industry im- pacted on the GDP is always greater than zero. But ac- cording to 0 2 2 x d y d get that x = 8390.75. When x < 8390.75, xd yd 2 2 >0; When x > 8390.75, xd yd 2 2 <0. This means that the marginal effect that the cargo turn- over impacted on the GDP can be divided into two phases: when x < 8390.75, the increase of GDP that was generated by each additional unit of cargo turnover in- creased with their increase size; when x > 8390.75, the increase of GDP that was generated by each additional unit of cargo turnover decreased with the increase of their size. Its marginal effect on GDP is not very clear when the cargo turnover reached a considerable scale. When x = 8390.75, the marginal effect of cargo turnover on the GDP is the largest. Anhui’s cargo turnover in 2009 was 627.33 billion tons km. while in the vicinity of x = 8390.75, the marginal effect close to its maximum. So development of the cargo turnover timely and appro- priate can has a most significant role to GDP growth of Anhui. 4. Conclusions The paper conducted in-depth study and discussion about the interaction between regional Logistics of Anhui province and economic growth by Granger causality tests and Logistic model. Get the following conclusions: 4.1. The Relationship between Regional Logistics and Economic Growth is Not a Simple Relationship. But It is Two-Way Feedback Relationship of the Coordinated Development The rapid growth of economic will inevitably bring about the huge demand of logistics. The increase of logistics demand will inevitably lead to the increase of 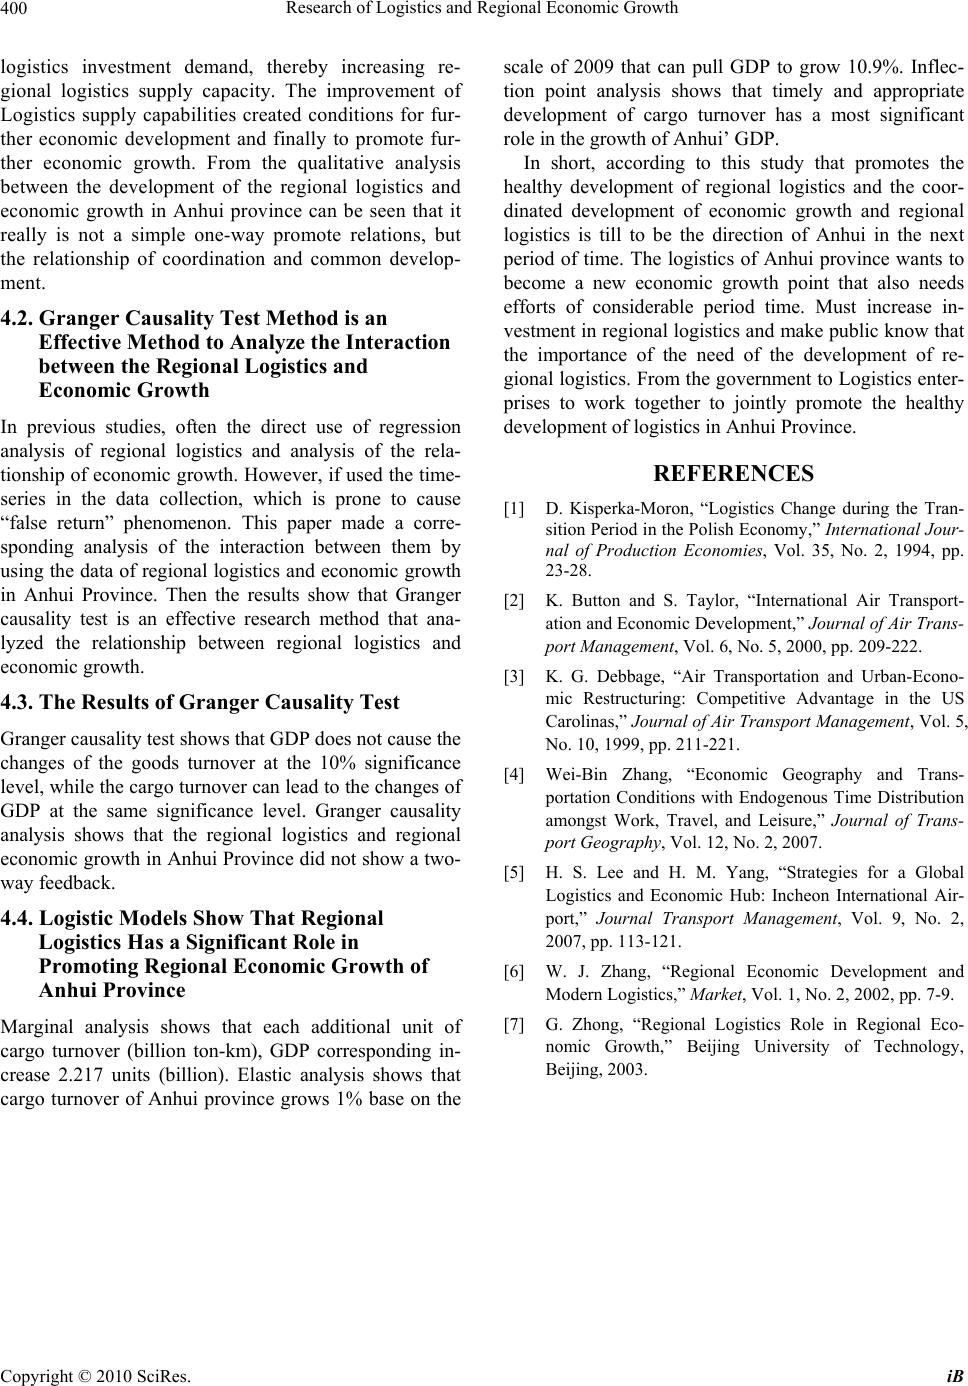 Research of Logistics and Regional Economic Growth Copyright © 2010 SciRes. iB 400 logistics investment demand, thereby increasing re- gional logistics supply capacity. The improvement of Logistics supply capabilities created conditions for fur- ther economic development and finally to promote fur- ther economic growth. From the qualitative analysis between the development of the regional logistics and economic growth in Anhui province can be seen that it really is not a simple one-way promote relations, but the relationship of coordination and common develop- ment. 4.2. Granger Causality Test Method is an Effective Method to Analyze the Interaction between the Regional Logistics and Economic Growth In previous studies, often the direct use of regression analysis of regional logistics and analysis of the rela- tionship of economic growth. However, if used the time- series in the data collection, which is prone to cause “false return” phenomenon. This paper made a corre- sponding analysis of the interaction between them by using the data of regional logistics and economic growth in Anhui Province. Then the results show that Granger causality test is an effective research method that ana- lyzed the relationship between regional logistics and economic growth. 4.3. The Results of Granger Causality Test Granger causality test shows that GDP does not cause the changes of the goods turnover at the 10% significance level, while the cargo turnover can lead to the changes of GDP at the same significance level. Granger causality analysis shows that the regional logistics and regional economic growth in Anhui Province did not show a two- way feedback. 4.4. Logistic Models Show That Regional Logistics Has a Significant Role in Promoting Regional Economic Growth of Anhui Province Marginal analysis shows that each additional unit of cargo turnover (billion ton-km), GDP corresponding in- crease 2.217 units (billion). Elastic analysis shows that cargo turnover of Anhui province grows 1% base on the scale of 2009 that can pull GDP to grow 10.9%. Inflec- tion point analysis shows that timely and appropriate development of cargo turnover has a most significant role in the growth of Anhui’ GDP. In short, according to this study that promotes the healthy development of regional logistics and the coor- dinated development of economic growth and regional logistics is till to be the direction of Anhui in the next period of time. The logistics of Anhui province wants to become a new economic growth point that also needs efforts of considerable period time. Must increase in- vestment in regional logistics and make public know that the importance of the need of the development of re- gional logistics. From the government to Logistics enter- prises to work together to jointly promote the healthy development of logistics in Anhui Province. REFERENCES [1] D. Kisperka-Moron, “Logistics Change during the Tran- sition Period in the Polish Economy,” International Jour- nal of Production Economies, Vol. 35, No. 2, 1994, pp. 23-28. [2] K. Button and S. Taylor, “International Air Transport- ation and Economic Development,” Journal of Air Trans- port Management, Vol. 6, No. 5, 2000, pp. 209-222. [3] K. G. Debbage, “Air Transportation and Urban-Econo- mic Restructuring: Competitive Advantage in the US Carolinas,” Journal of Air Transport Management, Vol. 5, No. 10, 1999, pp. 211-221. [4] Wei-Bin Zhang, “Economic Geography and Trans- portation Conditions with Endogenous Time Distribution amongst Work, Travel, and Leisure,” Journal of Trans- port Geography, Vol. 12, No. 2, 2007. [5] H. S. Lee and H. M. Yang, “Strategies for a Global Logistics and Economic Hub: Incheon International Air- port,” Journal Transport Management, Vol. 9, No. 2, 2007, pp. 113-121. [6] W. J. Zhang, “Regional Economic Development and Modern Logistics,” Market, Vol. 1, No. 2, 2002, pp. 7-9. [7] G. Zhong, “Regional Logistics Role in Regional Eco- nomic Growth,” Beijing University of Technology, Beijing, 2003. |

