Paper Menu >>
Journal Menu >>
 J. Service Science & Management, 2010, 3, 408-418 doi: 10.4236/jssm.2010.34047 Published Online December 2010 (http://www.SciRP.org/journal/jssm) Copyright © 2010 SciRes. JSSM The Impacts of Free Cash Flows and Agency Costs on Firm Performance George Yungchih Wang Department of International Business, National Kaohsiung University of Applied Sciences, Kaohsiung, Taiwan, China. Email: gwang@cc.kuas.edu.tw Received August 6th, 2010; revised October 10th, 2010; accepted November 17th, 2010. ABSTRACT This paper investigates how free cash flow (FCF) is associated with agency costs (AC), and how FCF and AC influence firm performance. The research purpose is therefore threefold. Specifically, the study is to explore the impact of FCF on AC, to re-examine the free cash flow hypothesis, and to test the agency theory based on the empirical data from Taiwan publicly-listed com panies. The study uses the variable of standard free ca sh flow to measu re FCF and six proxy variables to measure AC. It is found that FCF has a significant impact on AC with two contrary effects. On one hand, FCF could incur AC due to perquisite consumption and shirking behavior; on the other hand, the generation of FCF, resulting from internal operating efficiency, could lead to better firm performance. Excluding insignificant proxy vari- ables of AC and including only total asset turnover and operating expense ratio as sufficient AC measures, the study finds evidence to support the agency theory, meaning AC has a significantly negative impact on firm performance and stock return. In contrast, the study finds a significan tly positive relation between FCF and firm performance measures, indicating lack of evidence supporting the free cash flow hypothesis. The study provides a better understanding of the associatio n am o n g FC F, AC , a n d fi rm performance. Keywords: Agency Theory, Free Cash Flow Hypothesis, Free Cash Flows, Agency Costs, Firm Performance 1. Introduction The main purpose of business administration and finan- cial management is to pursue perpetual growth of a cor- poration such that the wealth of its stockholders could be maximized. Ever since the disastrous financial tsunami in 2008, corporate financial distresses occurred to several well-known giant enterprises, including Citibank and American International Group (AIG). The U.S. govern- ment thus initiated financial bailout projects in order to save these corporations from financial distress. To our surprise, several companies, after receiving government bailout funding, proposed enormous bonus compensation plans to the management as well as the board of directors. For instance, AIG decided to issue a bonus compensation plan amounted to $165 million dollars to senior man- agement even though the plan had been severely criti- cized by the press. This notorious case presented a di- lemma to government policy-makers whether the gov- ernment should assist these troubled companies out of corporate financial distress [1,2]. Academicians, however, examine the issue in order to find an answer for the dilemma from several different perspectives. For example, firms are suggested to im- prove their corporate governance and business ethics in order to reduce the self-interest motives of management and to avoid management’s moral hazard, while agency theory examines how management’s behavior could be directed at stockholder’s interest by reducing agency cost. According to Brush, Bromiley, and Hendrickx [3], agen- cy theory holds based on three premises: First, the goal of management is to maximize his/her personal wealth instead of stockholder’s wealth. Second, management’s self-interest motivates waste and inefficiency in the presence of free cash flows (FCF). Third, agency costs are incurred to the burden of stockholders because of weak corporate governance. The original definition of FCF, according to Jensen [4], is net cash flows of operating cash flows less capital ex- penditure, inventory cost, and dividend payment. The definition is criticized to be lack of accounting precise- ness. Dittmar [5] elaborated on FCF as net cash flows that are at the management’s discretion without affecting corporate operating activities. In the paper, FCF, accord- ing to Lehn and Poulsen [6], is defined as net operating  The Impacts of Free Cash Flows and Agency Costs on Firm Performance409 income before depreciation expenses, less tax expenses, interest expenses, and stock dividends, scaled by net sales. This study, based on the agency theory and the free cash flows hypothesis, aims to explore how free cash flows impact on agency costs and thus on firm perform- ance with the data of Taiwan publicly-listed companies. Free cash flows are the discounted value of all the oper- ating cash flows net of the needs of positive NPV pro- jects. In addition to the accounting concept, free cash flows also represent idle cash flows at the discretion of management. The free cash flows hypothesis, proposed by Jensen [4], states that management could prompt to invest unnecessary, negative NPV projects when there are too much free cash flows in the management’s hands. Furthermore, the hypothesis implies that a higher level of free cash flows would lead t to more of unnecessary ad- ministrative waste and inefficiency. Specifically, this study is directed to examine the va- lidity of the FCF hypothesis and agency theory, and the linkage between the two theories. The research purpose is therefore three-fold: First, since earlier literature sim- ply regarded FCF as agency costs (see Chung, Firth, and Kim [7,8]) and failed to build up the linkage between FCF and agency costs, the study was intended to fill up the research gap by investigating how the FCFs at man- agement’s discretion would influence agency costs. Sec- ond, since the results of empirical studies on testing the FCF hypothesis were inconsistent, the study would like to empirically test how FCF would impact on firm per- formance by using the data of public-listed companies on Taiwan Stock Exchanges (TWSE). Third, we would also like to re-examine the agency theory by testing how other agency costs would influence firm performance. The rest of the paper is organized as follows: Section 2 reviews the literature on the free cash flows hypothesis and the agency theory. Section 3 presents the research methodology, the hypotheses, and the testing models. Section 4 presents our statistical results. Section 5 pro- vides concluding remarks. 2. Literature Review 2.1. The Free Cash Flows Hypothesis Although the first complete study regarding the agency theory was conducted by Jensen and Meckling [9], yet the idea of FCF was originally proposed by Jensen [4], in which FCF is defined as net cash flows after deducting the needs of positive NPV projects. Since FCF is finan- cial resources at the management’s discretion to allocate, it is also called idle cash flows. Jensen [4] argued that too much FCF would result in internal insufficiency and the waste of corporate resources, thus leading to agency costs as a burden of stockholder’s wealth. Jensen [10] empirically examined the agency problem and thus as- serted that FCF was accused of the main reason why the investment return in the US companies fell below the required rate of return in 1980s. In additional to FCF, Jensen [10-13] argued that the self-interest motive of management was an important factor leading to agency costs. This was especially obvi- ous when stockholder’s and management’s interests were in conflict, and consequently stockholder’s interest was always dominated by management’s. Brush et al. [3] asserted that weak corporate governance caused the inef- ficiency in the allocation of free cash flows since the corporate board of directors was directed at the policies in favor of management’s interest at the expense of stockholder’s wealth. The FCF hypothesis states that when a company has generated an excessive surplus of FCF and there are not profitable investment opportunities available, manage- ment tends to abuse the FCF in hands so as to resulting in an increase in agency costs, inefficient resource alloca- tion, and wrongful investment. Brush et al. [3] found that sales growth was most beneficial to companies being lack of cash flows, but not necessarily to companies with sufficient FCF and thus supported the FCF hypothesis. Chung et al. [7] also found that excessive FCF might have a negative impact on corporate profitability and stock valuation and thus suggested the control hypothesis of institutional investors. Not all empirical evidence supported the FCF hy- pothesis. For instance, Gregory [14] examined how FCF influences merger performance based on the UK data and found that mergers with a higher level of FCF would perform better than those with a lower FCF level as evi- dence invalidating the FCF hypothesis. In addition, the studies conducted by Szewcyzk, Tsetsekos, and Zantout [15] and Chang, Chen, Hsing, and Huang [16] discovered empirical evidence in support of the investment opportu- nity hypothesis that investors would most favor compa- nies with both substantial FCF and profitable investment opportunities in stock valuation. 2.2. Agency Costs The agency problem was originally raised by Berle and Means [17] who argued that agency costs might be in- curred in the separation of ownership and control due to inconsistent interests of management and stockholders. Jensen and Meckling [9] suggested that the incomplete contractual relationship between the principal (stock- holders) and the agent (management) might cause the agency problem. In general, the agency problem caused by management would cause a loss in stockholders’ wealth in the following ways: First, management, from Copyright © 2010 SciRes. JSSM 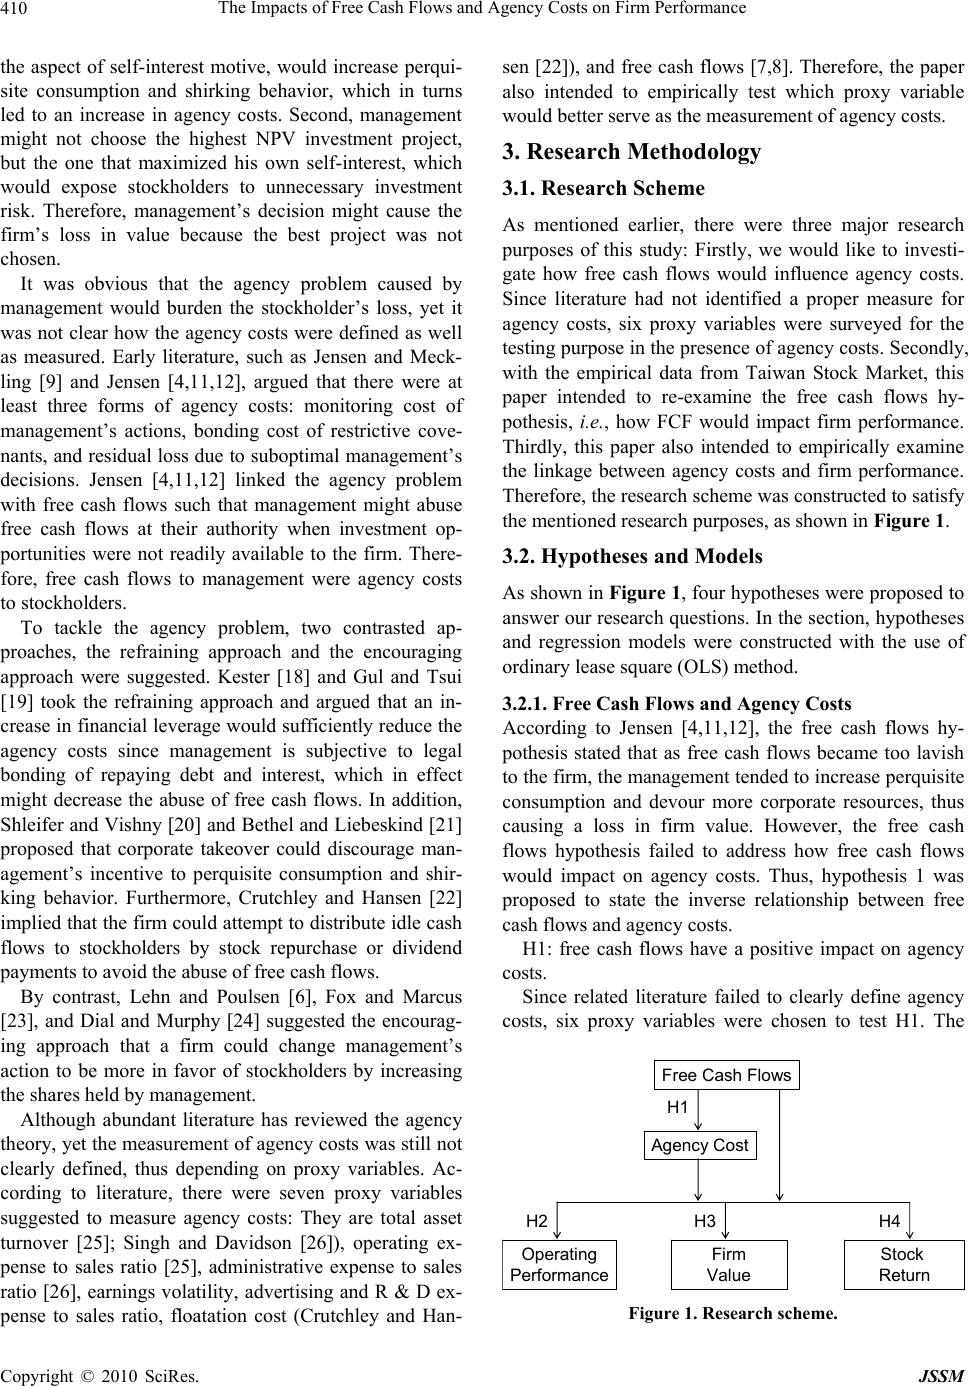 The Impacts of Free Cash Flows and Agency Costs on Firm Performance 410 the aspect of self-interest motive, would increase perqui- site consumption and shirking behavior, which in turns led to an increase in agency costs. Second, management might not choose the highest NPV investment project, but the one that maximized his own self-interest, which would expose stockholders to unnecessary investment risk. Therefore, management’s decision might cause the firm’s loss in value because the best project was not chosen. It was obvious that the agency problem caused by management would burden the stockholder’s loss, yet it was not clear how the agency costs were defined as well as measured. Early literature, such as Jensen and Meck- ling [9] and Jensen [4,11,12], argued that there were at least three forms of agency costs: monitoring cost of management’s actions, bonding cost of restrictive cove- nants, and residual loss due to suboptimal management’s decisions. Jensen [4,11,12] linked the agency problem with free cash flows such that management might abuse free cash flows at their authority when investment op- portunities were not readily available to the firm. There- fore, free cash flows to management were agency costs to stockholders. To tackle the agency problem, two contrasted ap- proaches, the refraining approach and the encouraging approach were suggested. Kester [18] and Gul and Tsui [19] took the refraining approach and argued that an in- crease in financial leverage would sufficiently reduce the agency costs since management is subjective to legal bonding of repaying debt and interest, which in effect might decrease the abuse of free cash flows. In addition, Shleifer and Vishny [20] and Bethel and Liebeskind [21] proposed that corporate takeover could discourage man- agement’s incentive to perquisite consumption and shir- king behavior. Furthermore, Crutchley and Hansen [22] implied that the firm could attempt to distribute idle cash flows to stockholders by stock repurchase or dividend payments to avoid the abuse of free cash flows. By contrast, Lehn and Poulsen [6], Fox and Marcus [23], and Dial and Murphy [24] suggested the encourag- ing approach that a firm could change management’s action to be more in favor of stockholders by increasing the shares held by management. Although abundant literature has reviewed the agency theory, yet the measurement of agency costs was still not clearly defined, thus depending on proxy variables. Ac- cording to literature, there were seven proxy variables suggested to measure agency costs: They are total asset turnover [25]; Singh and Davidson [26]), operating ex- pense to sales ratio [25], administrative expense to sales ratio [26], earnings volatility, advertising and R & D ex- pense to sales ratio, floatation cost (Crutchley and Han- sen [22]), and free cash flows [7,8]. Therefore, the paper also intended to empirically test which proxy variable would better serve as the measurement of agency costs. 3. Research Methodology 3.1. Research Scheme As mentioned earlier, there were three major research purposes of this study: Firstly, we would like to investi- gate how free cash flows would influence agency costs. Since literature had not identified a proper measure for agency costs, six proxy variables were surveyed for the testing purpose in the presence of agency costs. Secondly, with the empirical data from Taiwan Stock Market, this paper intended to re-examine the free cash flows hy- pothesis, i.e., how FCF would impact firm performance. Thirdly, this paper also intended to empirically examine the linkage between agency costs and firm performance. Therefore, the research scheme was constructed to satisfy the mentioned research purposes, as shown in Figure 1. 3.2. Hypotheses and Models As shown in Figure 1, four hypotheses were proposed to answer our research questions. In the section, hypotheses and regression models were constructed with the use of ordinary lease square (OLS) method. 3.2.1. Free Cash Flows and Agency Costs According to Jensen [4,11,12], the free cash flows hy- pothesis stated that as free cash flows became too lavish to the firm, the management tended to increase perquisite consumption and devour more corporate resources, thus causing a loss in firm value. However, the free cash flows hypothesis failed to address how free cash flows would impact on agency costs. Thus, hypothesis 1 was proposed to state the inverse relationship between free cash flows and agency costs. H1: free cash flows have a positive impact on agency costs. Since related literature failed to clearly define agency costs, six proxy variables were chosen to test H1. The Agency Cost Operating Performance Firm Value Stock Return H1 H4H3H2 Free Cash Flows Figure 1. Research scheme. Copyright © 2010 SciRes. JSSM  The Impacts of Free Cash Flows and Agency Costs on Firm Performance411 tt regression models were therefore constructed as follows: 01 123ttt AssTFCFSize DA tt (1) 01 123ttt OpeRFCFSize DA tt (2) 01 123ttt AdmTFCFSize DA t (3) 01 123ttt ARDRFCFSizeDA t tt (4) 01 123ttt NOIVolFCFSizeDA tt (5) 01 123ttt NIVolFCFSizeDA t t (6) where FCFt-1 denotes free cash flows at time t-1, AssTt denotes total asset turnover at time t, OpeRt denotes operating expense ratio at time t, AdmRt denotes administrative expense ratio at time t, ARDRt denotes advertising and R & D expense ratio at time t, NOIVolt denotes volatility of net operating income at time t, NIVolt denotes volatility of net income at time t, Sizet denotes firm size at time t, a control variable, and DAt denotes debt ratio at time t, a control variable. 3.2.2. The Impacts on Firm Performance According to the free cash flows hypothesis and the agency theory, free cash flows and agency costs had a negative impact on firm performance. Recent empirical studies also supported this argument. For example, Lang et al. [27] examined 101 merger cases and found that free cash flows might deteriorate the q ratio of a firm in mer- gers and acquisitions. Chung et al. [7] found that free cash flows might incur agency costs so as to inversely influence short-term operating cash flows, thus under- mining long-term firm value. Chang et al. [16] found evidence to support a significant inverse relationship between free cash flows and stock returns. This study therefore hypothesized that free cash flows and agency costs had a negative impact on operating performance, firm value, and stock return. To test the hypotheses, re- turn on assets (ROA) and return on equity (ROE) were chosen to proxy for operating performance, and Tobin’s q ratio for firm value. The hypotheses and regression models were constructed as follows: H2: Free cash flows and agency costs have a negative impact on operating performance. 01 123 45 6 789 ttt tt tttt ROEFCFAssT OpeR A dmR ARDR NOIVol NIVol Size DA (7) 01 123 45 6 789 ttt tt tttt ROAFCFAssT OpeR H3: Free cash flows and agency costs have a negative impact on firm value. 01 123 45 6 78910 tttt tt t ttt t qFCFAssTOpeR AdmR ARDR NOIVol NIVolRmSizeDA t (9) where Rmt denotes market return at time t, a control va- riable. H4: Free cash flows and agency costs have a negative impact on stock return. 01 123 45 6 78910 tttt tt t ttt t RiFCFAssT OpeR AdmR ARDR NOIVol NIVolRmSizeDAt (10) 3.3. Variable Definition In the sub-section, the specifications and definitions of all the variables in the regression models are discussed. 3.3.1. Independent Variables 3.3.1.1. Free Cash Flows (FCF) According to Lehn and Poulsen [6] and Lang et al. [27], free cash flows could be defined as operating net income before depreciation expense, less corporate income tax, interest expenses, and cash dividends. The advantage of the definition was that it indicated how much the ac- tual free cash flows were available for management to exercise. Under the consideration of firm size, free cash flows were scaled by net sales (Lehn and Poulsen [6]; Gul and Tsui [19,28]). The standardized free cash flows were expressed as follows: -- -- tttt tt OCFTax IExpCDiv PDiv FCF Sales t (11) where OCF denotes operating cash flows, Tax corporate income tax expense, IExp interest expense, CDiv common stock dividends, PDiv preferred stock dividends, and Sales net sales. 3.3.1.2. Agency Costs t t A dmR ARDR NOIVol NIVolSize DA (8) As mentioned earlier, literature showed that there are seven proxy variables for agency costs, i.e., total asset turnover, operating expense to sales ratio, administrative expense to sales ratio, advertising and R&D expenses to sales ratio, volatility of net operating income, volatility of net income, and flotation cost ratio. Since flotation cost was not available in the Taiwan Economic Journal Database, the other six variables were chosen to measure agency costs. It is important to note that total asset turn- over is the only inverse proxy variable for agency costs, meaning that agency costs increase as total asset turnover decreases. The six proxy variables are defined as follows: Copyright © 2010 SciRes. JSSM  The Impacts of Free Cash Flows and Agency Costs on Firm Performance 412 t tt Sales AssT A ssets (12) where AssTt denotes total asset turnover, Sales net sales, and Assets total assets. t tt OpeE OpeR Sales (13) where OpeR denotes operating expense ratio and OpeE operating expenses. t tt A dmE AdmR Sales (14) where AdmR denotes administrative expense ratio and AdmE administrative expense. t tt A RDE ARDR Sales (15) where ARDR denotes advertising and R&D expense ratio and ARDE advertising and R&D expenses. t tt NOI NOIVolSTD Sales (16) where NOIVol denotes volatility of net operating income, NOI net operating income, and STD standard deviation. t tt NI NIVolSTD Sales (17) where NIVol denotes volatility of net income and NI net income. 3.3.2. Depe ndent Variables 3.3.2.1. Operating Performance Return on asset (ROA) and return on equity (ROE) are the most commonly adopted measures for corporate op- erating performance [29-32]. The former demonstrates firm performance on total assets, while the latter meas- ures the return for stockholders. ROA and ROE are de- fined as follows, respectfully: 1 1 2 t ttt NI ROA A sset Asset (18) t tt NI ROE Equity (19) where Equity denotes equity. 3.3.2.2. Firm Value Empirically, Tobin’s q ratio is commonly suggested as a proxy for firm value, as shown in Lang et al. [27] and Fama and French [33]. The q ratio is defined as follows: tt tt t M VA PSDebt qTAB (20) where MVA denotes market value of common equity, PS market value of preferred equity, Debt book value of debt, and TAB book value of total assets. 3.3.2.3. Stock Return Stock return is calculated as the holding period return from time t-1 to t, expressed as follows: 1 1 tt tt PP Ri P (21) where, Ri denotes stock return and P stock price. 3.3.3. Cont rol Variables According to literature, four commonly used control va- riables were chosen to control their influences on de- pendent variables. Demsetz and Lehn [34] argued that a larger firm may lead to a higher firm value since more available corporate resources are transformed into out- puts. Fama and French [35] suggested that there is a pos- itive relationship between firm size and firm performance. More studies supporting the effect of firm size could be seen in Gul and Tsui [19], Grullon and Michaely [36], and Singh and Davidson [26]. For empirical purpose, firm size is defined as follows: ln t Size Sales t (22) In addition, to control how financial leverage could in- fluence firm performance, the debt ratio is also included in the regression models. (Myers [37]; Easterbrook [38]) t tt Debt DA A sset (23) where DA denotes debt ratio and Debt total debt. To control the impact of systematic risk on market value of a firm, market return is also introduced accord- ing to Fama and French [39]. Market return is defined as follows: 1 1 tt tt X X Rm X (24) where X denotes market index. 4. Regression Results 4.1. Descriptive Statistics and Correlations To test the hypotheses, the data are based on all the pub- licly listed companies on Taiwan Stock Exchange. The main data is collected from Taiwan Stock Exchange and Taiwan Economic Journal. After the deletion of incom- plete company data, 505 companies are selected for the time period ranging from Years 2002 to 2007. Table 1 Copyright © 2010 SciRes. JSSM  The Impacts of Free Cash Flows and Agency Costs on Firm Performance413 provides descriptive statistics for data screening. For the purpose of checking correlations and multicol- linearity, Table 2 provides the Pearson correlation matrix. As seen from Table 2, there appears no significant high correlation between independent variables. To further check the problem of multicollinearity, the value of va- riance inflation factor (VIF) is also computed and dis- played in the regression results in the next sub-section. Since none of the VIF values exceeds 10, there appears no multicollinearity between independent variables. 4.2. Regression Analysis For testing H1, six regression models, i.e., Equations (1)-(6), are conducted and the results are displayed in Table 3. As shown in Table 3, all the six models indicate a significant goodness of fit. Also, it can be found that FCF has a significantly negative impact on total asset turnover, operating expense ratio, and administrative expense ratio. Although the sign of total asset turnover appears to be negative as expected, yet those of operating expense ratio and administrative expense ratio are incon- sistent with the free cash flows hypothesis. It is therefore argued that free cash flows could have a contrary effect on agency costs. On one hand, the increase in free cash flows could lead to an increase in agency cost, e.g., an inefficiency of asset usage. The increase in free cash flows, on the other hand, could be the result of efficient expenditure management such that free cash flows are inversely related to both expense ratios. The result in Table 3 finds no evidence in supporting the free cash flows hypothesis. For testing how free cash flows and agency costs in- fluence operating performance asin H2, Table 4 displays the regression results based on the models in Equations (7) and (8). As shown in Table 4, the F statistics of both models are 255.814 (p < 0.01) and 272.629 (p < 0.01), indicating a significant goodness of fit. The FCF variable is found to be significantly, positively associated with both ROA and ROE, indicating no evidence for the free cash flows hypothesis. Among the six proxy variables of agency costs, total asset turnover, operating expense ratio, and administrative expense ratio are statistically signifi- cant to operating performance, while only the former two variables are consistent with the expectation of the agency theory. Thus, if higher agency costs would un- dermine a form’s operating performance, total asset turnover and operating expense ratio would be better measures for agency costs. For testing H3, the regression result based on Equation (9) is displayed in Table 5. As seen from Table 5, F sta- tistic is estimated to be 73.853 (p < 0.01), indicating a significant goodness of fit. The FCF variable is found to be positively related firm value, lack of evidence sup- porting the free cash flows hypothesis. Among the proxy variables of agency costs, AssT, OpeR, AdmR, and ARDR are statistically significant to firm value, while only the former two variables are consistent with the ex- pectation of the agency theory. For testing H4, the regression result based on Equation (10) is displayed in Table 6. As seen from Table 6, F statistic is estimated to be 25.284 (p < 0.01), indicating a significant goodness of fit. The FCF variable is found to be positively related to firm value, lack of evidence supporting the free cash flows hypothesis. Among the proxy variables of agency costs, AssT, OpeR, ARDR, and AdmR are statistically significant to firm value, while the former three variables are consistent with the expectation of the agency theory. To sum up, Table 7 provides a summary table to indi- cate the statistical significance of all the independence variables. There are two major points that can be drawn from Table 7. Firstly, all the results reveal no evidence to support the free cash flows hypothesis, since FCF is positively related to operation performance, firm value, and stock return of a firm. The findings are consistent with those in Gregory [14] and Chang et al. [16]. Sec- ondly, total asset turnover and operating expense ratio are found to be significantly consistent with the agency theory. Since all the proxy variables neither support nor negate the agency theory, it is difficult to make a conclu- sion based on the evidence. However, if agency costs actually have a negative impact on firm performance as suggested in Ang et al. [25] and Singh and Davidson [26], total asset turn over and operating expense ratio would be better measures for agency costs since other proxy vari- ables would generate inconsistent, contrary association with firm performance measures. 5. Conclusions Ever since Jensen and Mecking (1976) elaborated on the agency theory arguing that the self-interest motive of management could incur agency costs burdening the wealth of stockholders, the study of agency theory has been an important subject in corporate finance. The free cash flows hypothesis proposed by Jensen [11,12] further extended the knowledge regarding the agent’s behavior, while neither the relationship between free cash flows and agency costs was clearly addressed, nor the measures for agency costs were properly identified by academia. Therefore, the study aimed to empirically examine the relationship between free cash flows and agency costs, and to test both the free cash flows hypothesis and the agency theory. With the data of publicly listed companies on Taiwan Stock Exchange, there are three major points drawn from he evidence presented in the study. First, there are t Copyright © 2010 SciRes. JSSM  The Impacts of Free Cash Flows and Agency Costs on Firm Performance Copyright © 2010 SciRes. JSSM 414 Table 1. Descriptive statistics. Variables Mean Median S.D. Min Max FCF 0.0805 0.0704 0.1741 –4.0062 2.0136 AssT 0.8750 0.7600 0.5015 0.0200 3.3900 OpeR 0.9413 0.9502 0.1245 0.4082 3.2281 AdmR 0.0274 0.0071 0.0393 0.0000 0.1669 ARDR 0.1444 0.1172 0.1229 0.0000 0.5442 NOIVol 0.4502 0.4711 0.6312 0.1020 1.5673 Independent Variables NIVol 0.4128 0.4354 0.5562 0.0912 1.3445 Size 15.0661 14.8908 1.3698 9.9951 20.1955 DA 0.3863 0.3853 0.1530 0.0187 0.9268 PER 19.9376 12.0250 40.2067 0.0000 469.9000 Control Variables Rm 0.1428 0.0872 0.1041 0.0423 0.3230 ROE 0.0869 0.0954 0.1456 –0.9963 0.5405 ROA 0.0828 0.0786 0.0782 –0.2558 0.4155 q 0.8425 0.6960 0.6015 –0.1715 6.1749 Dependent Variables Ri 0.1959 0.1037 0.4719 –0.8122 2.4404 Table 2. Pearson correlation matrix. Vari- ables FCF AssT OpeR AdmR ARDR NOIVolNIVolSize DA PERRm ROE ROA q Ri FCF 1 AssT –0.1275 ** 1 OpeR –0.4860 ** –0.0477 * 1 AdmR –0.3212 * –0.1221 ** 0.4358 ** 1 ARDR 0.2312 –0.1711 ** 0.3212 * 0.000 1 NOIVol 0.0423 –0.0734 0.2313–0.013 0.083 ** 1 NIVol 0.1312 * –0.1769 0.32420.01 0.020 0.0251 Size 0.1422 ** 0.3093 ** –0.1508 ** –0.2375 * 0.2405 ** 0.1232 * –0.1832 * 1 DA –0.2573 ** 0.2320 ** 0.3600 ** 0.4212 –0.1264 –0.0768–0.2202 0.1589 ** 1 PER –0.0333 –0.0444 * 0.02990.1253 –0.3241 * –0.1056 0.1076 –0.0391 * –0.0490 * 1 Rm –0.0147 –0.0477 * 0.0240 ** –0.2758 0.3245 ** 0.1465 0.2378 * –0.0530 ** 0.0142 0.0609 ** 1 ROE 0.3638 ** 0.2182 ** –0.6233 ** 0.3243 ** 0.2532 –0.2650 * 0.3345 ** 0.2365 ** –0.2533 ** –0.0338–0.00151 ROA 0.4272 ** 0.1300 ** –0.6687 ** 0.2759 ** 0.3783 ** –0.2104 ** 0.2987 ** 0.2378 ** –0.3178 ** –0.0740 ** –0.0131 0.8763 ** 1 q 0.2772 ** –0.0240 –0.4140 ** –0.1254 0.3524 0.0816 0.2312*0.1292* * –0.2943 ** –0.0074 0.0801 ** 0.4849 ** 0.6173 ** 1 Ri 0.0147 0.0211 –0.1440 ** –0.0213 0.2462 –0.1657–0.3867 0.0321–0.0092 0.03250.2497 ** 0.2978 ** 0.2806 ** 0.3508 ** 1 Note: * indicates p < 0.10; ** indicates p < 0.05. 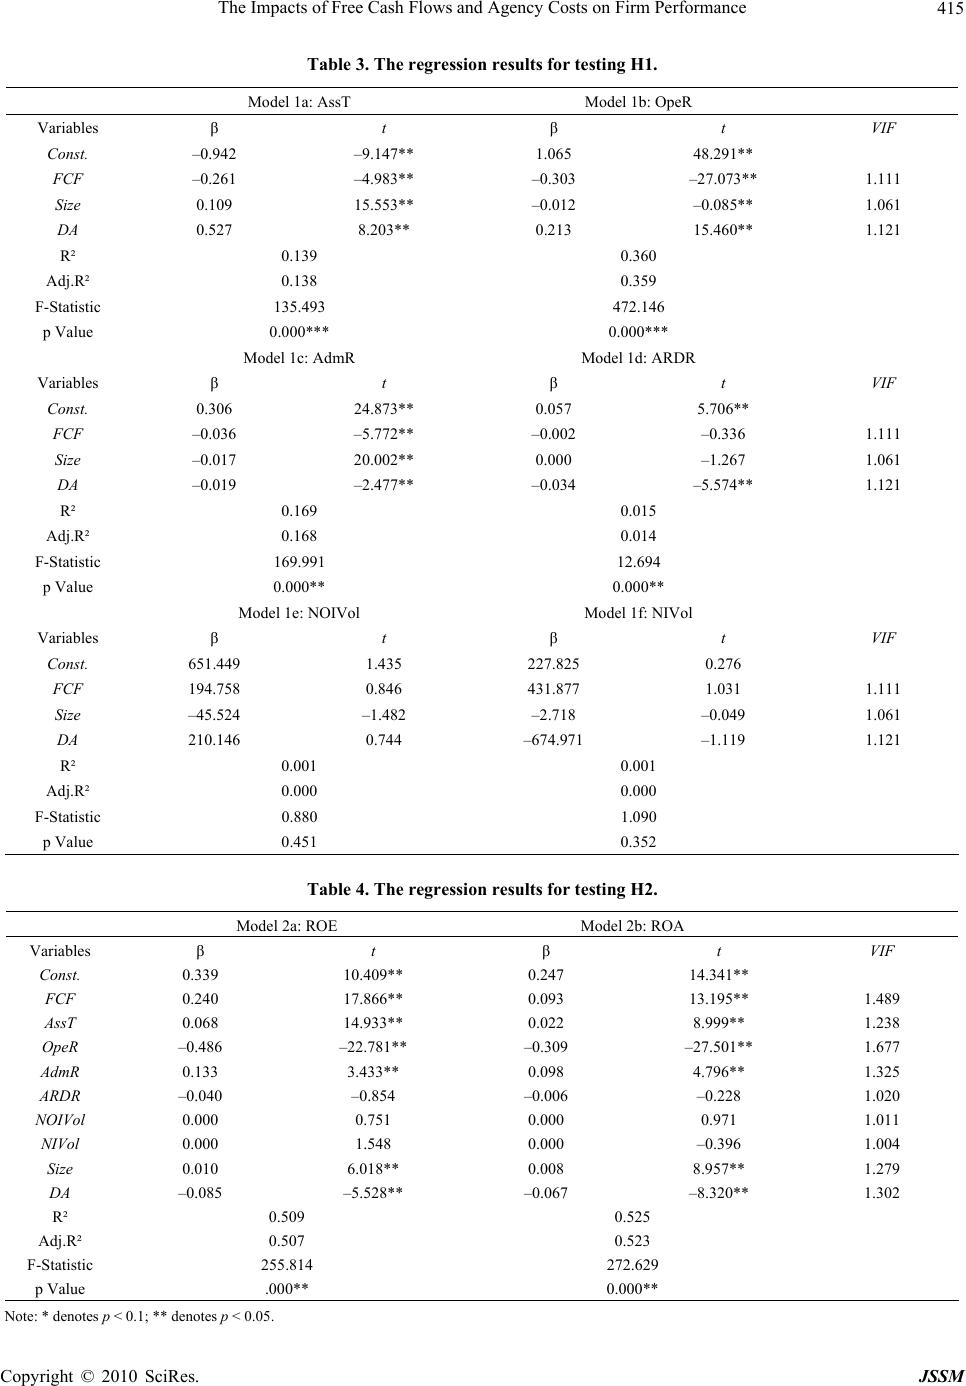 The Impacts of Free Cash Flows and Agency Costs on Firm Performance415 Table 3. The regression results for testing H1. Model 1a: AssT Model 1b: OpeR Variables β t β t VIF Const. –0.942 –9.147** 1.065 48.291** FCF –0.261 –4.983** –0.303 –27.073** 1.111 Size 0.109 15.553** –0.012 –0.085** 1.061 DA 0.527 8.203** 0.213 15.460** 1.121 R² 0.139 0.360 Adj.R² 0.138 0.359 F-Statistic 135.493 472.146 p Value 0.000*** 0.000*** Model 1c: AdmR Model 1d: ARDR Variables β t β t VIF Const. 0.306 24.873** 0.057 5.706** FCF –0.036 –5.772** –0.002 –0.336 1.111 Size –0.017 20.002** 0.000 –1.267 1.061 DA –0.019 –2.477** –0.034 –5.574** 1.121 R² 0.169 0.015 Adj.R² 0.168 0.014 F-Statistic 169.991 12.694 p Value 0.000** 0.000** Model 1e: NOIVol Model 1f: NIVol Variables β t β t VIF Const. 651.449 1.435 227.825 0.276 FCF 194.758 0.846 431.877 1.031 1.111 Size –45.524 –1.482 –2.718 –0.049 1.061 DA 210.146 0.744 –674.971 –1.119 1.121 R² 0.001 0.001 Adj.R² 0.000 0.000 F-Statistic 0.880 1.090 p Value 0.451 0.352 Table 4. The regression results for testing H2. Model 2a: ROE Model 2b: ROA Variables β t β t VIF Const. 0.339 10.409** 0.247 14.341** FCF 0.240 17.866** 0.093 13.195** 1.489 AssT 0.068 14.933** 0.022 8.999** 1.238 OpeR –0.486 –22.781** –0.309 –27.501** 1.677 AdmR 0.133 3.433** 0.098 4.796** 1.325 ARDR –0.040 –0.854 –0.006 –0.228 1.020 NOIVol 0.000 0.751 0.000 0.971 1.011 NIVol 0.000 1.548 0.000 –0.396 1.004 Size 0.010 6.018** 0.008 8.957** 1.279 DA –0.085 –5.528** –0.067 –8.320** 1.302 R² 0.509 0.525 Adj.R² 0.507 0.523 F-Statistic 255.814 272.629 p Value .000** 0.000** Note: * denotes p < 0.1; ** denotes p < 0.05. Copyright © 2010 SciRes. JSSM  The Impacts of Free Cash Flows and Agency Costs on Firm Performance 416 Table 5. The regression results for testing H3. Model 3: q Variables β t VIF Const. 1.354 8.167** FCF 0.136 2.001** 1.493 AssT 0.017 2.321** 1.240 OpeR –1.662 –15.345** 1.678 AdmR 1.718 8.743** 1.326 ARDR 0.859 3.642** 1.020 NOIVol –0.000 –0.245 1.011 NIVol –0.000 –1.247 1.007 Rm 0.563 5.588** 1.013 Size 0.073 8.442** 1.282 DA –0.662 –8.526** 1.303 R² 0.248 Adj.R² 0.244 F-Statistic 73.853 p Value 0.000** Note: * denotes p < 0.1; ** denotes p < 0.05. Table 6. The regression results for testing H4. Model 4: Ri Variables β t VIF Const. 0.232 1.632 FCF 0.376 6.437** 1.496 AssT 0.042 2.125** 1.240 OpeR –0.363 –3.901** 1.685 AdmR 0.312 1.853* 1.327 ARDR –0.532 –2.627** 1.021 NOIVol 0.000 0.024 1.011 NIVol –0.000 –1.027 1.007 Rm 1.131 13.058** 1.016 Size 0.001 0.161 1.283 DA 0.138 2.068** 1.306 PER 0.000 1.178 1.013 R² 0.110 Adj.R² 0.105 F-Statistic 25.284 p Value 0.000** Note: * denotes p < 0.1; ** denotes p < 0.05. Copyright © 2010 SciRes. JSSM 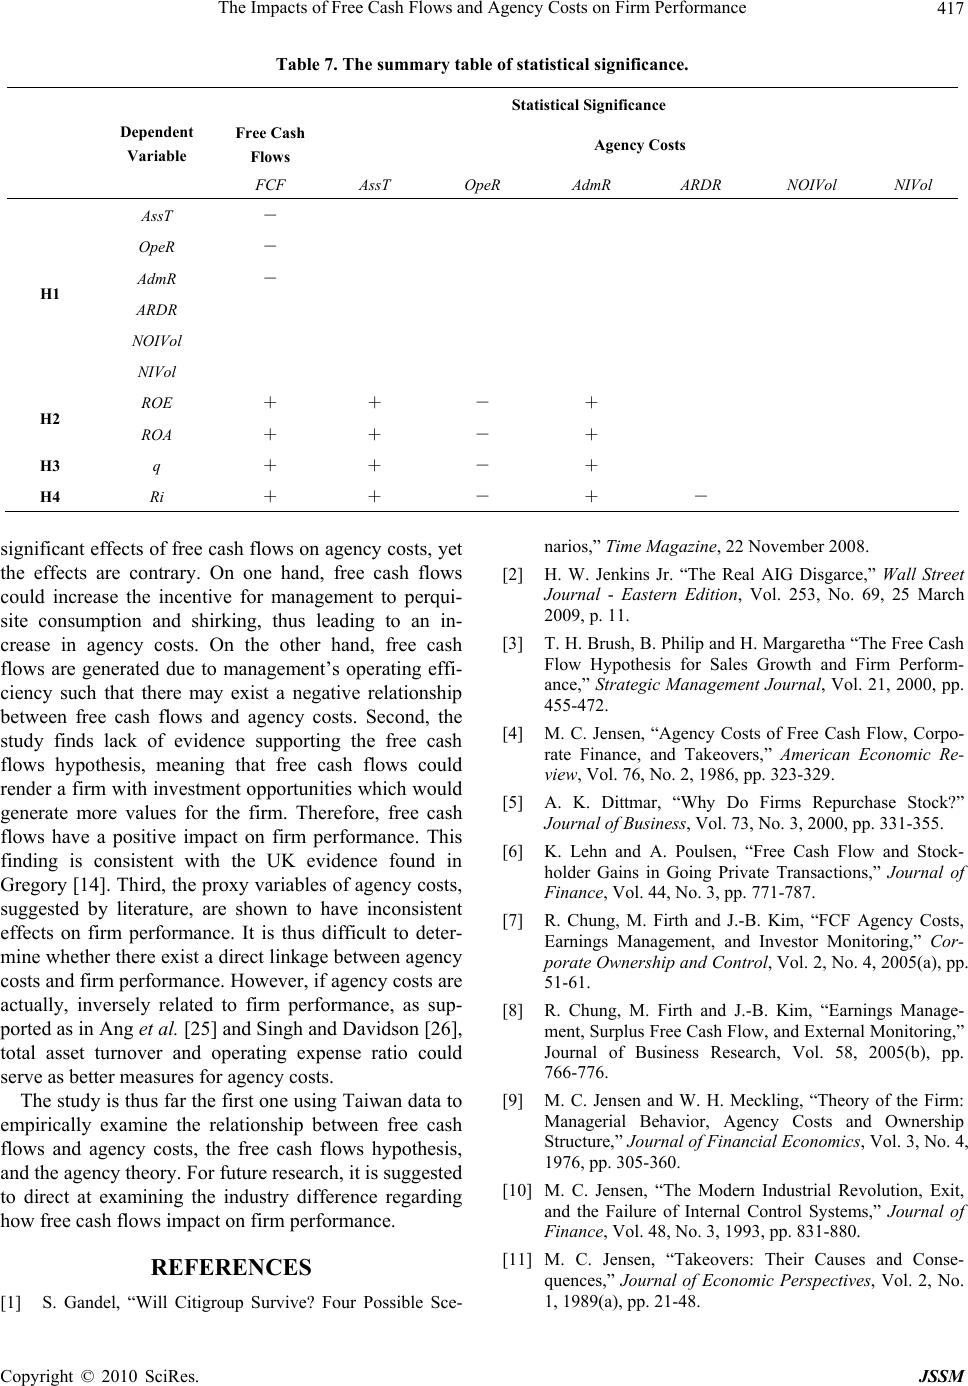 The Impacts of Free Cash Flows and Agency Costs on Firm Performance Copyright © 2010 SciRes. JSSM 417 Table 7. The summary table of statistical significance. Statistical Significance Free Cash Flows Agency Costs Dependent Variable FCF AssT OpeR AdmR ARDR NOIVol NIVol AssT - OpeR - AdmR - ARDR NOIVol H1 NIVol ROE + + - + H2 ROA + + - + H3 q + + - + H4 Ri + + - + - significant effects of free cash flows on agency costs, yet the effects are contrary. On one hand, free cash flows could increase the incentive for management to perqui- site consumption and shirking, thus leading to an in- crease in agency costs. On the other hand, free cash flows are generated due to management’s operating effi- ciency such that there may exist a negative relationship between free cash flows and agency costs. Second, the study finds lack of evidence supporting the free cash flows hypothesis, meaning that free cash flows could render a firm with investment opportunities which would generate more values for the firm. Therefore, free cash flows have a positive impact on firm performance. This finding is consistent with the UK evidence found in Gregory [14]. Third, the proxy variables of agency costs, suggested by literature, are shown to have inconsistent effects on firm performance. It is thus difficult to deter- mine whether there exist a direct linkage between agency costs and firm performance. However, if agency costs are actually, inversely related to firm performance, as sup- ported as in Ang et al. [25] and Singh and Davidson [26], total asset turnover and operating expense ratio could serve as better measures for agency costs. The study is thus far the first one using Taiwan data to empirically examine the relationship between free cash flows and agency costs, the free cash flows hypothesis, and the agency theory. For future research, it is suggested to direct at examining the industry difference regarding how free cash flows impact on firm performance. REFERENCES [1] S. Gandel, “Will Citigroup Survive? Four Possible Sce- narios,” Time Magazine, 22 November 2008. [2] H. W. Jenkins Jr. “The Real AIG Disgarce,” Wall Street Journal - Eastern Edition, Vol. 253, No. 69, 25 March 2009, p. 11. [3] T. H. Brush, B. Philip and H. Margaretha “The Free Cash Flow Hypothesis for Sales Growth and Firm Perform- ance,” Strategic Management Journal, Vol. 21, 2000, pp. 455-472. [4] M. C. Jensen, “Agency Costs of Free Cash Flow, Corpo- rate Finance, and Takeovers,” American Economic Re- view, Vol. 76, No. 2, 1986, pp. 323-329. [5] A. K. Dittmar, “Why Do Firms Repurchase Stock?” Journal of Business, Vol. 73, No. 3, 2000, pp. 331-355. [6] K. Lehn and A. Poulsen, “Free Cash Flow and Stock- holder Gains in Going Private Transactions,” Journal of Finance, Vol. 44, No. 3, pp. 771-787. [7] R. Chung, M. Firth and J.-B. Kim, “FCF Agency Costs, Earnings Management, and Investor Monitoring,” Cor- porate Ownership and Control, Vol. 2, No. 4, 2005(a), pp. 51-61. [8] R. Chung, M. Firth and J.-B. Kim, “Earnings Manage- ment, Surplus Free Cash Flow, and External Monitoring,” Journal of Business Research, Vol. 58, 2005(b), pp. 766-776. [9] M. C. Jensen and W. H. Meckling, “Theory of the Firm: Managerial Behavior, Agency Costs and Ownership Structure,” Journal of Financial Economics, Vol. 3, No. 4, 1976, pp. 305-360. [10] M. C. Jensen, “The Modern Industrial Revolution, Exit, and the Failure of Internal Control Systems,” Journal of Finance, Vol. 48, No. 3, 1993, pp. 831-880. [11] M. C. Jensen, “Takeovers: Their Causes and Conse- quences,” Journal of Economic Perspectives, Vol. 2, No. 1, 1989(a), pp. 21-48.  The Impacts of Free Cash Flows and Agency Costs on Firm Performance 418 [12] M. C. Jensen, “Eclipse of the Public Corporation,” Har- vard Business Review, Vol. 67, No. 5, 1989(b), pp. 61-74. [13] M. C. Jensen, “Corporate Control and the Politics of Fi- nance,” Journal of Applied Corporate Finance, Vol. 2, No. 2, 1991, pp. 35-44. [14] A. Gregory, “The Long Run Abnormal Performance of UK Acquirers and the Free Cash Flow Hypothesis,” Journal of Business Finance & Accounting, Vol. 32, No. 5, 2005, pp. 777-814. [15] S. H. Szewczyk, G. P. Tsetsekos and Z. Zantout, “The Valuation of Corporate R&D Expenditures: Evidence from Investment Opportunities and Free Cash Flow,” Fi- nancial Management, Vol. 25, No. 1, 1996, pp. 105-110. [16] S.-C. Chang, S.-S. Chen, A. Hsing and C. W. Huang, “Investment Opportunities, Free Cash Flow, and Stock Valuation Effects of Secured Debt Offerings,” Review of Quantitative Finance and Accounting, Vol. 28, No. 4, 2007, pp. 123-145. [17] A. A. Berle and G. C. Means, “The Modern Corporation and Private Property,” Macmillan, New York, 1932. [18] W. C. Kester, “Capital and Ownership Structure: A Comparison of Capital United States and Japanese Man- ufacturing Corporations,” Financial Management, Vol. 15. No. 1, 1986, pp. 5-16. [19] F. A. Gul and S. L. T. Judy, “A Test of the Free Cash Flow and Debt Monitoring Hypotheses: Evidence from Audit Pricing,” Journal of Accounting and Economics, Vol. 24, No. 2, 1998, pp. 219-237. [20] A. Shleifer and R. Vishny, “Takeovers in the 60s and the 80s: Evidence and Implications,” Strategic Management Journal, Vol. 12, 1991, pp. 51-59. [21] J. E. Bethel and J. Liebeskind, “The Effects of Ownership Structure on Corporate Restructuring,” Strategic Man- agement Journal, Vol. 14, 1993, pp. 15-31. [22] C. E. Crutchley and R. S. Hansen, “A Test of the Agency Theory of Managerial Ownership, Corporate Leverage, and Corporate Dividends,” Financial Management, Vol. 18, No. 5, 1989, pp. 36-46. [23] I. Fox and A. Marcus, “The Causes and Consequences of Leveraged Management Buyouts,” Academy of Manage- ment Review, Vol. 17, 1992, pp. 62-85. [24] J. Dial and K. Murphy, “Incentives, Downsizing and Value Creation at General Dynamics,” Journal of Finan- cial Economics, Vol. 37, No. 3, pp. 261-314. [25] J. S. Ang, R. A. Cole and J. W. Lin, “Agency Costs and Ownership Structure,” Journal of Finance, Vol. 55, No. 1, 2000, pp. 81-106. [26] M. Singh and W. N. Davidson III, “Agency Costs, Own- ership Structure and Corporate Governance Mecha- nisms,” Journal of Banking and Finance, Vol. 27, 2003, pp. 793-816. [27] L. H. P. Lang and R. M. Stulz and R. A. Walking, “A Test of the Free Cash Flow Hypothesis, the Case of Bid- der Returns,” Journal of Financial Economics, Vol. 29, No. 2, 1991, pp. 315-335. [28] F. A. Gul and S. L. T. Judy, “Free Cash Flow, Debt Mon- itoring, and Audit Pricing: Further Evidence on the Role of Director Equity Ownership,” Journal of Practice and Theory, Vol. 20, No. 2, 2001, pp. 71-84. [29] S. Titman and R. Wessels, “The Determinants of Capital Structure Choice,” Journal of Finance, Vol. 43, No. 1, 1988, pp. 1-19. [30] M. Bayless and D. J. Diltz, “Securities Offerings and Capital. Structure Theory,” Journal of Business and Ac- counting, Vol. 21, No. 1, 1994, pp. 77-91. [31] A. Hovakimian and E. J. Kane, “Effectiveness of Capital Regulation at US Commercial Banks, 1985 to 1994,” Journal of Finance, Vol. 55, No. 1, 2000, pp. 451-468. [32] A. Ozkan, “Determinants of Capital Structure and Ad- justment to Long Run Target: Evidence from UK Com- pany Panel Data,” Journal of Business Finance and Ac- counting, Vol. 28, 2001, pp. 175-198. [33] E. F. Fama and K. R. French, “Disagreement, Tastes, and Asset Prices,” Journal of Financial Economics, Vol. 83, 2007, pp. 667-689. [34] H. Demsetz and K. Lehn, “The Structure of Corporate Ownership: Causes and Consequences,” Journal of Po- litical Economy, Vol. 93, No. 6, 1985, pp. 1155-1177. [35] E. F. Fama and K. R. French, “Value versus Growth: The International Evidence,” Journal of Finance, Vol. 53, No. 6, 1998, pp. 1975-1999. [36] G. Grullon and R. Michaely, “Dividends, Share Repur- chases and the Substitution Hypothesis,” Journal of Fi- nance, Vol. 57, No. 5, 2002, pp. 1649-1684. [37] S. C. Myers, “The Determinants of Corporate Borrow- ing,” Journal of Financial Economics, Vol. 5, No. 3, 1977, pp. 147-175. [38] F. Easterbrook, “Two Agency-Cost Explanations of Div- idends,” American Economic Review, Vol. 74, No. 4, 1984, pp. 650-659. [39] E. F. Fama and K. R. French, “The Cross-Section of Ex- pected Stock Returns,” Journal of Finance, Vol. 47, No. 2, 1992, pp. 427-465. Copyright © 2010 SciRes. JSSM |