Paper Menu >>
Journal Menu >>
 American Journal of Anal yt ical Chemistry, 2010, 1, 144-149 doi:10.4236/ajac.2010.13018 Published Online November 2010 (http://www.SciRP.org/journal/ajac) Copyright © 2010 SciRes. AJAC Validated HPTLC Method for Simultaneous Estimation of Isotretinoin and Erythromycin in Bulk Drug and Topical Gel Form Atul S. Rathore, Lohidasan Sathiyanarayanan, Kakasaheb R. Mahadik* Department of Ph arm ace ut i ca l Chemist ry, Poona College of Pharmacy, Bharati Vidyapeeth University, Pune, India E-mail: krmahadik@rediffmail.com Received June 16, 201 0; revised August 2, 2010; accepted October 26, 2010 Abstract A simple, precise and accurate high performance thin layer chromatographic method has been developed for the simultaneous estimation of Isotretinoin and Erythromycin in pharmaceutical gel. The separation was car- ried out on Merck TLC aluminum sheets of silica gel 60 F254, (20 × 10 cm) with 250 µm thickness using toluene: DMSO: methanol (6.5:0.2:2.5, v/v/v) as a mobile phase. HPTLC separation of the two drugs fol- lowed by densitometric measurement of their spots at 340 nm for Isotretinoin before derivatization and 410 nm for Erythromycin after derivatization with 10% H2SO4 and heating at 100C for 15 min. The drugs were satisfactorily resolved with RF values of 0.38 ± 0.02 and 0.55 ± 0.02 for Isotretinoin and Erythromycin, re- spectively. The accuracy and reliability of the method was assessed by evaluation of linearity (30-150 ng spot-1 for Isotretinoin and 1200-6000 ng spot-1 for Erythromycin), precision (intra-day RSD 0.62-0.79% and inter-day RSD 0.43-0.71% for Isotretinoin and intra-day RSD 0.47-1.71% and inter-day RSD 0.42-1.49% for Erythromycin), accuracy (98.91 ± 0.92% for Isotretinoin and 99.27 ± 0.72% for Erythromycin), and specific- ity, in accordance with ICH guidelines. Keywords: Isotretinoin, Erythromycin, HPTLC, Validation 1. Introduction Isotretinoin (Figure 1(a)) is chemically (13cis)-retinoic acid. Isotretinoin is a member of the large group of Vi- tamin A related compounds. It alters DNA transcription and decreases the size and sebum output of the sebaceous glands. It also stabilizes keratinization, Due to its effect on regulating cell differentiation it has been used for the treatment of cystic and nodular acne and also as an in- hibitor of neoplasic cells proliferation [1-7]. Erythromy- cin (Figure 1(b)) is chemically (3R, 4S, 5S, 6R, 7R, 9R, 11R, 12R, 13S, 14R)-6-{[(2S, 3R, 4S, 6R)-4-(di- me- thylamino)-3-hydroxy-6-methyloxan-2-yl]oxy}-14- ethyl-7, 12, 13-trihydroxy-4-{[(2R, 4R, 5S, 6S)-5-hy- droxy-4-methoxy-4,6-dimethyloxan-2-yl]oxy}-3, 5, 7, 9, 11, 13-hexamethyl-1-oxacyclotetradecane-2,10-dione. It is an antibiotic that possess bactericidal activity, particu- larly at higher concentrations. It acts by binding to the 50s subunit of the bacterial 70s rRNA complex, protein synthesis and subsequently structure/function processes critical for life or replication are inhibited [8,9]. Litera- ture review reveals that several analytical methods have been reported for Isotretinoin [10-12] and Erythromycin [13-18] as individual determination or in biological fluids or in combination with other drugs in pharmaceutical dosage forms. A comprehensive literature survey re- vealed that no method has been reported for simultane- ous estimation of Isotretinoin and Erythromycin by HPTLC in pharmaceutical dosage forms. So, the present study is designed for the development and validation of simple HPTLC method for the simultaneous estimation of Isotretinoin and Erythromycin in their combined topi- cal gel formulation. The proposed method is validated as per ICH guideline [19]. 2. Experimental 2.1. Materials Working standards of pharmaceutical grade Isotretinoin 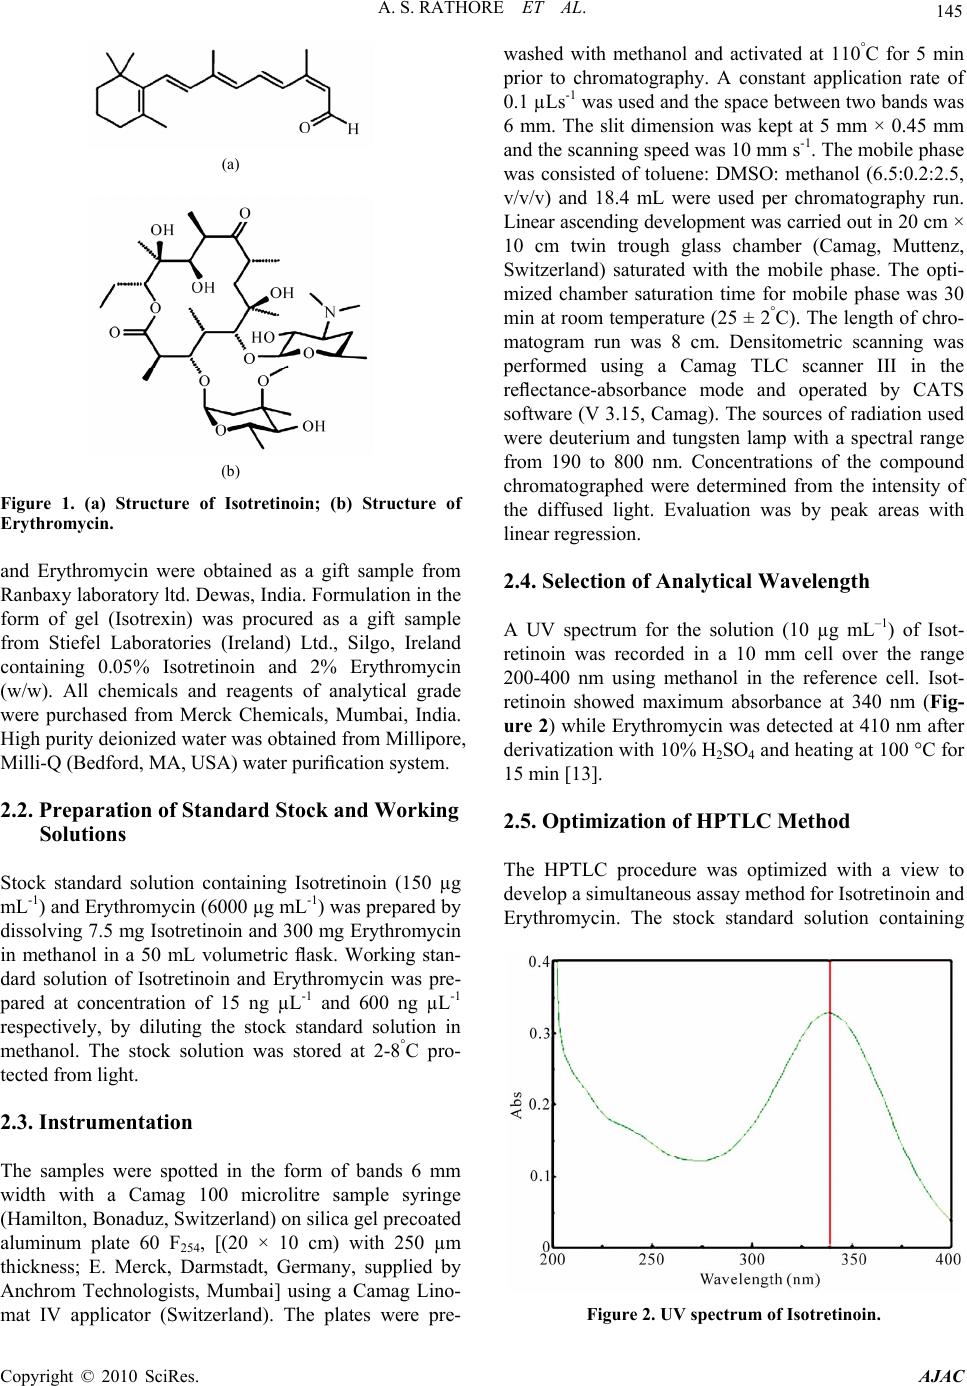 A. S. RATHORE ET AL. 145 (a) (b) Figure 1. (a) Structure of Isotretinoin; (b) Structure of Erythromycin. and Erythromycin were obtained as a gift sample from Ranbaxy laboratory ltd. Dewas, India. Formulation in the form of gel (Isotrexin) was procured as a gift sample from Stiefel Laboratories (Ireland) Ltd., Silgo, Ireland containing 0.05% Isotretinoin and 2% Erythromycin (w/w). All chemicals and reagents of analytical grade were purchased from Merck Chemicals, Mumbai, India. High purity deionized water was obtained from Millipore, Milli-Q (Bedford, MA, USA) wate r p ur ification system. 2.2. Preparation of Standard Stock and Working Solutions Stock standard solution containing Isotretinoin (150 µg mL-1) and Er yth ro mycin (6 000 µg mL-1) w as pr ep ar ed by dissolving 7.5 mg Isotretinoin and 300 mg Erythromycin in methanol in a 50 mL volumetric flask. Working stan- dard solution of Isotretinoin and Erythromycin was pre- pared at concentration of 15 ng µL-1 and 600 ng µL-1 respectively, by diluting the stock standard solution in methanol. The stock solution was stored at 2-8°C pro- tected from light. 2.3. Instrumentation The samples were spotted in the form of bands 6 mm width with a Camag 100 microlitre sample syringe (Hamilton, Bonaduz, Switzerland) on silica gel precoated aluminum plate 60 F254, [(20 × 10 cm) with 250 µm thickness; E. Merck, Darmstadt, Germany, supplied by Anchrom Technologists, Mumbai] using a Camag Lino- mat IV applicator (Switzerland). The plates were pre- washed with methanol and activated at 110°C for 5 min prior to chromatography. A constant application rate of 0.1 µLs-1 was used and the space between two bands was 6 mm. The slit dimension was kept at 5 mm × 0.45 mm and the scanning speed was 10 mm s-1. The mobile phase was consisted of toluene: DMSO: methanol (6.5:0.2:2.5, v/v/v) and 18.4 mL were used per chromatography run. Linear ascending development was carried out in 20 cm × 10 cm twin trough glass chamber (Camag, Muttenz, Switzerland) saturated with the mobile phase. The opti- mized chamber saturation time for mobile phase was 30 min at room temperature (25 ± 2°C). The length of chro- matogram run was 8 cm. Densitometric scanning was performed using a Camag TLC scanner III in the reflectance-absorbance mode and operated by CATS software (V 3.15, Camag). The sources of radiation used were deuterium and tungsten lamp with a spectral range from 190 to 800 nm. Concentrations of the compound chromatographed were determined from the intensity of the diffused light. Evaluation was by peak areas with linear regression. 2.4. Selection of Analytical Wavelength A UV spectrum for the solution (10 µg mL–1) of Isot- retinoin was recorded in a 10 mm cell over the range 200-400 nm using methanol in the reference cell. Isot- retinoin showed maximum absorbance at 340 nm (Fig- ure 2) while Erythromycin was detected at 410 nm after derivatization with 10% H2SO4 and heating at 100 °C for 15 min [13]. 2.5. Optimization of HPTLC Method The HPTLC procedure was optimized with a view to develop a simultaneous assay method for Isotretinoin and Erythromycin. The stock standard solution containing Figure 2. UV spectrum of Isotretinoin. Copyright © 2010 SciRes. AJAC 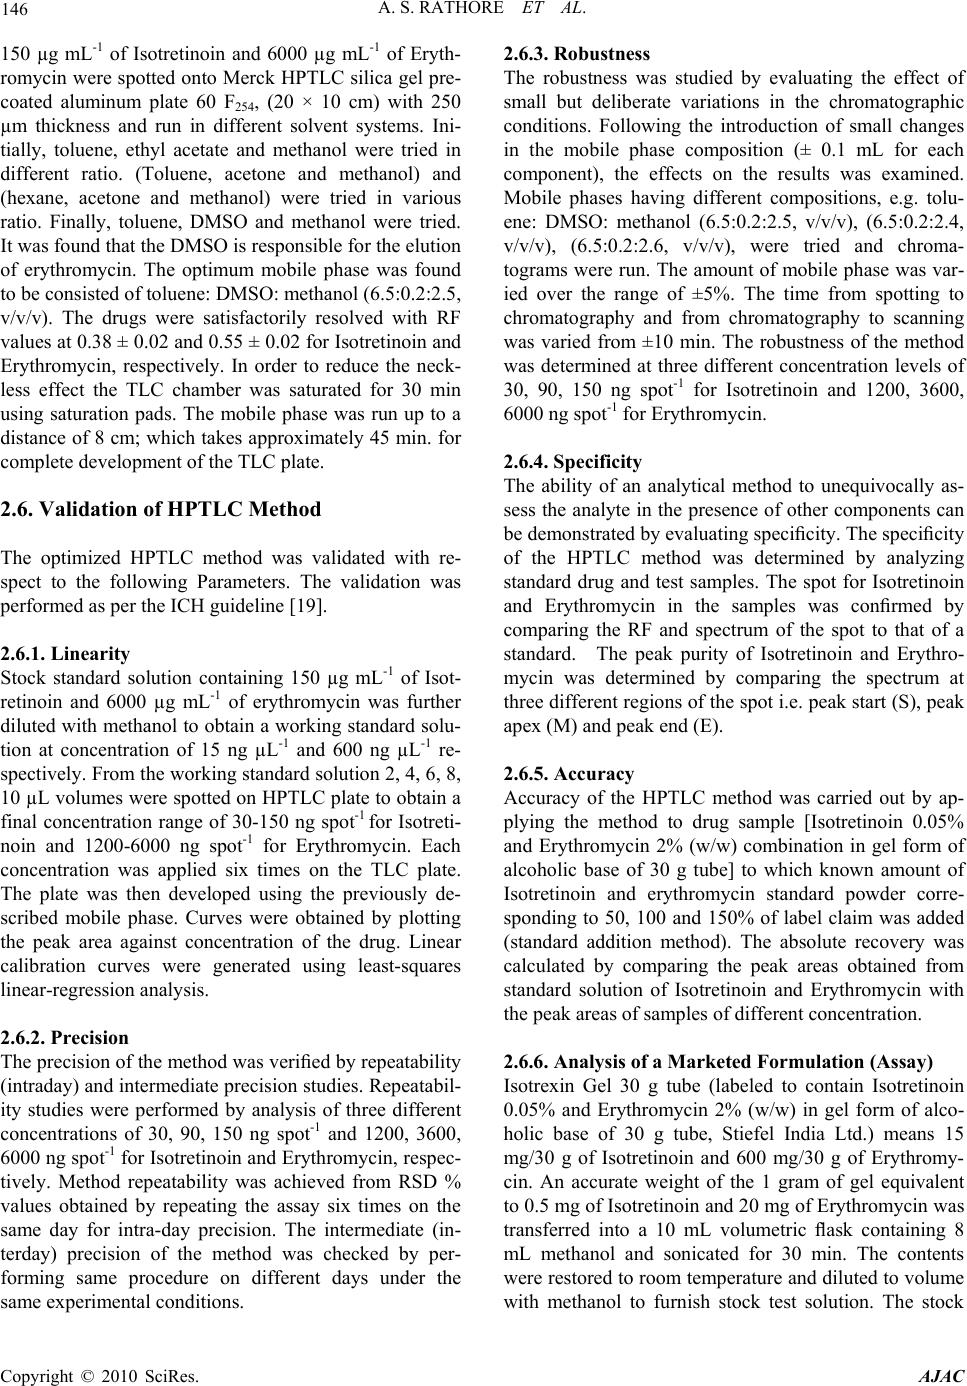 146 A. S. RATHORE ET AL. 150 µg mL-1 of Isotretinoin and 6000 µg mL-1 of Eryth- romycin were spotted onto Merck HPTLC silica gel pre- coated aluminum plate 60 F254, (20 × 10 cm) with 250 µm thickness and run in different solvent systems. Ini- tially, toluene, ethyl acetate and methanol were tried in different ratio. (Toluene, acetone and methanol) and (hexane, acetone and methanol) were tried in various ratio. Finally, toluene, DMSO and methanol were tried. It was found that the DMSO is responsib le for th e elu tion of erythromycin. The optimum mobile phase was found to be consisted of toluene: DMSO: methanol (6.5:0.2:2.5 , v/v/v). The drugs were satisfactorily resolved with RF values at 0.38 ± 0.02 and 0.55 ± 0.02 for Isotretinoin and Erythromycin, respectively. In order to reduce the neck- less effect the TLC chamber was saturated for 30 min using saturation pads. The mobile phase was run up to a distance of 8 cm; which takes approximately 45 min. for complete development of the TLC plate. 2.6. Validation of HPTLC Method The optimized HPTLC method was validated with re- spect to the following Parameters. The validation was performed as per the ICH guideline [19]. 2.6.1. Linearity Stock standard solution containing 150 µg mL-1 of Isot- retinoin and 6000 µg mL-1 of erythromycin was further diluted with methanol to obtain a working standard solu- tion at concentration of 15 ng µL-1 and 600 ng µL-1 re- spectively. From the working standard solution 2, 4, 6, 8, 10 µL volumes were spotted on HPTLC plate to obtain a final concentration range of 30-150 ng spot-1 for Isotreti- noin and 1200-6000 ng spot-1 for Erythromycin. Each concentration was applied six times on the TLC plate. The plate was then developed using the previously de- scribed mobile phase. Curves were obtained by plotting the peak area against concentration of the drug. Linear calibration curves were generated using least-squares linear-regression analysis. 2.6.2. Precision The precision of the method was verified by repeatab ility (intraday) and intermediate precision studies. Repeatabil- ity studies were performed by analysis of three different concentrations of 30, 90, 150 ng spot-1 and 1200, 3600, 6000 ng spot-1 for Isotretinoin and Erythromycin, respec- tively. Method repeatability was achieved from RSD % values obtained by repeating the assay six times on the same day for intra-day precision. The intermediate (in- terday) precision of the method was checked by per- forming same procedure on different days under the same experimental conditions. 2.6.3. Robus tness The robustness was studied by evaluating the effect of small but deliberate variations in the chromatographic conditions. Following the introduction of small changes in the mobile phase composition (± 0.1 mL for each component), the effects on the results was examined. Mobile phases having different compositions, e.g. tolu- ene: DMSO: methanol (6.5:0.2:2.5, v/v/v), (6.5:0.2:2.4, v/v/v), (6.5:0.2:2.6, v/v/v), were tried and chroma- tograms were run. The amount of mobile phase was var- ied over the range of ±5%. The time from spotting to chromatography and from chromatography to scanning was varied from ±10 min. The robustness of the method was determined at three different concentration levels of 30, 90, 150 ng spot-1 for Isotretinoin and 1200, 3600, 6000 ng spot-1 fo r E ry thromycin. 2.6.4. Specifi c ity The ability of an analytical method to unequivocally as- sess the analyte in the presence of other components can be demonstrated by evaluating specificity. The specificity of the HPTLC method was determined by analyzing standard drug and test samples. The spot for Isotretinoin and Erythromycin in the samples was confirmed by comparing the RF and spectrum of the spot to that of a standard. The peak purity of Isotretinoin and Erythro- mycin was determined by comparing the spectrum at three different regions of the spot i.e. peak start (S), peak apex (M) and peak end (E). 2.6.5. Accuracy Accuracy of the HPTLC method was carried out by ap- plying the method to drug sample [Isotretinoin 0.05% and Erythromycin 2% (w/w) combination in gel form of alcoholic base of 30 g tube] to which known amount of Isotretinoin and erythromycin standard powder corre- sponding to 50, 100 and 150% of label claim was added (standard addition method). The absolute recovery was calculated by comparing the peak areas obtained from standard solution of Isotretinoin and Erythromycin with the peak areas of samples of different concentration. 2.6.6. Anal ysis of a Marketed Formul a ti o n (Assay) Isotrexin Gel 30 g tube (labeled to contain Isotretinoin 0.05% and Erythromycin 2% (w/w) in gel form of alco- holic base of 30 g tube, Stiefel India Ltd.) means 15 mg/30 g of Isotretinoin and 600 mg/30 g of Erythromy- cin. An accurate weight of the 1 gram of gel equivalent to 0.5 mg of Isotretinoin and 20 mg of Erythromycin was transferred into a 10 mL volumetric flask containing 8 mL methanol and sonicated for 30 min. The contents were restored to room temperature and diluted to volume with methanol to furnish stock test solution. The stock Copyright © 2010 SciRes. AJAC 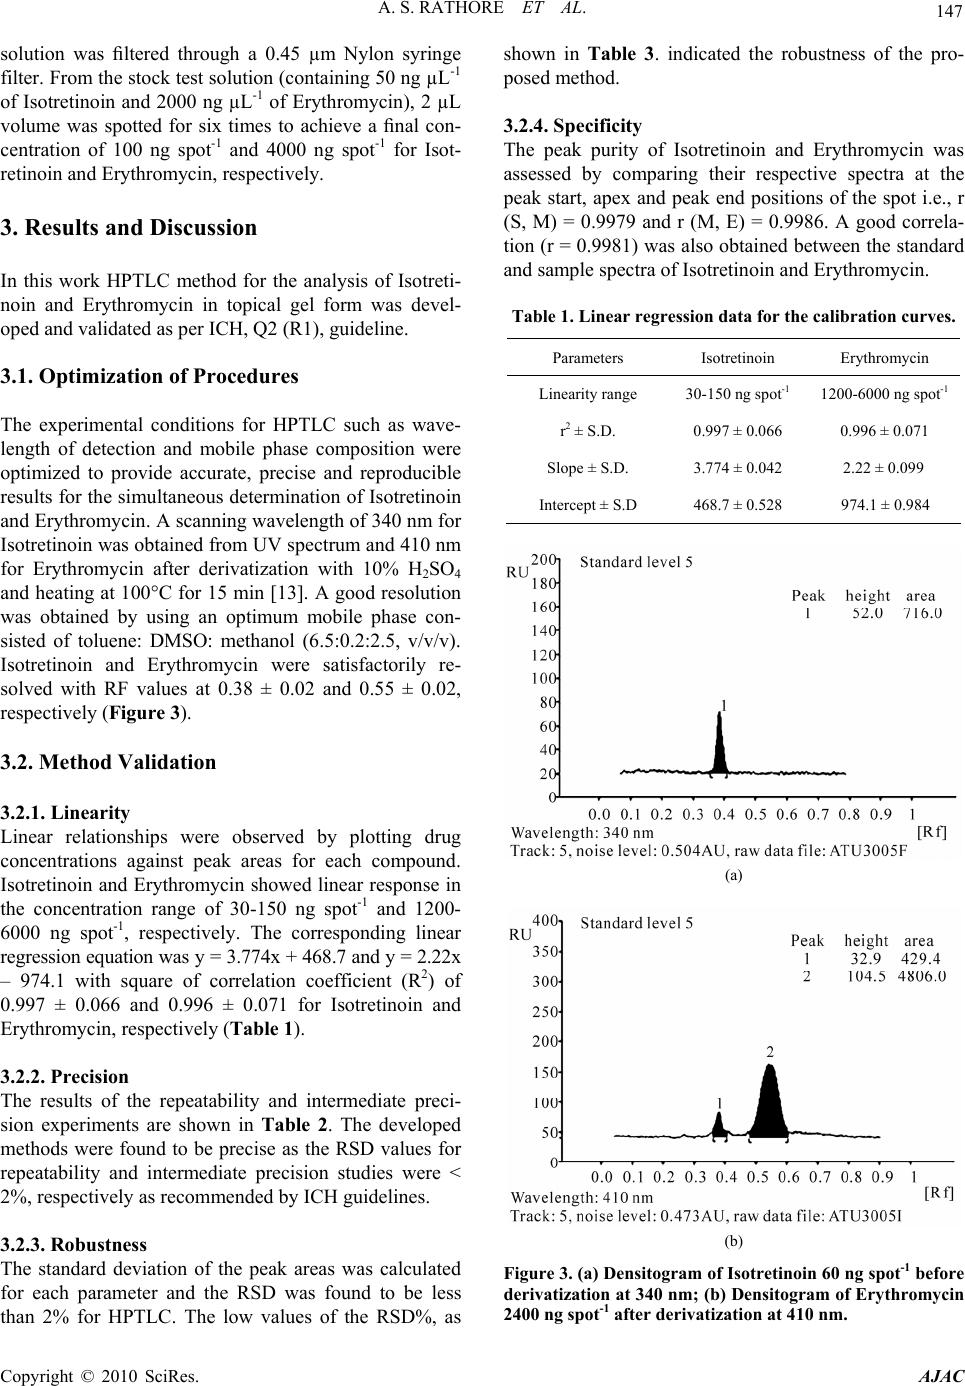 A. S. RATHORE ET AL. 147 solution was filtered through a 0.45 µm Nylon syringe filter. From the stock test solution (contain ing 50 ng µL-1 of Isotretinoin and 2000 ng µL-1 of Erythromycin), 2 µL volume was spotted for six times to achieve a final con- centration of 100 ng spot-1 and 4000 ng spot-1 for Isot- retinoin and Erythromycin, respectively. 3. Results and Discussion In this work HPTLC method for the analysis of Isotreti- noin and Erythromycin in topical gel form was devel- oped and validated as per ICH, Q2 (R1), guideline. 3.1. Optimization of Procedures The experimental conditions for HPTLC such as wave- length of detection and mobile phase composition were optimized to provide accurate, precise and reproducible results for the simultaneous determination of Isotretino in and Erythro mycin. A scanning w aveleng th of 340 n m for Isotretinoin was obtained from UV spectrum and 410 nm for Erythromycin after derivatization with 10% H2SO4 and heating at 100°C for 15 min [13]. A good resolution was obtained by using an optimum mobile phase con- sisted of toluene: DMSO: methanol (6.5:0.2:2.5, v/v/v). Isotretinoin and Erythromycin were satisfactorily re- solved with RF values at 0.38 ± 0.02 and 0.55 ± 0.02, respectively (Figure 3). 3.2. Method Validation 3.2.1. Linearity Linear relationships were observed by plotting drug concentrations against peak areas for each compound. Isotretinoin and Erythromycin showed linear response in the concentration range of 30-150 ng spot-1 and 1200- 6000 ng spot-1, respectively. The corresponding linear regression equation was y = 3.774x + 468.7 and y = 2.22x – 974.1 with square of correlation coefficient (R2) of 0.997 ± 0.066 and 0.996 ± 0.071 for Isotretinoin and Erythromycin, respectively (Table 1). 3.2.2. Precision The results of the repeatability and intermediate preci- sion experiments are shown in Table 2. The developed methods were found to be precise as the RSD values for repeatability and intermediate precision studies were < 2%, respectively as recommended by ICH guidelines. 3.2.3. Robustness The standard deviation of the peak areas was calculated for each parameter and the RSD was found to be less than 2% for HPTLC. The low values of the RSD%, as shown in Table 3. indicated the robustness of the pro- posed method. 3.2.4. Specifi c ity The peak purity of Isotretinoin and Erythromycin was assessed by comparing their respective spectra at the peak start, apex and peak end positions of the spot i.e., r (S, M) = 0.9979 and r (M, E) = 0.9986. A good correla- tion (r = 0.9981) was also obtained between the standard and sample spectra of Isotretinoin and Erythromycin. Table 1. Linear regression data for the calibration curves. Parameters Isotretinoin Erythromycin Linearity rang e 30-150 ng spot-1 1200-6000 ng spot-1 r2 ± S.D. 0.997 ± 0.066 0.996 ± 0.071 Slope ± S.D. 3.774 ± 0.042 2.22 ± 0.099 Intercept ± S.D 468.7 ± 0.528 974.1 ± 0.984 (a) (b) Figure 3. (a) Densitogram of Isotretinoin 60 ng spot-1 before derivatization at 340 nm; (b) Densitogram of Erythromycin 400 ng spot-1 after derivatization at 410 nm. 2 Copyright © 2010 SciRes. AJAC  A. S. RATHORE ET AL. Copyright © 2010 SciRes. AJAC 148 Table 2. Precision studies of Isotretinoin and Ery thromycin. Repeatability (n = 6) Intermediate precision (n = 6) Drugs Conc. (ng spot-1) Found conc. ± SD RSD (%) Found conc. ± SD RSD (%) 30 29.53 ± 0.18 0.62 29.97 ± 0.13 0.43 90 90.08 ± 0.09 0.10 90.86 ± 0.64 0.71 Isotretinoin 150 152.88 ± 1.21 0.79 152.14 ± 0.69 0.45 1200 1067.00 ± 15.47 1.45 1038.89 ± 4.40 0.42 3600 3690.23 ± 17.44 0.47 3637.13 ± 54.99 1.49 Erythromycin 6000 5993.19 ± 101.37 1.71 5934.68 ± 59.99 1.02 Table 3. Robustness testing for HPTLC method. SD of peak area % RSD Parameter Isotretinoin Erythromycin Isotretinoin Erythromycin Mobile phase composition (± 0 .1 ml) 1.54 1.53 1.24 1.09 Amount of mobile phase (± 5 %) 1.82 0.65 1.34 1.27 Time from spotting to ch romatography ( ± 10 min) 0.70 0.94 0.40 0.89 Time from chromatography to scanning (± 10 min) 0.72 0.59 0.48 0.40 Table 4. Accuracy of the proposed method. For HPTLC (n = 6) Drugs Label claim mg g-1 of gel Amount added in mg (%) Total amount (mg) Actual conc. taken (ng spot-1)calculated conc. ± SD RSD (%) Recovery (%) 0.25 (50%) 0.75 75 73.69 ± 0.38 0.52 98.26 0.5 (100%) 1.00 100 98.75 ± 1.29 1.31 98.75 Isotretinoin 0.5 0.75 (150%) 1.25 125 124.65 ± 1.14 0.92 99.72 10 (50%) 30 3000 2942.10 ± 17.36 0.59 98.07 20 (100%) 40 4000 4062.00 ± 17.22 0.42 101.55 Erythromycin 20 30 (150%) 50 5000 4909.50 ± 56.37 1.15 98.19 3.2.5. Accuracy As shown from the data in Table 4, satisfactory recover- ies % with small relative standard deviations, RSD (%) were obtained at various added concentrations for both the drugs. The results indicate the methods are highly accurate for simultaneous determination of the two drugs. 3.2.6. Anal ysis of a Marketed Formul a ti o n (Assay) Using the proposed chromatographic method, assay of Isotretinoin and Erythromycin in their formulation in gel form was carried out. Satisfactory results were obtained for both drugs in a good agreement with the lab el claims. The recovery % ± RSD % of six replicate determinations were 98.78 ± 0.99 (Isotretinoin), 101.19 ± 1.05 (Eryth- romycin) by HPTLC (Table 5). 4. Conclusions The developed TLC technique is precise, specific and  A. S. RATHORE ET AL. 149 Table 5. Analysis of marketed formulation (assay) of isot- retinoin and erythromycin. For HPTLC (n = 6) Drugs Label claim % in 30 g gel Drug content (%) ± SD RSD (%) Isotretinoin 0.05 % 98.78 ± 0.98 0.99 Erythromycin 2 % 101.19 ± 1.06 1.05 accurate. Statistical analysis proves that the method is suitable for analsizing of Isotretinoin and Erythromycin as bulk drug and in pharmaceutical gel formulation. The proposed TLC method is less expensive, simpler, rapid, and more flexible than LC. 5. Acknowledgements The authors would like to thank, Ranbax y laboratory ltd. Dewas, India for the gift samples and Mr. Vijayanand Chakrapani QA-Manager Stiefel India Pvt. Ltd. for ar- ranging the gift sample of formulation (Isotrexin gel) and Poona College of Pharmacy, Bharati Vidyapeeth Univer- sity for providing facilities and encouragement for car- rying out this study. 6. References [1] M. B. Sporn, N. M. Dunlop, D. L. Newton and J. M. Smith, “Prevention of Chemical Carcinogenesis by Vita- min A and Its Synthetic Analogs (Retinoids),” Federation Proceedings, Vol. 35, No. 6, 1976, pp. 1332-1338. [2] L. R. Harisiadis, R. C. Miller, E. J. Hall and C. Borek, “A Vitamin A Analogue Inhibits Radiation-Induced Onco- genic Transformation,” Nature, Vol. 274, No. 5670, Au- gust 1978, pp. 486-487. [3] R. Lotan, “Effects of Vitamin A and Its Analogs (Reti- noids) on Normal and Neoplastic Cells,” Biochimica et Biophysica Acta, Vol. 605, No. 1, March 1980, pp. 33-91. [4] M. B. Sporn and A. B. Roberts, “What is a Retinoid?” Ciba Foundation Symposium, Vol. 113, 1985, pp. 1-5. [5] S. Nagpal, J. Athanikar and R. A. S. Chandraratna, “Separation of Transactivation and AP1 Antagonism Functions of Retinoic Acid Receptor,” Journal of Bio- logical Chemistry, Vol. 270, No. 2, January 1995, pp. 923-927. [6] R. A. S. Chandraratna, “Tazarotene—First of a New Generation of Receptor-Selective Retinoids,” British Journal of Dermatology, Vol. 135, No. 49, October 1996, pp. 18-25. [7] B. Amichai, A. Shemer and M. Grunwald, “Low-Dose Isotretinoin in the Treatment of Acne Vulgaris,” Journal of the American Academy of Dermatology, Vol. 54, No. 4, April 2006, pp. 644-646. [ 8] C. Mims, H. M. Dockrell, R. V. Goering, I. Roitt, D. Wakelin and M. Zuckerman, “Attacking the Enemy: An- timicrobial Agents and Che motherapy: Macrolides,” Medi- cal Microbiology, 3rd Edition, Mosby Ltd, London, 2004, p. 489. [9] A. Trevor, B. G. Katzung and S. Masters, “Chemothera- peutic Drugs: Chloramphenic ol, Tetracyclines, Macrolides, Clindamycin, & Streptogramins,” Pharmac ology, 9th Edi- tion, McGraw-Hill Medical, New York, December 2003, pp. 758-759. [10] B. M. Tashtoush, E. L. Jacobson and M. K. Jacobson, “A Rapid HPLC Method for Simultaneous Determination of Tretinoin and Isotretinoin in Dermatological Formula- tions,” Journal of Pharmaceutical and Biomedical Analysis, Vol. 43, No. 3, February 2007, pp. 859-864. [11] N. Takeda and A. Yamamoto, “Simultaneous Determina- tion of 13-Cis- and All-Trans-Retinoic Acids and Retinol in Human Serum by High-Performance Liquid Chroma- tography,” Journal of Chromatography B, Vol. 657, No. 1, July 1994, 53-59. [12] B. Disdier, H. Bun, J. Catalin and A. Durand, “Simulta- neous Determination of All-Trans-, 13-Cis-, 9-Cis-Reti- noic Acid and Their 4-Oxo-Metabolites in Plasma by High-Performance Liquid Chromatography,” Journal of Chromatography B, Vol. 683, No. 2, August 1996, pp. 143-154. [13] B. Liawruangrath and S. Liawruangrath, “High Perform- ance Thin Layer Chromatographic Determination of Erythromycin in Pharmaceutical Preparations,” Chroma- tographia, Vol. 54, No. 5, September 2001, pp. 405-408. [14] Y. Kato, T. Yokoyama, M. Shimokawa, K. Kudo, J. Kabe and K. Mohri, “Determination of Erythromycin in Human Plasma and Whole Blood by High-Performance Liquid Chromatography,” Journal of Liquid Chromatography, Vol. 16, No. 3, February 1993, pp. 661-680. [15] K. Tsuji and M. P. Kane, “Improved High-Performance Liquid Chromatographic Assay of Erythromycin in Phar- maceutical Solid Dosage Forms,” Journal of Pharmaceu- tical Sciences, Vol. 71, No. 10, October 1982, pp. 1160- 1164. [16] P. Dehouck, E. Van Looy, E. Haghedooren, K. Deckers, Y. Vander Heyden, E. Adams, E. Roets and J. Hoog- martens, “Analysis of Erythromycin and Benzoylperox- ide in Topical Gels by Liquid Chromatography,” Journal of Chromatography B, Vol. 794, No. 2, September 2003, pp. 293-302. [17] C. Stubbs and I. Kanfer, “High-Performance Liquid Chromatography of Erythromycin Propionyl Ester and Erythromycin Base in Biological Fluids,” Journal of Chromatography: Biomedical Applications, Vol. 427, 1988, pp. 93-101. [18] J. Wardrop, D. Ficker, S. Franklin and R. J. Gorski, “De- termination of Erythromycin and Related Substances in Enteric-Coated Tablet Formulations by Reversed-Phase Liquid Chromatography,” Journal of Pharmaceutical Sci- ences, Vol. 89, No. 9, July 2000, pp. 1097-1105. [19] ICH Q2 (R1), “Validation of Analytical Procedures: Text and Methodology,” International Conference on Har- monization, Complementary Guideline on Methodology, Geneva, November 2005. Copyright © 2010 SciRes. AJAC |