Journal of Water Resource and Protection
Vol.6 No.9(2014), Article
ID:47386,20
pages
DOI:10.4236/jwarp.2014.69078
Evapotranspiration―Soil Structure Relationship in West Marshes of France

R. T. Radimy1, P. Dudoignon1, J. M. Hillaireau2, L. Caner1
1IC2MP-HydrASA Laboratory UMR 7285, ENSIP, Poitiers 86022, Poitiers University, France
2INRA Poitou-Charentes, Expérimental Site, 17450 Saint Laurent-de-la-Prée, France
Email: patrick.dudoignon@univ-poitiers.fr, jean-michel.hillaireau@stlaurent.lusignan.inra.fr
Copyright © 2014 by authors and Scientific Research Publishing Inc.
This work is licensed under the Creative Commons Attribution International License (CC BY).
http://creativecommons.org/licenses/by/4.0/


Received 5 March 2014; revised 1 April 2014; accepted 19 April 2014
Abstract
The soil potentials, facing to the crop fields, are commonly estimated through the calculation of their available water capacity based on the ETP or ETM estimation. The present work introduces the comparison between theoretical and real available water capacity profiles calculated down to 1.00 m depth. The evapotranspiration data are used to the calculation of ETP in an undrained grassland and ETM in two drained corn fields located in the French Atlantic marshlands. The studied soils have acquired specific properties in response to the reclaiming of the clay; dominant primary sediments began since the Middle Age and late drainage works. The theoretical and real available water capacity profiles are calculated from the ETP and ETM data and from the soil moisture profiles respectively, from June to October 2013. The theoretical and real profiles are confronted to the tensiometric pressure recording at 30, 60 and 90 cm. The tensiometric pressure behavior and associated premature disconnections of the tensiometric plugs are explained thanks to the soil structure-hydromechanical property relationships: i.e. from ductile state in depth to brittle state in surface. The vertical evolutions of the real profiles are explained facing to the plant growing, pluviometry and water nape levels. Their behavior and their shifts from the linear “theoretical” ETP or ETM profiles clearly show the advance of the desiccation front and consequently the kinetics of water consumption by plants. This simple method of calculation and comparison between the real and theoretical ETM or ETP profiles allows the quantitative discussion: 1) on the role of the soil microstructure behavior on the root growing and, 2) on the realism of the crop coefficient taken into account in the ETP or ETM estimation. In these coastal marsh fields, it also argues on the difficulty of management facing to the water and/or salt stresses.
Keywords
Evapotranspiration, Available Water Capacity, Soil Structure, Clay Dominant Soils, Plant Soil Interaction

1. Introduction
The evapotranspiration represents the water balance of soil water delivered to the atmosphere via the plant transpiration and surface evaporation. The maximum evapotranspiration ETM on a plant field has to take into account the atmospheric conditions (temperature, sun radiation, hygrometry, wind velocity) and the area exchange surface developed by the sheets via the stomata efficiency. The equations and models of evapotranspiration are commonly based on thermal formulae [1] -[3] , hygrometric or hygrothermic formulae [4] [5] and energetic formulae [6] -[10] . These are calculations mainly based on soil surface exchange parameters. Nevertheless, the water mass balance has to take into account parameters of soil-root interactions via the density and depth of the root network, the quantity of residual available water in soils, and the soil structure facing to the exchange mechanisms and crop yields: i.e. hydraulic conductivity and soil salinity in coastal marshlands. The water mass transfers from soil to atmosphere including the ETP and ETM are quantitatively studied using empirical equations or modeling for the successive stages of plant growing and senescence [11] -[16] . The relationship between the water lost in atmosphere and the resulting impact on the moisture-soil structure couple may be apprehended from the recording of profiles of residual available water through the seasons. One other point, more specific for seawater marshlands, is the soil and/or water salinity which is able to act on the soil-plant osmotic transfers [17] [18] . The two mechanisms of plant transpiration and soil surface evaporation act together on the desiccation profile and structural behavior of soils. In fact, in coastal wetlands, the water nape level is governed by the hydraulic and drainage management. It acts as a third dominant parameter on the moisture profile of soils in addition to the water consumption by plants during their growing-senescence cycle and to the climatic conditions. The available water for plants may be commonly evaluated from an available water capacity (RU) of soil commonly calculated from its textural characteristics. The “theoretical initial” RUi, calculated as a characteristic of “surface” in mm, can be used to calculate a vertical “initial” available water capacity profile following a linear relationship with the depth:

with RUi in mm, —the soil density, and h—the soil layer thickness in m, Wfc—the field capacity and Wwp—the welting point are usually assessed as the equivalent 4.2 pF.
Through the season, the real RU profiles (RUr) may be calculated via an “ETP or ETM” method, by subtraction of the ETP or ETM from the initial RUi and addition of the pluviometry.
Through the season, the RUr profiles shift from the initial linear theoretical RUi profile according to 1) the moisture profiles behavior and 2) the “surface” ETP and/or ETM evolutions. Consequently, for grassland or different cultivated fields, the RUr profiles may be calculated for the successive dates following two methods:
1) a “textural” method by replacing the field capacity (Wfc) by the real water content (Wn) of the soil at each depth, for the successive dates, as follows [19] :
 2) the “ETP or ETM” method, by subtraction of the ETP or ETM from the initial RUi and addition of the pluviometry (RR):


In the “ETP or ETM” method, the RUrETP and RUrETM are also calculated as a characteristic of “surface” in mm. In these conditions, the RUrETP and RUrETM profiles may be represented as a simple linear RUr-depth relationship. Compared to the initial RUi profile, these RUrETP and RUrETM profiles differ by their increasing slopes following the ETP or ETM increasing (Figure 8 and Figure 9).
On the contrary, the RUrW profiles are governed by the vertical evolutions of the W contents of soils. They are governed by the descent of the desiccation front.
In fact the water consumption by plants affects the water profiles of soils by their root growing. Thus, it is quite evident that the bulk water lost by cumulative plant consumption and surface desiccation does not follow a linear gradient from the surface to the depth. Reciprocally, the propagation of the desiccation front from the surface to the depth acts on the structural evolution of soil: i.e. microto meso-porosity, hydraulic conductivity, shear stress property of the clayey soil matrix, and suction pressures.
In the marshland territories reclaimed from seawater sediments, the soil moisture profiles are the results of a surface desiccation provoked by the construction of polders and drainage. They are characterized by a progressive increase of the water contents from the surface to the depth, according to the descending progression of the desiccation fronts into the fluvio-marine sediments initially saturated by seawater. The consequences of the bulk surface water consumption are a progressive water impoverishment of the initial sediment from the surface to the depth according to the nape level descending. Furthermore, in such territories, the desiccation phenomenon increases the salinity of the residual water in soil up to conditions of salt stress. Following the field locations and associated farming conditions, such desiccation profiles and associated water stress and salt stress couple act on the crop yields [19] -[24] .
The present paper is based on works made on the French Atlantic coast wetlands since many years [19] [25] - [31] . Thanks to the mineralogical and textural homogeneity of the consolidated sediments, the initial works were firstly focused on the relationships which can exist between the microstructure evolution of clay matrices and the macroscopic hydro-mechanical properties of the clay dominant soils. The second investigations were concentrated on the INRA experimental site of St Laurent de la Prée for the calibrations of soil structure-plant growing and crop yield relationships [30] [31] (Figure 1). The present work is focused on the behavior of RUrW, RUrETP and RUrETM profiles developed in two drained parcels for cereal field and in an undrained grassland. The work takes an interest to the comparison between the different RU profiles facing to the soil structure behavior recorded from June to October 2013.
2. Material and Methods
2.1. Material and Geological Setting
The results presented in this work were obtained from the wetlands located along the Atlantic coast of France. The studied areas are located in the “Marais de Rochefort” (Charente Maritime Department), in the INRA experimental site of St Laurent de la Prée (Figure 1).
The soils are formed on clay dominant sediments of fluvio-marine origin named “bri” which result from the silting of an erosion basin in Jurassic limestones during the Flandrian transgression. The ages of the sediments range from 8000 years to nowadays. They were deposited directly on Jurassic limestones which constitute the surrounding hills. The marshes have emerged and dried since at least the Xth century following the sea regression. The polder works started during the XIth century and were the most effective during the XVIIth century. The soils have been formed by successive desiccation, consolidation and maturation of these primary sediments. The successive hydraulic managements have separated the west marshes in “dry” and “wet” marshes [20] [21] [25] [29] [31] . Nevertheless, the bri shows quite homogeneous mineralogy and texture all over the studied territories [25] [26] [28] [29] [31] :
• clay to silty clay texture with 85% to 95% of particles lower than 20 μm and 40% to 60% of particles lower than 2 μm;
• small organic matter content, 0.4 to 2.4 weight %;
• dominantillite, plus kaolinite and illite/smectite mixed layers, and small amount of pure smectite assemblages;
• the measured CEC accord to the illite domain (20 - 30 meq/100g);
• the shrinkage, plasticity and liquidity limits are 20%, 40% and 70% in gravimetric water content respectively.
The local textural evolutions are limited to the 0- to 20-cm soil surface and some paleosoils recognized between 1 and 2 meter depth; i.e. decrease of the infra 2 μm fraction to 5% - 23% [25] . In parallel, the illite/smectite mixed layer assemblages present a weak increase of the smectitic layers % in depth [32] [33] . This increase of smectitic layer % was identified by X-Ray diffraction only on the 0.2 μm fraction. Similar mineralogical evolutions were identified according to the ages of soils sampled in the successive polders [34] . The phenomenon was attributed to a smectiteto illite-conversion associated to the time of soil maturation.
These characteristics of clay dominant soil induce drastic shrinkage properties which provoke a sub-isotropic volumetric decrease reaching 30% from the plasticity to the liquidity limit, and high opening and propagation of shrinkage fractures along the unsaturated subsurface [25] [26] [28] (Figure 2).
During the dried periods, according to the descending of the desiccation front, the 3D shrinkage induces the clay matrix compaction and the opening of a subvertical fracture network, down to the Wp depth [25] [28]
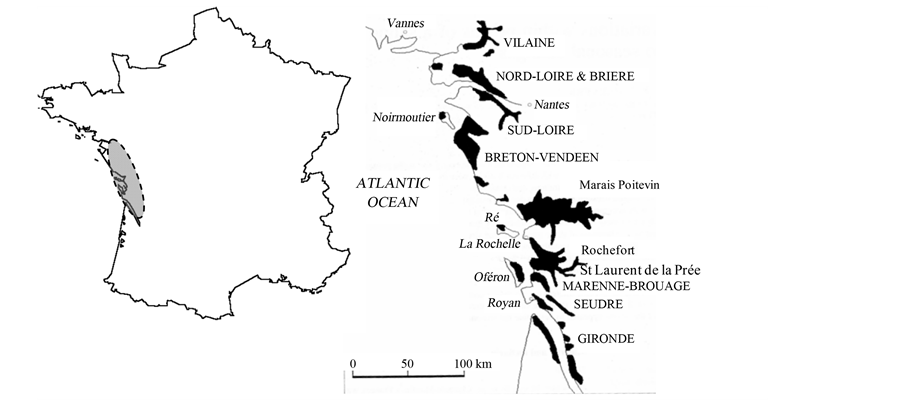
Figure 1. Location of the “Marais de Rochefort” and “Marais Poitevin” on the West Atlantic coast of France. The INRA experimental site of St Laurent de la Prée is located in the “Marais de Rochefort”.

Figure 2. (a) Schematic representation of a structural profile of marsh soil due to the historical surface desiccation induced by the hydraulic managements; (b) Example of subvertical shrinkage cracks observed in the corn field in September 2013; (c) Vertical evolution of the hydraulic conductivity: small squares = oedometric measurements on the clay matrix, large squares = in situ infiltration tests [25] [30] . Ws = shrinkage limit, Wp = plasticity limit, Wl = liquidity limit.
(Figure 2). The surface to Wp depth layer is a double hydraulic conductivity medium: i.e. small permeability of the clay matrix constituting the inner part of prisms and peds (micro-to-centimeter scale) and large permeability of the shrinkage fracture network (macroscopic scale) (Figure 2(c)). The subjacent layer is characterized by only the small permeability of the clay matrix which is governed by the microstructure and the particle arrangements in the Wp-Wl saturated domain: about 10−6 m∙s−1 in Wl state down to 10−10 m∙s−1 in the Wp state.
In the Marais de Rochefort, the water content and salinity profiles of soils mainly depend 1) of their distances from the surrounding calcareous hills and 2) of the presence or not of drainage. In fact they are governed by the water nape levels and the resulting thickness of leached soil by rain water, and the eventual fresh water inlet from the peripheral limestones [25] -[31] . The cereal crops are made on drained fields. The grasslands are localized on undrained fields. The grassland parcels are commonly characterized by a typical microtopography resulting of the recurrent “mud cleaning” of the peripheral ditch and deposit of the scoured muds along the ditch banks [19] .
The soil profiles may be characterized by couples of water content (Wn) and 1/5 electrical conductivity ( ). The couple of Wn and
  profiles are periodically measured through the seasons in order to quantify their evolutions face to the annual climatic changes and face to the different plant growing. Finally, following their locations, the soils divide into hygrophile, meso-hygrophile and mesophile areas face to the availability of fresh water for plant consumption, excluding the too high salinity domains required by halophyte plants (Figure 3).
The climate is coastal-oceanic with a mean annual rainfall of 780 mm distributed throughout two marked seasons: 52% of the rainfall occurs between October and January [35] . The mean June - August temperature and potential evapotranspiration (ETP) from 1971 to 2001 were 16.3˚C and 321 mm respectively [36] .
The study of the soil structure-hydro-mechanical property relationships was previously performed by coupling the water profiles with cone resistance, shear stress, hydraulic conductivity and resistivity profiles [25] [27] [30] [31] . Finally authors used the shrinkage curve of the clay dominant soil to represent the results in successive crossed diagrams. Gallier et al. [30] [31] proposed a preliminary model of shrinkage crack propagation depending of the initial hydrated state of the clay matrix. The “model” is based on the progressive evolution of the soil from its initial liquid-to-plastic state to a final solid state: i.e. from a ductile mechanical comportment to a brittle comportment.

Figure 3. (a) Schematic evolution of the CE1/5 profiles induced by the water table descending. Grey arrow = water table trend, double vertical black arrows = water table fluctuation between the high water table level (H.W.T.) and the low water table (l.W.T.). 1 to 2 indicates the transition from the mesophile to hygrophile systems; (b) Parallel evolutions of the RUrW profiles and salinity profiles characteristic of the three studied systems. Straight black line = initial cumulative RUi profiles. 1, 2 and 3 residual cumulative RUrW profiles calculated after the plant growing under the grassland and under the cultivated field (example of wheat). Trend 1 = grassland, trend 2 = cultivated area nearby the limestone hill, thus impacted by the fresh water inlet, trend 3 = cultivated area far from the limestone hill [19] .
2.2. Methods
Three spots were studied and in situ equipped in the INRA experimental site of St Laurent de la Prée:
• a grazed grassland in undrained parcel (L3);
• a corn field on drained parcel, drains 10 m apart (A7 10 m);
• a corn field on drained parcel, drains 20 m apart (A7 20 m).
In the drained parcel the spots are localized midway between two drains, that to say 5 m or 10 m from the drains. The in situ recording includes the piezometric levels, the gravimetric water content profiles, the  profiles and tensiometric pressures at depths of 30, 60 and 90 cm. The tensiometers are SMS 2500S type. They are limited to 850 mb pressure equivalent to 2.8 pF. Nevertheless they allow the monitoring of the desiccation profiles during the seasons and associated descending rooting. The piezometers allow the recording of nape levels and the analysis of groundwater chemistry. The chemical analyses give global and average chemical compositions characteristic of fresh water and seawater mixtures: i.e. dominant fresh water near the surface and rich seawater mixture in depth [19] . To obtain accurate vertical salinity gradients, the soil sodicity profiles were characterized by electrical conductivity (
 ) measurements. The
  measurements were made on soil samples according to the clay auger sampling for the water content measurements. The measured
 , allow the calculation of the water conductivity (CEf) for each soil sample following the Montoroi formulae [30] [31] [37] :

with CEf = the in situ fluid conductivity,  the soil conductivity measured in laboratory and Wn the gravimetric water content.
The ETP are calculated from an in situ weather station recording (temperature, wind direction and intensity, rainfall, sunshine radiation). The ETM for corn field are calculated applying successive crop coefficients (Kc) to the ETP; i.e.  (Table 1).
Table1 Measured ETP and parallel crop coefficients (Kc) used for the ETM calculation. The yield components taken into account for the corn field and presented in this work are limited to the sheet number and late dried sheets, just in order to show the parallel between ETP and corn field growing (Figure 13).
The RUi calculated following the soil texture evolves from 185 to 200 mm. The RUrETP and RUrETM are calculated by difference between the initial RUi calculated from the soil texture (200 mm) and the measured station ETP (or calculated ETM for corn field) plus the rain fall (RR) from June to October 2013 in the three parcels.
3. Results
3.1. Rainfall and W Profiles
The rainfall was recorded from the 11 June to 23 October 2013 by the weather station. Three rain periods were observed before the autumn: (1) the two first weeks of June, (2) the 20 June - 5 July and (3) the 6 - 12 August periods (Figure 7). The successive rain periods have different consequences on the water nape level according to 10 or 20 m drain spacing, and the associated kinetics of drainage (Figure 4).
The kinetics of nape responses to the pluviometryare made evident during the second and dominant rain period. Thus, three periods may be clearly identified: before (1), during (2) and after (3) the second rain period.
In the L3 grassland, the successive periods are characterized by 1) a weak evolution of the nape level between 60 and 80 cm depth; 2) a drastic 80 up to 25 cm ascent and a late 3) descent to 90 cm depth.
In the A7 20 m drained corn field, the nape level has progressively dropped from 50 cm to 100 cm depth during the first period (1). It has risen up to 65 cm with the second rain period (2) and then (3) progressively dropped to 130 cm depth.
In the A7 10 m drained corn field, the rain period has not provoked any ascent of the nape: after the first period (1) of quite constant level (50 - 70 cm depth); the nape progressively descended to 1.30 m. These differences between the two A7 20 m and A7 10 m drained corn fields are due to weaker kinetics of water transfer in the large spaced drains in such clay dominant material which can be compacted along the ploughing basis around 30 - 40 cm depth.
The consequences of the simultaneous bulk water consumption by plants, surface evaporation and nape level descending are represented by the vertical soil moisture profile behavior and the associated  and water salinity profiles (Figure 5 and Figure 6).
The succession of rainfall and desiccation periods impacts drastically the water content profiles and consequently the salinity profiles calculated from the  (Figure 5 and Figure 6). In the drained corn fields the Wn variations are substantial from the surface down to the depth of 60 cm. The greatest variations are located just below the depth of 30 cm which corresponds to the compacted ploughing basis. It may be due to weak hydraulic conductivities of the underlying compacted band. The Wn range is 50% to 15%, i.e. just superior to the plasticity limit (Wp = 40%) down to below the shrinkage limit (Ws = 20%). The soil works in solid state.
In the undrained L3 grassland the Wn variations are great only at the soil surface (10 cm depth). The Wn contents evolved from 70% to 23%, thus, practically from the liquidity limit to the shrinkage limit of the clay material.

Figure 4. Water nape evolutions in the undrained L3 grassland (black lozenge), in the drained A7 10 m corn field (black squares) and A7 20 m corn field (white squares).

Figure 5. Parallel evolution of the Wn, CE1/5 and water salinity profiles from the 15 July to the 9 September in the drained A7 20 m corn field.
In spite of larger Wn variations in the drained corn fields, the  profiles show weak evolutions through the season. On the contrary the large Wn variations impact the salinity behavior in a 5000 - 10,000 mg/l (equation NaCl) range in the drained fields and in the 10,000 - 30,000 mg/l (equation NaCl) range in the undrained grassland.
3.2. Impact on the ETP and ETM Profiles
The weather changes impact also the ETP and ETM calculations (Figure 7). The ETP and ETM evolutions follow similar trends characterized by two dominant peaks induced by the rainfall periods of 20 June - 5 July and 6 - 12 August. The differences between the ETP and ETM are governed by the crop coefficient Kc taken into account: Kc is constant equal to 1 for ETP, it successively evolves from 0.3 - 0.6 - 1 - 1.15 - 1 for the corn field (Table 1). Consequently the ETP values are higher than ETM during the first stage of corn growing (Kc = 0.3 and 0.6), they are superimposed on the ETP value for Kc = 1, and lower than ETP for Kc = 1.15 (Figure 7).
The resulting linear RUrETP slopes increase with time following the cumulative ETP but may operate a back decrease caused by the rainfall periods. The Figure 8 shows the three successive stages: (1) the first desiccation stage, (2) the rainfall period and (3) the late and final desiccation. The final RUrETP profiles are quite shifted on the vertical axis at RU = 0.
The linear RUrETM profiles evolve with time following the same periods of (1) desiccation, (2) rainfall and (3) final desiccation. The RUrETM slopes differ of the RUrETP ones by the crop coefficient Kc (Figure 9).
The RUrW profiles are governed by the shapes of the W profiles: i.e. the descending of the surface desiccation fronts against the high “initial” water contents in depth. Consequently all the RUrW profiles exhibit double curve shapes: i.e. concave curve in the upper desiccation domain and convex curve in the residual high water content domain in depth. The down progression of the desiccation front increases and deepens the upper concave part of

Figure 6. Parallel evolution of the Wn, CE1/5 and water salinity profiles from the 11 June to the 2 September in the L3 grassland.

Figure 7. Evolution with time of the ETP for the grassland and ETM for corn field in parallel of the rain fall (pluviometry). Vertical lines = pluviometry, white lozanges = ETP, black squares = ETM.
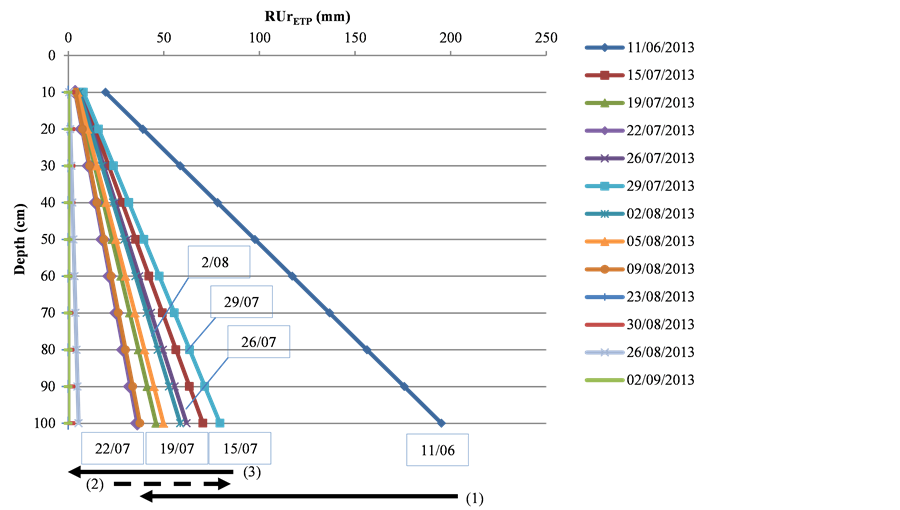
Figure 8. Evolution of the linear RUrETP profiles from 11/06 to 02/09 in the undrained L3 grassland. Horizontal arrows indicate the (1) first desiccation period, (2) second raining period and (3) late desiccation period.

Figure 9. Evolution of the linear RUrETM profiles from 11/06 to 02/09 in the drained corn fields. Horizontal arrows indicate the (1) first desiccation period, (2) the second raining period and (3) the late desiccation period.
the RUrW profiles. On the contrary, a rainfall period provokes a bulk shift of the RUrW profile towards the initial RUi one.
According to the three successive periods of (1) first desiccation, (2) rainfall and (3) late and final desiccation, and, face to the RUrETM or RUrETP considered as references for each date, the RUrW profiles show three different behaviors.
In the undrained L3 grassland, the first desiccation period shifts the RUrW curves towards the RUrETP (Figure 10). For the successive dates the upper parts of the RUrW profile superimpose on the upper part of the RUrETP and confirm the realistic value of Kc = 1 for the grassland. The “depth” of superimposition coincides with the “down progression” of the root network (down to 30 cm depth). The second period of rainfall drastically shifts the RUrW profiles away from the RUrETP profiles calculated for the same dates, and beyond the RUi profile. The phenomenon is representative of the very high quantity of rain water stored near the surface. During the third and final desiccation period, the RUrW profiles shift progressively to the RUrETP ones, nevertheless without reaching them. In all the cases the RUrETP overestimates the soil water availability face to the grassland water consumption and water storage by soil (Figure 10).
In the drained corn field, the three successive periods of desiccation ((1) and (3)) and rainfall (2) provoke mechanisms which are similar to those observed in the grassland (Figure 11). Firstly, the differences are mainly due to the RUrETP and RUrETM linear profiles taken as “references” face to the RUrW profiles. Secondly they are due to the nape levels and associated Wn profiles which are governed by the drainage. During the first desiccation period, the RUrW profiles shift largely below the RUrETM profiles. That would indicate a gap of available water face to the corn growing. In fact the progressive shift of the RUrW profile towards RU = 0 near the surface suggests the necessity of the root network to reach deeper layers. The rainfall period (2) shifts up both RUrW and RUrETM profiles, acting to a superimposition of the two RUrW and RUrETM profiles. Nevertheless, the second desiccation period drastically shifts the RUrW profiles below the RUrETM ones. The consequences are final RUrW profiles composed only by the concave part of the curve. The upper parts are shifted against the vertical RU = 0 axis from the surface down to 80 cm depth. That is also indicative of the requirement of root network to reach deeper layers.

Figure 10. Comparison of the RUrW and RUrETP profiles in the undrained L3 grassland. (1), (2) and (3) correspond to the first desiccation, second rain fall and third desiccation periods respectively. Horizontal arrows indicate the direction of evolution profile during the third periods.

Figure 11. Comparison of the RUrW and RUrETM profiles in the A7 20 m corn field. (1), (2) and (3) correspond to the first desiccation, second rain fall and third desiccation periods respectively. Horizontal arrows indicate the direction of evolution profile during the third periods.
3.3. Tensiometric Pressure and Microstructure
The consequences of the desiccation front progression on the microstructure of the clay dominant soil are clearly shown by the evolutions of the measured tensiometric pressures at 30, 60 and 90 cm depths (Figure 12).
In the A7 20 m drained corn field, the tensiometric pressures evolve following the Wn gradient existing from the surface to the depth.
At 30 cm depth, the tensiometric pressures follow the desiccation―rainfall rehydration cycles:
1) first decrease of the tensiometric pressures down to −300 mbar;
2) rainfall rehydration up to −200 mbar;
3) and late desiccation period down to −350 mbar which provokes the final disconnection of the porous plug and the final period of tensiometric pressures around 0 mbar.
These great evolutions of the tensiometric pressure down to the disconnection of the porous plug operate in a very large 48% - 15% Wn domain: i.e. from the plastic to the solid domains and down to Wn inferior to the shrinkage limit.
At 60 cm depth, the rainfall impact is quite erased. The recorded tensiometric pressures show a progressive decrease of the values from the initial −100 mbar to −200 mbar from June to August. The rainfall impact is only limited to a stabilization of the pressures around −190 mbar during the last week of July and the two first weeks


Figure 12. Evolution of the suction pressures measured at 30, 60 and 90 cm depth in the A7 20 m and A7 10 m cornfields and in the undrained L3 grassland.
of August. The minimum of −200 mbar is not sufficient to provoke a disconnection of the porous plug. The final August to October desiccation period corresponds to a progressive increase of the tensiometric pressures up to −20 mbar. This final tensiometric pressure increase may be attributed to the progressive desiccation of the soil in a 33% - 23% Wn domain. The microstructure reorganization of the soil is induced by the progressive shrinkage of the clay matrix which is balanced by the opening of mesopores (Figure 14).
At 90 cm depth the tensiometric pressure behavior is similar but smoothed in a −50 - 70 mbar domain. The third desiccation period provokes a weak and progressive increase of the tensiometric pressure from −170 to −100 mbar. The microstructure reorganization of the soil is limited in depth in a soil moisture domain restricted near by the plasticity limit.
Finally, from the depth to the surface, we can observed a progressive evolution of the tensiometric pressure curves from smoothed patterns to sharp and “plug disconnected” patterns near the surface. The smoothed patterns restrained in the −150 - 50 mbar tensiometric pressure domains accords with an “equivalent” restrained Wn domain nearby the plasticity domain. The sharp and “plug disconnected” domain is characteristic of the surface layer largely affected by the desiccation and rainfall inlet cycles in a saturated plastic to unsaturated solid domain.
In the A7 10 m drained corn field, from the surface to the depth, the evolution of the tensiometric pressures follows a Wn gradient governed by the efficiency of the drainage (Figure 4): i.e. only two observed phases, 1) sub constant nape level from June to the beginning of July and 2) continuous nape level descending from 10 July to September. No nape level rising up was observed during the July rainfall period.
The evolution of the tensiometric pressures measured at 30 cm and 60 cm depths are clearly impacted by the descent of the desiccation front:
• at 30 cm depth, initial pressure of −150 mbar, sudden fall down to −270 mbar the 20 July, plug disconnection and late stabilized pressure from −50 to 0 mbar;
• at 60 cm depth, initial pressure of −150 mbar, sudden fall down to −270 mbar the 10 August, plug disconnection and late stabilized pressure at 0 mbar;
• at 90 cm depth progressive and continue decrease of the tensiometric pressure from −120 to −200 mbar without any plug disconnection.
The two successive plug disconnections at 30 and 60 cm are separated by three weeks. They accord to the kinetic of descent of the desiccation front and to a fragile behavior of the clayey structure. On the contrary, the progressive decrease of the tensiometric pressure at 90 cm depth accords to a progressive desiccation and associated closure of the clay matrix microporosity.
In the L3 undrained grassland, the desiccation front has a drastic impact on the 30 cm tensiometric curve. The desiccation provokes the plug disconnection the 5 July for a −520 mbar pressure. It is followed by a stabilization of the pressures in the −60 - 0 mbar domain. On the contrary the 60 and 90 cm depth tensiometric curves present weak and quite superimposed evolutions with time. The initial tensiometric pressures measured the 20 June indicate −210, −175, and −150 for 30, 60 and 90 cm depth respectively according to the Wn increase with depth. The evolutions of the Wn with time are great only in surface (70% to 25% at 10 cm depth). They accord to the low permeability of the upper “compacted” layer of clay matrix and rain storage in surface during the rainfall period. In surface, the tensiometric pressure patterns also accord to the shrinkage properties of the clay material. The shrinkage fractures responsible of the plug disconnection open in a Wn domain nearby the shrinkage limit of 20%. The subjacent Wn ranges are restrained in a 40% - 25% and 40% - 35% at 60 and 90 cm respectively. Such weak Wn evolutions provoke only weak increase of the tensiometric pressures associated with the weak clay matrix shrinkage.
The microstructure―tensiometric pressure relationship may be shown by the tensiometric pressure evolution face to the evolution of the Wn (Figure 13). The 20 m apart drains induce low kinetics of water nape descending after a rainfall. The first consequence is an enlarging of the natural Wn domain from 90 cm to 30 cm depth (Figure 6).
At 30 cm depth, the first decrease of the tensiometric pressure from −15 mbar down to −350 mbar follows the descending of the continue desiccation front to 15 July. After that, the descending curve is clearly impacted by the rainfalls of 15 July and 5 August which induced the back decrease of the tensiometric pressures, particularly in August (−300 mbar to −200 mbar). The tensiometric pressure evolution, clearly depending of the soil rehydration by rainfall may be associated to the swelling-shrinkage properties of the clay dominant soil. The bulk volumetric evolution of the clay matrix has consequences on the inter clay particles microporosity and equivalent pore diameters (Figure 14). The disconnection of the porous plug observed the 14 August is explained by a shrinkage fracture opening which has reached the plug: the residual tensiometric pressures are effectively closed to zero.
At 60 cm deep, the tensiometric curve is smoothed in a smaller pressure domain according to the higher Wn of soil. The first pressure decrease observed from June to August is limited in the −120 to 190 mbar. The rainfall impact is very weak in July. It provokes only a stabilization of the measured pressures around −190 mbar without any disconnection of the plug. The third August-to-September period provokes a drastic increase of the tensiometric pressures without reaching the plug disconnection. The tensiometric pressure decrease may be explained by the progressive opening of mesopores (Figure 14).
At 90 cm depth, the tensiometric pressure curve is more smoothed in a −40 to −160 mbar domain. The three successive steps of desiccation (1), stabilization by rain fall (2) and late progressive mesoporosity opening (3) are smoothed without any disconnection of the plug. The late mesoporosity opening due to the August - September desiccation is limited to a −90 mbar upper increasing pressure.
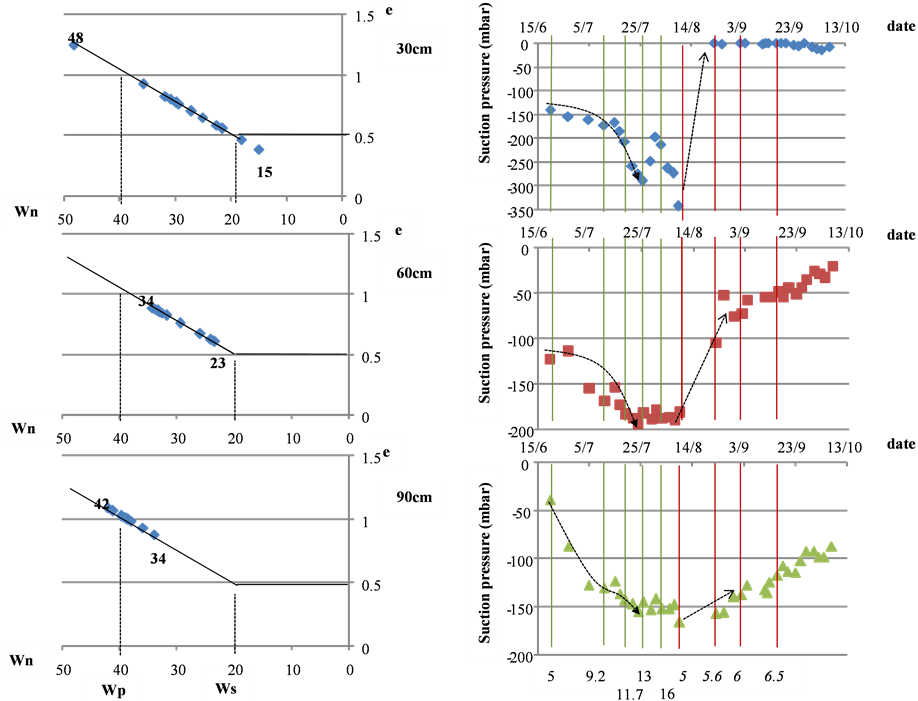
Figure 13. Schematic representation of the clay matrix microstructure evolution in the Wn-e diagram in parallel to the tensiometric profiles recorded in the A7 20 m corn field at 30, 60 and 90 cm depth. [5; 9.2; 11.7; 13; 16] = number of green sheets, [5; 5.6; 6; 6.5] = number of dried sheets.
 (a)
(a) (b)
(b)
Figure 14. Schematic representation of the mesopores and fracture opening of the clay matrix for the different Wn associated to increasing depths. (a) Ductile-to-brittle behavior of the clayey material taking into account the W-C couple evolution and the successive steps of fracturing: (1) ductile comportment in the plastic to liquid state domain, (2) plasticity limit (Wp), (3) brittle comportment in the solid state [30] [31] . W = gravimetric water content, e = void ratio, C = shear stress, Ø = equivalent pore diameter; (b) SEM microphotography of a mesopore adjacent to the Ws clay matrix [19] .
4. Discussion
The ETP and ETM measurements and/or calculations mainly depend of the soil surface parameters as weather and plant growing. Nevertheless, the only parameter taken into account for the plant-soil interaction is a crop coefficient (Kc): i.e. 1.00 for grassland and 0.3 to 1.15 for corn field. The question is: how to take into account the “physical” properties of soil in the plant growing mechanism and how to get ETP and/or ETM-soil structure relationship? It seems evident that the relationship may be proposed via the descending of the root network into the clayey soils.
The discussion of this work, performed on the West France coastal marshes, may be constructed: 1) on the previous knowledge of the microstructure-hydromechanical property relationship of the clay dominant soil and 2) on the Wn profile-water nape level couple in these territories managed by the drainage.
The soil structure-hydromechanical property relationship of theses clay dominant media were progressively proposed by Bernard (2006) and Gallier (2011) and others [25] [31] . They were simplified on a W-e-C-K crossed diagram with W the gravimetric water content, e the void ratio, C the shear stress and K the hydraulic conductivity of the clay matrix (Figure 15). The shrinkage curve-shear stress relationship was established as equations of Perdock type or power law [25] [27] [30] [31] .
The W-e-C-K crossed diagram clearly shows the shift from the liquid-to-plastic state and to the solid state behavior for microstructure characterized by Wn decreasing from Wl-Wp domain to the Wp-Wr domain respectively. The shift from the plastic to solid state would impact on the root growing by physical reactions at the root soil interfaces:
• facilities to expend and to “pump” water in highly porous, permeable and deformable plastic matrix;
• difficulties to get water from media characterized 1) by hydraulic conductivities decreasing down to 10−10 - 10−12 m/s and 2) by a drastic increase of mechanical resistances fighting against the volume root extension [36] [38] .
The calculation of the RUi available water capacity is based on the differences between the Wfc (equivalent or nearby Wp) and the Wwp (equivalent to Ws). In these conditions, the theoretical RUi profile is a vertical and linear representation of an available water capacity face to the plastic limit Wp of the clay dominant medium. Thus the calculation of the RUrW profiles, based on the real Wn profiles, may be considered, not only as a water quantity indicator, but also as an indicator of the clay dominant soil evolution towards its plastic state (right of the RUi line) or towards its solid state (left of the RUi line; Figure 16).

Figure 15. Schematic W-e-C-K crossed diagram representation of the hydromechanical behavior of the clay matrix face to its shrinkage curve (from Gallier et al., [30] [31] ). Kkc = kozeny Carman hydraulic conductivity, Koe = hydraulic conductivity obtained by oedometer tests, C = shear stress, W = gravimetric water content, e = void ratio.

Figure 16. Example of shifts of the RUrW profiles from each side of the RUi profile in the L3 grassland. Desiccation profile at 22 July shifts the RUrETP towards the solid state domain, the August rainfall period shifts the RUrETP towards the plastic state domain, RUrETP = profile of RUrETP at 22 July. Horizontal arrows indicate the shifts towards the solid or plastic states. Piezo depth = nape level.
In the grassland, according to the Wn profiles measured in theses marsh territories, and in spite of the high desiccation of July, the basis of the RUrW profiles are always in plastic domain of the clay matrix. The desiccation periods shift the RUrW profiles towards the solid state domain. Even if the RUrW profiles are drastically affected by the desiccation phenomenon near the surface, the RUrW profiles are always located between the RUrETP and RUi lines. It signifies that the crop coefficient Kc = 1 is realistic for the grassland, at least for root networks limited to about 50 cm depth. The progressive transition of the RUrW profiles from the subsurface layer to the residual plastic domain in depth corresponds to the transition between the water nape and dried surface layer: i.e.; domain of water capillarity ascent.
In the corn field, the three successive periods, desiccation (1), rainfall (2) and late desiccation (3) are clearly distinct (Figure 17). The successive desiccation trends imply the shift of the RUrETM profiles towards the vertical axe (RU = 0). The mechanism is associated to a progressive descend of the nape level from 40 cm to 100 and 120 cm depth. The upper concave part of the RUrW curve progressively descends along the vertical 0 axis indicating states near the wilting point (near 0). That indicates the necessity for roots to progress in depth beyond this minimum residual available water. The rainfall provokes a rising of the nape level to 60 cm depth and an increase of the RUrW without exceeding the RUETM profile.
During the desiccation periods the RUrW profiles shift progressively towards the RU = 0 axis, below the theoretical RUrETM. In spite of the weak Kc values considered at the beginning of corn growing, that is significant of an overestimation of the available water capacity at least in surface.
These measurements or calculations are limited to a characterization of the bulk behavior of the soil. In fact the clay particle rearrangements caused by the desiccation-rehydration cycles operate at the microstructure scale even if the consequences are observed at the macroscopic one. The state way of a clay matrix affected by a desiccation strain or by a mechanical strain (in drained domain) are superimposed on the shrinkage curve of the material [38] [39] . The clay particle rearrangements (face to face) are also increase along the root-clay matrix interface because of pressure applied by the growing root on the surrounding matrix. The clay particle rearrangements at these microsites scale works also to the decrease of hydraulic conductivity and increase of the mechanical resistance of the matrix. They also increase the necessity for roots to descent in more plastic state layers in depth.
5. Conclusions
The comparison, between the available water capacity profiles, calculated from the ETP (RUrETP) or ETM (RUrETM), and the real available water capacity profiles (RUrW), calculated using the moisture profiles of soils,

Figure 17. Example of shift of the RUrW profiles in the A7 20 m corn field. The desiccation periods (example of 22 July and after rainfall at 5 August) shift the RUrW to the RU = 0 vertical axis (solid state domain) on the top of the profiles. The rainfall period shifts the RUrW curve in the plastic state domain, on the right of the RUi line. Horizontal arrows = shift direction of the RUrW profiles, vertical arrows schematic representation of the descending of the root network.
allows a quantitative description of the desiccation front progression facing to the theoretical hydric potentials of the soils.
The method is applied to marshland territories which are characterized 1) by the clay-dominant nature of soils and 2) by their single moisture profiles inherited from their hydraulic management. The clay dominant nature induces soil structure behavior particularly sensitive to the desiccation and hydration cycles. The clay particle rearrangements caused by the desiccation directly impact the hydromechanical properties of the clay matrix: i.e.; mechanical resistance in reaction to the root growing and drastic decrease of the hydraulic conductivity facing to the water-root transfers.
The water content profiles characterized by the increase of the water contents from the surface to the depth are governed by 1) the nape level induced by the hydraulic management (drainage) and 2) the advance of the desiccation front. The shift of the real-time calculated RUrw profiles from the “theoretical” RUrETM or RUrETP ones clearly shows the decrease of residual available water provoked by the advance of the desiccation front and, consequently, the kinetics of water consumption by plants. Following the rain period it also shows the kinetic of soil rehydration.
Thanks to the soil microstructure-hydromechanical property relationship, the comparison with the initial available water capacity (RUi) allows a description and an explanation of the mechanisms which take into account the plastic to solid state behavior of the clay matrix. Firstly, the microstructure-hydromechanical relationship governs the root network progression. Secondly, the evolution of soil from its plastic to brittle state governs the shrinkage fracture network progression. This complementarity, between the microstructure of the clay matrix and the eventual mesoto macro-porosity opening, impacts the tensiometric pressure recordings at different depths.
The calculations show the realistic value of ETP for the grassland growing in the studied marshes. On the contrary the crop coefficients (Kc) used for the ETM calculation overestimate the available water capacity of the soil for the corn fields. The overestimation, observed at least in the upper layers, is offset by the stock of water in lower layers. This stock of water allows the good crop yields. The behavior of the RUrW profiles points to the necessity for the root network to descent in depth for insuring the corn water consumption. Nevertheless, even the drainage management, the crop yield would be rapidly limited by the salt nature of water in depth.
Finally, this simple method of comparison between the RUrW profiles and “theoretical” RUrETP or RUrETM profiles is well appropriated to evaluate the soil potential facing to crop fields. It also allows the verification of the crop coefficient realism.
Acknowledgements
The authors thank the Regional Council of Poitou-Charentes for the funding for this work during the 2011 to 2014 years via the research project THT Geomat.
References
- Blaney, H.F. and Criddle, W.D. (1964) Determining Water Requirements for Settling Water Disputes. Natural Resources Journal, 4, 29-41.
- Holdridge, L.R. (1962) The Determination of Atmospheric Water Movements. Ecology, 43, 1-9. http://dx.doi.org/10.2307/1932033.
- Thornthwaite, C.W. and Matter, J.R. (1957) Instructions and Tables for Computing Potential Evaporation and the Water Balance. Climatology, 10, 311.
- Garcia, J. and Lopez, J. (1970) Formula para el calculo de la evapotranspiratcion potencial adaptada al Tropico. Agronomia Tropical, 20, 335-345.
- Garnier, B.J. (1946) The Climates of New Zealand: According to Thornthwaite’s Classification. Annals of the Association of American Geographers, 36, 151-177.
- Turc, L. (1954) Le bilan d’eau des sols: Relations entre les precipitations, l’evaporation et l’ecoulement. Annales Agronomiques, 5, 491-595; 6, 5-131.
- Penman, H.L. (1954) Evaporation over Parts of Europe. Proceedings of the General Assembly of Rome, 3, 168-176.
- Monteith, J.L. (1965) Evaporation and Environment. Symposia of the Society for Experimental Biology, 19, 205-234.
- Bouchet, R.J. (1961) Signification et portee agronomique de l’evapotranspiration potentielle. Annales Agronomiques, 12, 51-63.
- Maftei, C., Gherghina, C., Gelmambet, S. and Buta, C. (2007) ETREF un logiciel qui calcule l’evapotranspiration de Reference. Annals of the Oradea University. Fascicle of Management and Technological Engineering, 6.
- Guyot, G. (1999) Climatologie de l’environnement—Cours et exercices corriges. Dunod, Paris, 525.
- Katerji, N. and Perrier, A. (1983) Modelisation de l’evapotranspiration reelle ETR d’une parcelle de luzerne: Role d’un coefficient cultural. Agronomie, 3, 513-521. http://dx.doi.org/10.1051/agro:19830603
- Badji, M., Feyen, J. and Basstanie, L. (1982) Effet du deficit en eau du sol sur l’evapotranspiration et la production de feveroles: Une evaluation de modeles. Agronomie, 2, 213-218.
- Oudin, L. (2004) Recherche d’un modele d’evapotranspiration Potentielle pertinent comme entree d’un Modele pluiedebit global. These de Doctorat a l’ENGREF.
- Pepin, S. and Bourgeois, G. (2012) Outils agro-meteorologiques pour la planification de l’irrigation des cultures. Colloque en Agroclimatologie CRAAQ-2012.
- Calvet, R. (2003) Le sol: Proprietes et fonctions. Tome 2 Phenomenes physiques et chimiques: Applications agronomiques et environnementales. France Agricole Editions, 511.
- Boisvert, J. and Dyer, J.A. (1987) Le coefficient de sol dans les modeles empiriques de bilan hydrique. Canadian Agricultural Engineering, 29, 7-14.
- Lecarpentier, C. (1975) L’evapotranspiration potentielle et ses implications geographiques. Annales de Geographie, 84, 385-414. http://www.persee.fr/web/revues/home/prescript/article/geo_0003-4010_1975_num_84_464_18972
- Radimy, R.T., Dudoignon, P., Hillaireau, J.M. and Deboute, E. (2013) Polder Effects on Sediment-to-Soil Conversion: Water Table, Residual Available Water Capacity and Salt Stress Interdependence. The Scientific World Journal, 2013, 451710. http://dx.doi.org/10.1155/2013/451710.
- Tournade, F. and Bouzille, J.B. (1991) Relations entre sol et vegetation dans les prairies naturelles humides du Marais Poitevin. Mise en evidence d’un modele d’organisation. Science du Sol, 29, 339-357.
- Tournade, F. and Bouzille, J.B. (1995) Determinisme pedologique de la diversite vegetale d’ecosystemes prairiaux du Marais poitevin: Application a la definition d’une gestion agri-environnementale. Etude et Gestion des Sols, 2, 57-72.
- Pons, Y. and Gerbaud, A. (2005) Classification agronomique des sols de marais a partir de la relation entre sodicite et stabilite structural. Application au cas des marais de l’ouest. Etude et Gestion des Sols, 12, 229-244.
- Pons, Y., Capillon, A. and Cheverry, C. (2000) Water Movement and Stability of Profiles in Drained, Clayey and Swelling Soils: At Saturation, the Structural Stability Determines the Profile Porosity. European Journal of Agronomy, 12, 269-279. http://dx.doi.org/10.1016/S1161-0301(00)00053-8
- Joulie, I., Perichon, C. and Pons, Y. (1996) Une typologie d’exploitations spatialisees: Outil de diagnostic regional de l’agriculture. Economie Rurale, 236, 16-27.
- Bernard, M. (2006) Etude des comportements des sols de marais: Evolution Mineralogique, Structurale et Hydromecanique. (Marais de Rochefort et Marais Poitevin) These de doctorat, Universite e Poitiers, Poitiers, 309.
- Bernard, M., Dudoignon, P., Pons, Y., Chevallier, C. and Boulay, L. (2007) Structural Characteristics of Clay-Dominant Soils of a Marsh and Paleosol in a Crossed Diagram. European Journal of Soil Science, 58, 1115-1126. http://dx.doi.org/10.1111/j.1365-2389.2007.00888.x
- Bernard-Ubertosi, M., Dudoignon, P. and Pons, Y. (2009) Characterization of Structural Profiles in Clay-Rich Marsh Soils by Cone Resistance and Resistivity Measurement. Soil Science Society of America Journal, 73, 46-54. http://dx.doi.org/10.2136/sssaj2007.0347
- Dudoignon, P., Causseque, S., Bernard, M., Hallaire, V. and Pons, Y. (2007) Vertical Porosity Profile of a Clay-Rich Marsh Soil. Catena, 70, 480-492.http://dx.doi.org/10.1016/j.catena.2006.12.002
- Dudoignon, P., Bernard-Ubertosi, M. and Hillaireau, J.M. (2009) Grasslands and Coastal Marshes Management: Role of Soil Structure. In: Schroder, H.G., Ed., Grasslands, Ecology, Management and Restore, Nova Science Publishers, New York.
- Gallier, J. (2011) Caracterisation des processus d’evolution structurale et de salinite des sols de marais cotiers par mesures mecaniques et geo-electriques in situ. These de doctorat, Universite de Poitiers, Poitiers, 218.
- Gallier, J., Dudoignon, P. and Hillaireau, J.M. (2012) Microstructure—Hydromechanical Property Relationship in Clay Dominant Soils. In: Aydinalp, C., Ed., An Introduction to the Study of Mineralogy, INTECH Open Access Publisher, 51-72.
- Chevallier, C. and Masson, D. (1988) Agriculture, conchyliculture et circulation des eaux de surface en Charente Maritime. Aqua Revue, 21, 27-33.
- Mathe, V. (2003) Signaux magnetiques dans les sols: Potentiel de la caracterisation de la texture d’un sol par les anomalies metriques et inframetriques. Prospection dans la zone humide des marais de l’Ouest de la France. These Doctorat, Universite de La Rochelle, La Rochelle, 163.
- Righi, D., Velde, B. and Meunier, A. (1995) Clay Stability in Clay-Dominant Soil Systems. Clay Minerals, 30, 45-54. http://dx.doi.org/10.1180/claymin.1995.030.1.05
- Giraud, F., Lachassagne, P., Ladouche, B., Weng, P., Pinault, J.L. and Chevalier, C. (2000) Etude hydrologique et hydrogeologique du marais Rochefortais (Charente-Maritime), BRGM/RP-50247-FR.
- Weng, P., Giraud, F., Flaury, P. and Chevallier, C. (2003) Characterising and Modelling Groundwater Discharge in an Agricultural Wetland on the French Atlantic Coast. Hydrology and Earth System Sciences, 7, 33-42. http://dx.doi.org/10.5194/hess-7-33-2003
- Montoroi, J.P. (1997) Conductivite electrique de la solution du sol et d’extraits aqueux du sol—Application a un sol sulfate acide sale de Bassa-Casamance (Senegal). Etude et Gestion des Sols, 4, 279-298.
- Dudoignon, P., Gelard, D. and Sammartino, S. (2004) Cam-Clay and Hydraulic Conductivity Diagram Relations in Consolidated and Sheared Clay-Matrices. Clay Minerals, 39, 269-279. http://dx.doi.org/10.1180/0009855043930134
- Biarez, J., Fleureau, J.M., Zerhounil, M.I. and Soepandji, B.S. (1987) Variation de volume des sols argileux lors de cycles de drainage-humidification. Revue Francaise de Geotechnique, 41, 63-71.