Journal of Geographic Information System
Vol.5 No.2(2013), Article ID:29778,13 pages DOI:10.4236/jgis.2013.52013
Geospatial Techniques for the Assessment and Analysis of Flood Risk along the Niger-Benue Basin in Nigeria
1Department of Geography and Regional Planning, University of Benin, Benin City, Nigeria
2Department of Geography and Regional Planning, Delta State University, Abraka, Nigeria
Email: *fil4all@yahoo.co.uk
Copyright © 2013 Felix Ndidi Nkeki et al. This is an open access article distributed under the Creative Commons Attribution License, which permits unrestricted use, distribution, and reproduction in any medium, provided the original work is properly cited.
Received January 24, 2013; revised February 24, 2013; accepted March 14, 2013
Keywords: Geospatial; MODIS; Buffer; Flood Disaster; Niger-Benue Basin
ABSTRACT
River flooding has become a widely distributed and devastating natural disaster that has caused significant damages both economically and socially. Recently, it displaced millions of people in Nigeria and submerged several square kilometres of landed area in general and farmlands in particular. Although, the National Emergency Management Agency (NEMA) predicted the occurrence of the flood disaster and advised the relocation of residence from the floodplain to the high ground, but spatial information pertaining to the areal extent vulnerable to the hazard was not made available. This study attempted to assess the spatial impact of the October 2012 flooding of the Niger-Benue basin on the surrounding areas using the moderate resolution imaging Spectroradiometre (MODIS) data of NASA Terra satellite and developed a geospatial methodology for detecting and extracting the flood risk areas and the vulnerable population to flooding within the basin. The integration of remotely sensed data and other spatial and non-spatial data within the GIS platform was able to produce series of thematic maps which was used to generate a geospatial database for flood risk analysis and assessment. The result of the analysis effectively demonstrated the contribution of geospatial methods in mitigating and monitoring the effect of flooding along the Niger-Benue basin. It was therefore, suggested that government agencies and policy makers should adopt this powerful technique for reliable and well synthesized information which is a vital component of flood risk assessment and planning.
1. Introduction
Floods have become a common natural disaster which has claimed many lives, displaced millions and resulted to the destruction of properties and degradation of contiguous farmlands. It is the most frequent and devastating natural disaster in the world. It is widely distributed leading to significant economic and social damages than any other natural disaster ([1] DMSG, 2001). Flood can simply be defined as a flow of water above the carrying capacity of a channel ([2] NOAA, 1998). It was defined loosely ([3] Olajuyigbe et al., 2012) as a large amount of water covering an area that was usually dry. [4] Nwafor (2006) defined flood as a natural hazard like drought and desertification which occurs as an extreme hydrological (runoff) event.
There are basically three major types of flood—river flood, coastal flood and urban flood. River flooding is a function of rainfall and runoff volumes within the river valley. Coastal flooding is typically a function of storm surge, waves (driven by wind) and heavy rainfall. Urban flooding results when development is concentrated within or along stream floodplains or channels. In Nigeria, documented evidence ([5] Ologunorisa, 2004; [6] Folorunsho; Awosika, 2001) have shown that these basic flood types are the major and frequent flood disaster that have occurred in the country over the years. Among these, river flooding is the most enormous and destructive. Unlike coastal and urban flooding, river flooding is much more widespread with respect to its catchment area. For instance, the prominent rivers found in Nigeria are Niger and Benue and they flow through numerous large urban centres. River flooding occurs in the floodplains of the larger rivers, while sudden, short-lived flash floods are associated with rivers in the inland areas where heavy rainfall can change them into destructive torrents within a short period ([5] Ologunorisa, 2004).
However, the fundamental cause of river flooding is excess runoff induced by heavy rainfall. This runoff is often obstructed by anthropogenic factors which involve the concentration of developmental activities along the river natural flow path (river valley). River flooding is a function of man’s interaction with the environment and consequently, this interaction has left man susceptible to flooding hazard which is an outcome of man’s interactive activities with the environment involving designing and locating infrastructure, exploiting natural resources, concentrating of population etc ([7] Hualou, 2011). Empirical researches ([8] Okereke, 2007; [9] Kolawole et al., 2011) have highlighted the basic consequences of flooding; these are loss of human lives, submerging of residences and streets, inflow to sewage, municipal pollution, and damage to properties, health hazards, cleanup cost, and disruption of services, traffic obstruction, aesthetic discolouring, economic loss and infrastructural damage. Numerous devastating river flood disaster in Nigeria have been reported by previous studies ([10] Adedeji et al., 2012; [3] Olajuyigbe et al., 2012; [9] Kolawole et al., 2011).
Recently, a widespread devastating flood disaster hit the country cutting across major cities in about 14 states that borders the Niger-Benue River. The worst affected states are Adamawa, Taraba, Benue, Kogi and Anambra in the east-central part of the country. This flood incident has been characterised as the most devastating since the last 40 years. The flood submerged houses, severed transportation routes throughout the affected areas (Figures 1 and 2).
Overall, an estimated 1.3 million people were displaced and about 431 people lost their lives. In addition, over 1525 square kilometres of farmland were destroyed ([11] MISNA, 2012). Although, the National Emergency Management Agency (NEMA) predicted the imminence of the flood disaster and advised the relocation of activities and residence from the floodplain to the upland, but spatial and synthesized information was not made available. Such information involves the detection of the areal extent along the Niger and Benue rivers that is at risk or vulnerable to flooding.
It is evident that planners and policy makers lack the required platform for producing such information. This is because, report ([12] NASA, 2012) shows that the numerous refugee camps which were setup in the presumed safe ground were equally overwhelmed by the flood. The substantive and sustainable approach to mitigate the effects of river flooding is to ensure that all areas that are vulnerable are identified for precautionary measures ([13] Ishaya et al., 2009). In addition, systematic (spatial) information is also needed for post impact assessment and quick estimation of the extent of damage. To deal with this, it is pertinent to adopt a powerful framework with geo-visualization capability to analyse, model and visualise output for effective decision making. The geospatial

Figure 1. Submerged houses along Niger River in Lokoja.

Figure 2. Severed major transportation route (LokojaAbuja) in Lokoja left travelers stranded.
technology involving the integration of geographical information system (GIS) and remote sensing technique is design in such a way that multi-dimensional data can be entered, manipulated, checked, analysed and displayed as data referenced to the earth. The utilisation of remotely sensed data in GIS environment has proved to be the most resourceful approach for river flooding assessment and risk analysis ([14] Jayasselan, 2006; [13] Ishaya et al., 2009; [15] Irimescu et al., 2010). Therefore, the substantive objectives of this paper are to: assess the spatial impact of the October 2012 flooding of the Niger-Benue basin on the surrounding areas using the moderate resolution imaging Spectroradiometer (MODIS) data of NASA Terra satellite; and develop a geospatial methodology for detecting and extracting the flood risk areas and the vulnerable population to flooding within the basin.
2. The Study Location
Nigeria is located geographically in the West African sub-region between latitude 4˚9'N to 13˚46'N and longitude 3˚45'E to 16˚54'E bordering the North Atlantic Ocean between Benin Republic and Cameroun. It covers a total area of about 923,770 km2 and its total land mass is about 910,770 km2 and water bodies of approximately 13,000 km2, along the Gulf of Guinea, its coastline stretches to about 853 km. With respect to the topographical settings, Nigeria can be categorised into five major geographic regions: a low coastal zone along the gulf of guinea; hills and low plateaus north of the coastal zone; the Niger-Benue River valley; a broad stepped plateau stretching to the northern border that has an elevation of over 1200 metres above sea level and a mountainous zone along the eastern border (near Cameroun), which includes the country’s highest point, Chappal Waddi (2419 metres above sea level) in Taraba State (Figure 3).
Three climatic types are experienced in the country, these are: arid in the north; tropical in the centre and equatorial in the south. Variations are governed by the interaction of moist southwest monsoon and dry northeast wind. Mean maximum temperature of 30˚C to 32˚C is experienced in the south and 33˚C to 35˚C is experienced in the north. High humidity is characterised from February to November in the south and from June to September in the north. Low humidity coincides with the dry season. Annual rainfall decreases northward, it ranges from about 2000 mm in the coastal zone (with an average of about 3550 mm in the Niger Delta) to 500 to 750 mm in the north. There are two principal water systems in Nigeria; these include the Niger-Benue basin and the Chad basin.
The Niger-Benue River constitutes the major surface water that drains almost all part of Nigeria (Figure 3). It is divided into three sections-the upper Niger (in the north-west); the lower Niger (in the south) and the Benue (in the north-east). The Benue basin which originated from the Mandara mountains in Cameroun is the major

Figure 3. Location of the study area showing the NigerBenue basin.
tributary of the Niger River (it empties its water into the Niger at Lokoja where confluence is formed).
The major tributaries of the Benue River in Nigeria are Katsina-Ala, Donga, Taraba, Gongola and Pai. The upper Niger River originated from the Fouta Djallon Massif in Guinea at an altitude of about 800 metres and flows northeast, traversing the inland Delta in Mali down to the Niger Delta in the gulf of Guinea. At the Nigeria section of the Niger River, numerous rivers such as Zamfara, Gulbin Ka, Kaduna, Gurara, Gbaka, Kontagora and Swahi empty’s their water into the Niger as it flows southward.
3. Data
The use of earth observation system (EOS) technology and GIS platform has become an integrated, well developed and reliable approach in disaster and risk management. This paper utilised the Moderate Resolution Imaging Spectroradiometre (MODIS) terra satellite image acquired through remote sensing technique and instruments onboard the National Aeronautics and Space Administration (NASA) earth observing system, this can be downloaded from the NASA’s website (http://modis.gsfc.nasa.gov/data). MODIS radiometer of the NASA’s terra satellite scans the earth with 36 spectral bands extending from the visible to the thermal infrared wave lengths ([16] Running et al., 1994). The first seven bands are designed basically for remote sensing to capture features on the earth surface at spatial resolutions of 250 metres for bands 1 and 2 and 500 metres for bands 3 to 7.
The MODIS instrument is operating on both terra and aqua spacecraft. It views the entire earth surface every one to two days with a swath width of 2330 km. Terra’s orbit around the earth is timed so that it passes from north to south across the equator in the morning, while aqua passes south to north over the equator in the afternoon. However, because of its numerous advantages, MODIS satellite image has become a reliable and popular data for disaster assessment and management. It has been use widely for flood mapping, flood assessment, warning, vulnerability analysis and mitigation ([17] Brakenridge et al., 2003; [18] Zheng et al., 2008; [15] Irimescu et al., 2010; [19] Islam et al., 2009). The major disadvantages of MODIS data is related to the amount of cloud cover and the resolution of 250 metres. This paper used the level B visible bands 1 and 2 (250 metres resolution) for detecting flooded area along the Niger-Benue River in Nigeria.
Other data includes topographic and hydrographic maps which were obtain from the National Space Research and Development Agency (NASDRA) in Abuja, Nigeria. Administrative maps (containing such elements as the national, state and local government area limits) and the 2006 population data disaggregated to the local government area (LGA) level were obtained from the National Population Commission (NPC) in Nigeria.
4. Methods and Instruments
The objectives of this paper are grouped into two—the assessment of the spatial impact of October 2012 flooding disaster on the affected areas and the detection of the potential flood risk zones along the Niger-Benue basin. Based on this, the methodology and analysis is approached from two perspectives.
MODIS time-series data was used to detect flooded surface along the Niger-Benue River by applying the Normalised Difference Vegetation Index (NDVI) and Normalised Difference Water Index (NDWI). These techniques use the short-wave infrared (which is highly sensitive to moisture content in the soil and vegetation) to detect water surface and discriminate it from the vegetative surface. This paper utilised MODIS image for two different years, the first was acquired in October 2008 and it shows the actual river width and channel of the Niger-Benue (Figure 4) and the second was acquired in October 2012 when flood disaster hit the country (Figure 5).
The latter captured the flood water which over flow the Niger-Benue banks and submerged several square kilometres of landed areas and engulfed lakes and ponds. These images use a combination of visible and infrared light to distinguish between river surface and land surface. The water surface ranges in colour from electric blue to navy blue and lighter shades of blue indicate shallow depths or heavy loads of sediments. Vegetation reflects bright green and the pale of blue to green represent clouds.

Figure 4. MODIS image of Nigeria (2008) showing the true width of the Niger-Benue River which is braided and characterised with isolated water bodies along its floodplain.

Figure 5. MODIS image of Nigeria (2012) showing the flooded area along the Niger-Benue River.
4.1. Extracting the Spatial Extent of the Flooded Areas along the Niger-Benue River
To extract and map the flood-affected areas, the timeseries MODIS data were entered into the Integrated Land and Water Information System (ILWIS) version 3.3 for projection. The Albers equal area conic projection method was applied according to the nearest neighbor re-sampling routine, and then entered into the ArcGIS version 9.3 for on-screen digitalisation. The true width of the river channel was extracted from Figure 4 as polygons (shape file) and in the same process, the flood mask along the river channel in Figure 5 was digitalised as polygons within the ArcMap/ArcInfo platform. The reason for the extraction of these water features from MODIS data and convert to GIS format is to facilitate topological overlay of such spatial data on other spatial and non-spatial data.
Accordingly, the Niger-Benue River layer and the flood mask layer were both overlaid on the administrative map layer which is disaggregated to the LGA level (Figure 6). Spatial erase was carried out on the new map to erase the river feature that falls within the area of the flood polygon; this also removed the true width of the Niger-Benue River from the area affected by flood (Figure 7). This procedure was able to separate the flooded area from the actual river channel so as to reveal the spatial extent of the flood.
With the application of GIS spatial analysis, water covered area is synthesized. After the spatial erasing of the true river channel, the flooded area marked by red color is mapped out (Figure 7). The overall affected area along the river basin is 13,702 km2. For the purpose of further analysis, the maximum width of the affected area (i.e. from side to side) is approximately 40 km, this occurred at the lower part of the basin and the minimum width is 1.5 km.

Figure 6. An overlay analysis of administrative element and spatial data extracted from MODIS data. The polygons represent the 774 LGAs of the country.

Figure 7. Spatial extent of the October 2012 flood disaster along the Niger-Benue River.
4.2. Flood Risk Analysis
Risk analysis involves the determination of the population exposed or susceptible to a particular hazard. In this paper, the elemental factors of flood exposure, such as the topographical, hydrologic structure and population distribution are taken into consideration. Combining with demographic data, the spatial distribution of population at risk to flood hazard is derived based on overlay analysis and buffer analysis ([18] Zheng et al., 2008). These spatial data, retrieved in raster format were converted to vector within the ArcGIS platform. To integrate these data from disparate sources, it was necessary to perform various analytical operations such as data layers coordinate systems projection. In order to estimate the potential population at risk for mitigation purposes and quick response, the Nigeria census data of 2006 was applied and mapped (Figure 8). The three vector layers to be integrated (elevation, hydrographic and population distribution layers) were projected to WGS 1984 web Mercator coordinate system. With respect to the population layer, the spatial (administrative elements) and non-spatial (population figures) data were integrated to create a database of the population spatial spread.
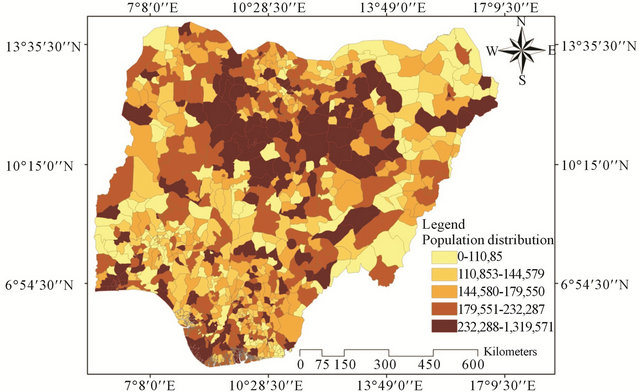
Figure 8. Population distribution of Nigeria by LGA.
The methodology developed in this study pertaining to flood risk mapping and analysis is based on various GIS operations on graphic and non-graphic data. This method is summarised in the methodological flow chart (Figure 9). The vectorised river basin (which includes the NigerBenue and their major tributaries) was buffered and a 20-kilometre buffer distance was chosen on both side of the river channel (which is equivalent to 40 km across). Progressively, a 6-kilometre and 13-kilometre buffer distances on both side (equivalent to 12 km and 26 km across respectively) were identified within the 20-kilometre buffer. The 20-kilometre and 6-kilometre buffer distances were derived from the maximum and minimum width respectively of the flooded area detected in previous analysis. The 13-kilometre buffer distance is derived from the mid-point (average) between the maximum and minimum buffer distances. This multi-ring buffered layer was overlaid on the vectorised topographic layer within the ArcGIS platform (Figure 10).
To extract the potential flood risk areas, from the buffered river basin and topographic map, spatial intersect and erase overlay techniques were applied. Classification of the flood prone areas by magnitude was carried out based on elevation and distance from the rivers. This is because the impact of river flooding decreases with increasing distance from the river channel. Elevation on the other hand, is a paramount feature of river flooding determinant. It has been used to assess the spatial distribution of potentially endangered flood areas ([20] Taubenbock et al., 2011; [13] Ishaya et al., 2009). However, the classification was done in such a way that the 6 km buffered distance at both sides of the rivers that falls between 0 - 153 m elevation above sea level was classified

Figure 9. Methodological flow chart of flood risk analysis.
as high flood risk area. The medium flood risk area was derived from 13 km buffered distance from the rivers of the basin that falls between 0 - 153 m heights. The low risk area includes the 20 km buffered distance which falls between 154 - 306 m elevations (Figure 11).
The overlay operation (spatial intersect and erase) revealed the spatial distribution of flood risk areas along the Niger-Benue basin and this extracted component was further overlaid on the population distribution map of Nigeria to show the area and population that are vulnerable to flooding disaster. The spatial intersect overlay

Figure 10. An overlay of the buffered river basin and the digitally generated elevation map.

Figure 11. Flood risk detection of Nigeria along the Niger-Benue basin by magnitude of high medium and low risk areas.
method was able to copy the attributes of the population distribution layer and the flood risk magnitude layer (buffered distances) to create a new layer. Such attributes include the population figures by LGA, the size and administrative boundaries of each LGA that falls within the buffered distances. Spatial erase method was used to cut off the true river channel of the drainage basin from the high flood risk magnitude section. In the same way, the overlapping sections that lies between the high, medium and low flood risk magnitude were erased (this GIS operation includes cutting off the attribute and non-attribute data of these flood magnitude layers). The reason for applying this technique is to avoid overestimation; this is because the buffered distances are independent of each other (i.e. each of the magnitudes was buffered directly from the river channel). Furthermore, the spatial union overlay method was applied; this is because it provides the platform to join the overall components (attribute and non-attribute data) of each layer into one layer. The output feature of this operation gives a quick, effortless and precise calculation of the spatial extent and population at risk by magnitude (Figure 12). In this paper, one weakness of the overlay method is that the overall population of a LGA that is affected is included, whether or not the LGA is entirely submerged. To check this weakness, the affected portions of each LGA (by magnitude) were cal-

Figure 12. Spatial distribution of population at risk to flood disaster along the Niger-Benue basin. High, medium and low risk areas are represented by red, tourmaline green and leaf green colours respectively.
culated in percentage and the resulting values were used to update the attribute table. This was done so as to extract and estimate the proportion of the population corresponding to the affected portion of each LGA. Population spatial distribution which can be expressed as either the absolute number of people per mapping unit, or as population density has been used by researchers ([18] Zheng et al., 2008; [20] Taubenbock et al., 2011) to assess and estimate the number of people exposed to floor risk.
5. Results and Discussion
5.1. The Spatial Impact of the October 2012 Flood Hazard
In this study, the spatial impact is measured by the proportion of the submerged land territory. Overall, the result shows that 13,702 km2 of landed area was submerged by the flood disaster (excluding the true water path) and the effect of the flood hazard is spread across 58 LGAs of 14 states (Figure 13). The result of the analysis indicates that Taraba state is the most affected with 3830 km2 of its land territory submerged in 6 LGAs. This is followed by Kogi with 2787 km2 of its land submerged in 9 LGAs and next to this is Niger with 1502 km2 of its land submerged in 6 LGAs. Another group of high flood impact areas are Anambra, Adamawa, Benue and Nassarawa with submerged land territories of 1279 km2, 1109 km2, 1109 km2 and 932 km2 respectively. Others are Delta—323 km2; Edo—315 km2; Kwara—300 km2; Rivers—128 km2; Bayelsa—48 km2; Enugu—31 km2 and Imo—9 km2. Table 1 and Figure 14 reveal two outliers with respect to the proportion of submerged areas. The outliers are Anambra west and Onitsha south LGAs of Anambra state; these areas were submerged by 100 percent.
The water mask extracted from MODIS data which was integrated with other data provides the platform for the estimation of the spatial impact of river flood hazard. The result is a vital database for the assessment and identification of flood ravaged areas with respect to rapid response, provision of aids and for the purpose of further analysis.
5.2. Population and Area Vulnerable to Flood Disaster
The result of the previous analysis (with respect to the identified maximum and minimum width of the flooded area extracted from MODIS satellite image), assisted in the development of a flood risk analysis methodology which was applied to detect the areas and population exposed to the risk of flooding along the Niger-Benue basin. The result indicates that very high population concentrated areas exposed to high flood risk magnitude is found in Yenegoa (Bayelsa state), Aguata, Nnewi South, Ogbaru (Anambra state), etc. For example, in Yenegoa there are 302,782 people estimated to be exposed to high flood risk along the Niger-Benue basin with 630 km2 of land susceptible to flooding. This is because it is located at the floodplain of the Niger delta and characterised with high population concentration. The summary of the flood risk analysis result is shown in Table 2.
The result of the analysis shows that the methodology of flood risk detection developed in this study is effective

Figure 13. States affected by the October 2012 flood disaster.

Figure 14. Percentage of the areas (LGA) submerged by flood.
and suitably applicable to identify the flood vulnerable areas and estimate the population at risk along the Niger-Benue basin. The GIS-assisted flood risk database generated can aid and facilitate spatial planning and quick response. It provides the platform for querying information about risk prone areas along the drainage basin (Figure 15). The classification of the flood vulnerable areas into magnitudes presents a wide range of options to explore with respect to planning and various levels of decision making processes. For example, the generated database has the potential to estimate the number of people living in flood prone areas and to identify flood risk disaster zones based on varying degree. It can also assist disaster managers to select appropriate site for camping flood affected victims and give quick visual estimation of the potential high impact areas.
6. Conclusions and Policy Implication
Conventionally, flood emergency management, both public and private, usually responds to crises rather than being concerned with the fundamental issues of vulnerability and its management ([21] Shrubsole, 2001). The primary reason for this is the lack of information available to assess past and future flood events. The results of this study revealed the manifold and multi-dimensional
Table 1. Attributes of flood affected areas by states and LGAs.


Continued
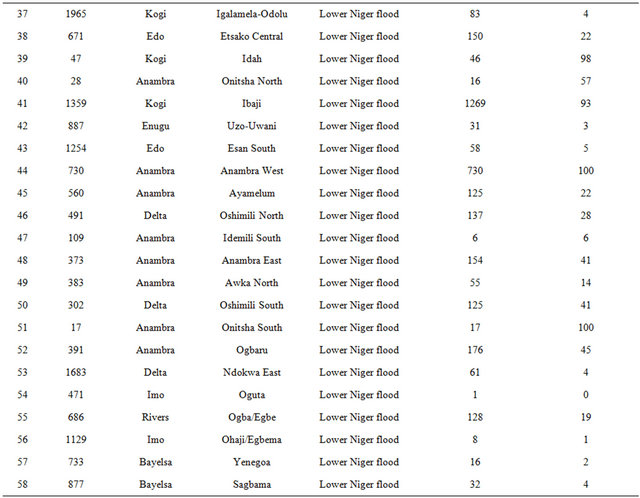
Percentage is in absolute value (value less than 0.5% is approximated to 0).
Table 2. Summary of the flood risk analysis by magnitude.

capabilities of integrating multi-scale and multi-temporal data for flood risk analysis and assessment. Rapid response MODIS data showed the vital aspect that remotely sensed spatial data can play in the assessment of river flood impact. It was able to extract the flooded areas along the Niger-Benue River and assess the spatial impact. Furthermore, it assisted in producing inundation map of the spatial distribution of the typical October 2012 flood affected areas. Remotely sensed MODIS image is basically the most independent, up-to-date and near real time data source for flood assessment and mapping.
Meanwhile, the integration of demographic data, digitally derived elevation map and administrative elements were effective in determining the vulnerable population and area to flooding hazard along the Niger-Benue basin. This was achieved by applying numerous GIS techniques within the geo-processing ability of the ArcGIS software. The robust methodology developed in the study being evidence for the effectiveness of the results, this can be seen in the series of thematic maps generated, which constitute a geospatial database for informed decision making. The results of the analysis have direct application in the formation of policies on disaster management, flood prediction, risk assessment, ad-hoc coordination of rescue measures and provision of aids. It provides integrative and collaborative framework for stakeholders in flood hazard management, emergency response and other government and non-governmental organisations to make vital decisions and policies on flood mitigation.

Figure 15. Query within the GIS platform. This query reveals that the selected medium flood risk section (marked by the rectangular feature) in Ajaokuta LGA of Kogi state has an estimated population of 34,993 and 387 km2 of land exposed to the risk of flood hazard and this constitute 28.6% of the administrative territory of the LGA.
It is therefore suggested that there should be transdisciplinary collaborations between geospatial scientists from federal and state research institutions and decision makers from National Emergency Management Agency (NEMA), National Space Research and Development Agency (NASDRA), Niger-Benue River basin development commission, Nigeria Meteorological Agency (NIMET) and other planning institutes in Nigeria. Furthermore, decision makers in Nigeria should consider the creation of a rapid mapping agency equipped with real-time satellite data for spatial planning, identification of disaster prone areas and coordination of plans and rescue measures. In conclusion, geospatial technology has opened up a new frontier for spatial planning and a diverse spectrum of capabilities in the area of flood risk analysis and assessment and must become an essential platform for decision making.
REFERENCES
- DMSG-Disaster Management Support Group, “The Use of Earth Observing Satellites for Hazard Support Group,” Final Report, NOAA, Department of Commerce, USA, 2001.
- NOAA Coastal Services Centre, “Glossary of Coastal Terminology,” 1998, Publication No. 98-105.
- A. E. Olajuyigbe, O. O. Rotowa and E. Durojaye, “An Assessment of Flood Hazard in Nigeria: The Case of Mile 12, Lagos,” Mediterranean Journal of Social Sciences, Vol. 3, No. 2, 2012, pp. 367-375.
- J. C. Nwafor, “Environmental Impact Assessment for Sustainable Development: The Nigerian Perspective,” Enugu EL DEMAK Publications, 2006.
- E. T. Ologunorisa, “An Assessment of Flood Vulnerability Zones in the Niger Delta, Nigeria,” International Journal of Environmental Studies, Vol. 61, No. 1, 2004, pp. 31-38. doi:10.1080/0020723032000130061
- R. Folorunsho and L. F. Awosika, “Flood Mitigation in Lagos, Nigeria through Wise Management of Solid Waste: A Case of Ikoyi and Victoria Islands, Nigeria,” UNESCO-CSI Workshop, Maputo, 2001.
- L. Hualou, “Disaster Prevention and Management: A Geographical Perspective,” Disaster Advances, Vol. 4, No. 1, 2011, pp. 3-5.
- R. A. Okereke, “Incidence of Flooding in Southern Nigeria,” International Journal of Environmental Issues, Vol. 5, No. 1-2, 2007, pp. 20-28.
- O. M. Kolawole, A. B. Olayemi and K. T. Ajayi, “Managing Flood in Nigerian Cities: Risk Analysis and Adaptation Options-Ilorin as a Case Study,” Scholars Research Library, Vol. 3, No. 1, 2011, pp. 17-24.
- O. H. Adedeji, B. O. Odufuwa and O. H. Adebayo, “Building Capabilities for Flood Disaster and Hazard Preparedness and Risk Reduction in Nigeria: Need for Spatial Planning and Land Management,” Journal of Sustainable Development in Africa, Vol. 14, No. 1, 2012, pp. 45-58.
- MISNA-Missionary International Service News Agency, “Floods from North to South, Alarm for Crops,” 2012. http://reliefweb.int/report/nigeria/floods-north-south-alarm-crops
- NASA-National Aeronautics and Space Administration, “Flooding in Nigeria,” 2012. http://earthobservatory.nasa.gov/IOT/view.php?id=79404
- S. Ishaya, O. O. Ifatimehin and I. B. Abaje, “Mapping Flood Vulnerable Areas in a Developing Urban Centre of Nigeria,” Journal of Sustainable Development in Africa, Vol. 11, No. 4, 2009, pp. 180-194.
- A. T. Jayasselan, “Drought and Floods Assessment and Monitoring Using Remote Sensing and GIS,” Proceedings of the Training Workshop on Satellite Remote Sensing and GIS Applications in Agricultural Meteorology, World Meteorological Organisation, Geneva, 2004, pp. 291-313.
- A. Irimescu, V. Craciunescu, G. Stancalie and A. Nertan, “Remote Sensing and GIS Techniques for Flood Monitoring and Damage Assessment Study Case in Romania,” 4th International Scientific Conference BALWOIS, Ohrid, 2010, pp. 1-10.
- S. W. Running, C. O. Justice, V. V. Salomonson, D. Hall, J. Barker, Y. J. Kaufman, A. H. Strahler, A. R. Huete, J. P. Muller, V. Vanderbilt, Z. M. Wan, P. Teillet and D. Carneggie, “Terrestrial Remote Sensing Science and Algorithms Planned for EOS/MODIS,” International Journal of Remote Sensing, Vol. 15, No. 17, 1994, pp. 3587-3620. doi:10.1080/01431169408954346
- G. R. Brakenridge, E. Anderson, S. V. Nghiem, S. Caquaed and T. B. Shabaneh, “Flood Warnings, Flood Disaster Assessments, and Flood Hazard Reduction: The Roles of Orbital Remote Sensing,” Proceedings of the 30th International Symposium on Remote Sensing of Environment, Honolulu, 2003, pp. 1-6.
- N. Zheng, K. Takara, Y. Tachikawa and O. Kozan, “Analysis of Vulnerability to Flood Hazard Based on Land Use and Population Distribution in the Huaihe River Basin, China,” Annuals of Disaster Prevention Research Institute, Vol. 51, No. 2, 2008, pp. 83-91.
- S. A. Islam, S. K. Bala and A. Haque, “Flood Inundation map Bangladesh Using MODIS Surface Reflectance Data,” Proceedings of the 2nd International Conference on Water and Flood Management (ICWFM), Dhaka, 2009, pp. 739-748.
- H. Taubenbook, M. Wurm, M. Netzband, H. Zwenzner, A. Roth, A. Rahman and S. Dech, “Flood Risks in Urbanised Areas-Multi-Sensoral Approaches Using Remotely Sensed Data for Risk Assessment,” Natural Hazards and Earth System Sciences, Vol. 11, No. 2, 2011, pp. 431-444. doi:10.5194/nhess-11-431-2011
- D. Shrubsole, “The Cultures of Flood Management in Canada: Insights from the 1997 Red River Experience,” Canadian Water Resources Journal, Vol. 26, No. 4, 2001, pp. 461-479. doi:10.4296/cwrj2604461
NOTES
*Corresponding author.