American Journal of Analytical Chemistry
Vol. 3 No. 2 (2012) , Article ID: 17282 , 7 pages DOI:10.4236/ajac.2012.32015
The Electrocatalytic Activity of Bare Pyrolytic Graphite and Single Wall Carbon Nanotube Modified Glassy Carbon Sensors Is Same for the Quantification of Bisoprolol Fumarate
Department of Chemistry, Indian Institute of Technology Roorkee, Roorkee, India
Email: *rngcyfcy@iitr.ernet.in
Received November 15, 2011; revised December 20, 2011; accepted December 29, 2011
Keywords: Voltammetry; Bisoprolol Fumarate; Carbon Nanotube; Edge/Basal Plane Pyrolytic Graphite; Pharmaceutical Samples; Human Urine
ABSTRACT
A comparison of voltammetric behavior of bisoprolol fumarate (BF) at edge and basal plane pyrolytic graphite electrodes (EPPGE/BPPGE) has been made with single wall carbon nanotube modified glassy carbon. The electrochemical properties are investigated exercising the cyclic voltammetry and square wave voltammetry (SWV). Enhanced peak current associated with bisoprolol fumarate oxidation at EPPGE is due to its better electron transfer property. Quantification of bisoprolol fumarate was carried out at pH 7.2 at both the pyrolytic graphite electrodes. Well-defined peak has been observed at ~792 and 954 mV at EPPGE and BPPGE respectively for bisoprolol fumarate oxidation. The detection limit is found to be 2.8 × 10⁻⁷ M and 7.3 × 10⁻⁷ M for EPPGE and BPPGE respectively. A comparison of common quantification parameters for bisoprolol at carbon nanotube modified glassy carbon electrode and bare BPPGE and EPPGE has been made and it is observed that carbon naotube modified glassy carbon exhibits sensitivity and detection limit close to that observed at bare basal plane pyrolytic graphite electrode. The method developed is applicable for determination of bisoprolol fumarate in pharmaceutical preparations and real samples.
1. Introduction
Bisoprolol fumarate (BF, Scheme 1) is a highly selective beta1 adrenoreceptor blocker drug and it blocks the action of certain chemicals on the heart and blood vessels. This effect lowers the heart rate, reduces blood pressure and increases the intake of oxygen and blood into the body [1]. However an overdose of BF has some complications associated with it. Administration of BF should always be stopped immediately with the appearance of the signs of overdose. Some of the most common symptoms of BF overdose are hypoglycemia (low blood sugar), congestive heart failure, bronchospasm, bradycardia (slow heart rate), and hypotension (low blood pressure). People suffering from the adverse effects of the overdose require an urgent treatment to overcome the adverse effect of the overdose [2].
Regular intake of BF also results in the improvement of exercise capacity [3] and has been prohibited by world anti-doping agency (WADA) in the sports events [4]. Hence, reliable and cost effective methods are required for rapid quantification of BF. In recent years, several methods have been proposed for the determination of bisoprolol [5-8]. Most of them are chromatography based methods. Ding et al. described the LC-ESI-MS method for determination of bisoprolol and obtained a linear calibration plot in the concentration range 0.05 - 120 ng/mL [5]. Tutunji et al. [6] have reported determination of bisoprolol by high performance liquid chromatogramphy (HPLC) coupled with tandem mass spectrometry and

Scheme 1. Bisoprolol fumarate.
the detection limit for bisoprolol was found to be 0.1 ng/mL. Another HPLC based method was developed by Joshi and coworkers where the detection limit for BF was determined to be 0.01 µg/mL [7] and the developed method was successfully applied for the determination of BF in commercial tablets. Recently Wang et al. have described electrochemiluminescence coupled with capillary zone electrophoresis for determination of bisoprolol and the detection limit was found to be 0.3 µM [8].
Chromatography based methods are time consuming, require costly instrumentation and have a high operational cost. In recent years, electro-analytical methods have attracted considerable interest for the determination of various drugs and biomolecules [9-12]. Electro-analytical methods have an edge over the chromatographic techniques on account of their simplicity and low operational cost. A recent article from our laboratory has demonstrated the determination of BF at single-walled carbon nanotube (SWNT) modified glassy carbon electrode [13]. However, the peak observed was very broad in linear sweep voltammetry and close to background in differenttial pulse voltammetry and thus made the recognition and accurate determination of peak potential and peak current difficult. Also, later investigations revealed that the electrocatalytic activity of single-walled carbon nanotube is due to metallic impurities present in nanotube [14,15]. To make determination more reliable, it was considered desirable to skip the time consuming electrode modification process in this article and compare the voltammetric response of simple basal plane pyrolytic graphite electrode (BPPGE) and edge plane pyrolytic graphite electrode (EPPGE) for the determination of BF in a quest to develop better electrochemical sensor. It was observed that the voltammetric response of bisoprolol at bare EPPGE is comparable to single-walled carbon nanotube modified glassy carbon electrode.
2. Experimental
2.1. Reagents and Materials
Edge/basal plane graphite pieces were purchased from Pfizer (USA). Pure BF in powdered form was obtained as a gift sample from Unichem Laboratories Ltd., Raigad, India. Tablets of BF marketed by different pharmaceutical companies were purchased from the local pharmacy. Method of Christian and Purdy [16] was followed to prepare phosphate buffer solutions (1.0 M). All other reagents used were of analytical grade. All solutions were prepared in double distilled water.
2.2. Instrumentation
The electrochemical experiments were performed using BAS (Bioanalytical Systems, West Lafayette, IN, USA) CV-50W voltammetric analyzer and were carried out in a single-compartment three-electrode glass cell with EPPGE/BPPGE as the working electrode, a platinum wire as counter electrode and Ag/AgCl electrode as reference (BAS; Model MF-2052 RB-5B) electrode. EPPGE/ BPPGE was prepared as reported in literature [17]. The SWNT modified glassy carbon electrode was prepared by reported method [13]. All experiments were carried out at room temperature (26˚C ± 2˚C).
2.3. Procedure
A stock solution of BF (1 mM) was prepared in doubly distilled water. Required amount of the stock solution was added to 2 mL of phosphate buffer solution and the total volume was made to 4.0 mL with double distilled water. The electrochemical measurements were then carried out. Initial electrochemical studies were carried out using cyclic voltammetry. The solutions were deoxygenated by bubbling high-purity nitrogen for 12 - 15 min before recording the cyclic voltammograms. Cyclic voltammograms were recorded in the sweep range 10 - 1000 mV·s–1 with initial sweep to positive potentials. The electro-analytical determination of BF was carried out employing square-wave voltammetry. The optimized parameters for determination of BF using square-wave voltammetry are as follows: Initial E: 400 mV, final E: 1200 mV, step E: 4 mV, square-wave amplitude: 30 mV, square-wave frequency: 15 Hz. The electrode surface was cleaned after each run by rubbing it on an emery paper followed by washing with a jet of distilled water and touching onto soft tissue paper. As the electrode surface area gets changed each time due to the cleaning process, hence, voltammetric measurements were performed in triplicate and an average value of the current is reported.
The human urine samples of patients undergoing pharmacological treatment with bisoprolol were obtained from the Indian Institute of Technology Hospital, Roorkee. The samples were obtained after 10 h of administration of Zabesta tablet. The samples were used after two times dilution to reduce the matrix complexity.
3. Results and Discussion
3.1. Determination of Surface Area
Chronoampereometric experiments were performed using 1 mM potassium ferrocyanide as redox substrate for the approximation of the surface area of EPPGE/BPPGE. Area of the electrodes is calculated on the basis of equation  where i is current in A, n is the number of electrons involved in overall electrode reaction, F is faraday constant (in coulombs), A is surface area of electrode in cm2, Do is diffusion coefficient in cm2/s, Co is bulk concentration in moles per mL and t is time in seconds [18]. On substituting the value of (it1/2) from the chronoampereometric curve for BPPGE/EPPGE and the values of the constants (n = 1, F = 96485, Do = 6.3 × 10⁻⁶, Co = 1 × 10⁻⁶, p = 3.14) in the equation, the surface area of BPPGE and EPPGE is calculated as 0.21 and 0.19 cm2 respectively; which are comparable and nearly equal within experimental limits. A comparison of SEM images of bare BPPGE and EPPGE is presented in Figure 1 which clearly indicates that EPPGE has steps, whereas, the surface of BPPGE is rough. The SWNT modified glassy carbon had a surface area of 0.28 cm2.
3.2. Voltammetric Behavior of Bisoprolol Fumarate
Initial studies on electro-oxidation of BF were carried out using cyclic voltammetry. It was found that when the scan rate was fixed at 20 mV/s, BF showed a well-defined oxidation peak at ~ 985 and ~ 858 mV potential at BPPGE and EPPGE respectively in phosphate buffer medium of pH 7.2 as shown in Figure 2. The oxidation peak of BF is more sharp and well-defined at EPPGE in comparison to BPPGE. No other peak was observed in cyclic voltammetry, hence, it is concluded that BF is irreversibly oxidized when the sweep is initiated in the positive direction. A systematic scan rate study was carried out to establish the nature of electrode reaction at EPPGE. Scan rate of cyclic voltammograms was varied in the range 10 - 1000 mV/s in phosphate buffer solution of pH 7.2. The analyte peak current was found to increase with increasing scan rates and the plot of  versus log v clearly indicated that the electrode process is adsorption controlled [19,20].
In view of the reported better sensitivity of square-wave voltammetry for analytical purpose, the technique has been employed for voltammetric quantification of BF. Initially, square wave voltammograms were recorded for 50 µM BF at basal plane and edge plane pyrolytic graphite electrode in phosphate buffer solution of pH 7.2 as shown in Figure 3. The drug was oxidized at ~ 954 mV with a very low current value at basal plane electrode. EPPGE was then used as the working electrode at which an oxidation peak was observed at ~ 792 mV with a marked increase in the current. Thus, the exposed edge plane sites in EPPGE contribute in making it an efficient sensor which enhances the kinetics of the electrochemical process and oxidation potential shifted to less positive potentials.
3.3. Concentration Study
The quantitative analysis of the drug was based on the dependence of the peak current on the concentration of BF. Typical square wave voltammograms depicting the systematic increase in the peak current values with an increase in the concentration in the range 0.5 - 100 µM at bare EPPGE is presented in Figure 4. The linear calibration plot at bare EPPGE along with error bars is presented in the inset. While in the case of bare BPPGE, the observed concentration range is 1.0 - 100 µM. The peak current is found to increase linearly with increasing concentration of BF and the linear regression equation at both the electrodes can be expressed as:
 (a)
(a) (b)
(b)
Figure 1. A comparison of FE-SEM images of (a) basal plane of PGE; (b) Edge plane of PGE with SWNT modified glassy carbon.

Figure 2. Typical cyclic voltammograms observed for 25 µM BF in phosphate buffer solution of pH 7.2 at bare EPPGE (¾) and bare BPPGE (− − −) at 20 mV∙s−1.

Figure 3. Comparison of square-wave voltammograms of 50 µM BF (pH 7.2) at (a) bare EPPGE (¾), (b) bare BPPGE (− − −), and (c) background phosphate buffer solution at pH 7.2 at bare EPPGE (…...).

Figure 4. Osteryoung square wave voltammograms recorded for (a) phosphate buffer solution (background) at EPPGE ( ∙∙∙∙∙∙ ) and (b) increasing concentration of BF at the electrode ( — ) [Curves were recorded at (i) 0.5; (ii) 1; (iii) 10; (iv) 25; (v) 50; (vi) 75 and (vii) 100 µM concentration in phosphate buffer solution of pH 7.2]. The observed calibration curve of peak current on BF concentration measured at pH 7.2 at EPPGE is presented in inset.
 at bare EPPGE
 at bare BPPGE
where C is the concentration of BF. The correlation coefficients for the expressions were 0.9971 and 0.9918 for bare EPPGE and BPPGE respectively. The current values are obtained by subtracting the background current and are reported as an average of at least three replicate determinations. The detection limit of the proposed method was calculated by using the formula , where σ is the standard deviation of the blank and b is the slope of the calibration curve and was found as 2.8 × 10⁻⁷ M and 7.3 × 10⁻⁷ M for bare EPPGE and BPPGE respectively. The sensitivity was estimated to be 0.86 µA·µM−1 and 0.43 µA·µM−1 for bare EPPGE and BPPGE respectively. However, just to see the effect of surface modification of BPPGE and EPPGE by single wall carbon nano tube, experiments were carried out using pyrolytic graphite electrodes modified with 40 µL suspension of carbon nanotube (1 mg/10 mL of dimethylformamide). The peak potential of BF was found to shift to less positive potentials by 75 mV at both the electrodes and peak current increased to almost 1.5 times as compared to bare BPPGE and EPPGE. This indicates that as expected, the surface modification further increased the sensitivity of determination of BF. However, as the aim of the studies was to avoid the use of surface modification procedure, studies were carried out at bare pyrolytic graphite electrode. Since, bare EPPGE exhibited better analytical performance in comparison to bare BPPGE, hence, further investigations were carried out at bare EPPGE.
3.4. Influence of pH and Square Wave Frequency
The pH of the supporting electrolyte affects the oxidation peak potential of BF. The voltammetric oxidation of 50 µM BF was examined in the range 3.3 - 11.0 in phosphate buffer solution. The peak potential (Ep) of the drug shifted towards less positive potentials with increase in pH. The linear dependence of the peak potential on pH at the EPPGE is represented by the following equation:

versus Ag/AgCl (R2 = 0.9953)
The dEp/dpH value of ~ 60 mV/pH indicates that equal number of protons and electrons are involved in the oxidation of BF.
The dependence of peak current and peak potential of BF on the square wave frequency (f) was studied in the range 5 - 200 Hz. The peak current was found to increase linearly with square wave frequency and the linear relation between ip and f can be expressed by the equation:
 (R2 = 0.9935)
The peak potential of BF shifted towards more positive potential with increase in square wave frequency. The plot of Ep versus logf was linear and the variation can be expressed by the relation:
 (R2 = 0.9878)
These observations are in agreement with the properties of irreversible electrochemical process which is adsorption controlled [21-23]. The results supported the inferences obtained from cyclic voltammetry studies.
3.5. Pharmaceutical Formulations
To determine the utility of the method for pharmaceutical industry, various BF containing tablets were examined for estimating BF content present in them. The medicinal samples containing BF were Zabesta (USV Ltd., Baddi, Solan), Biselect (Ipca Lab Ltd., Mumbai) and Concor (Merck Ltd., Waluj, Aurangabad). Solutions obtained by dissolving BF tablets were filtered with Whatman filter paper of 42 micron and subsequently diluted so that BF concentration falls in the calibration range. Square wave voltammograms were then recorded under exactly identical conditions that were employed while recording square wave voltammograms for plotting calibration plot. The values of experimentally determined BF and reported BF amounts in various tablets are tabulated in Table 1. It was found that BF concentration determined for various tablets using this method are in good agreement with the reported values.
3.6. Quantification in Real Samples
To establish the utility of the developed protocol, BF was determined in human urine samples obtained after the usual therapeutic dose of BF has been administered. The samples were obtained from patients after 10 h of administration of Zabesta tablet. Prior to analysis, the urine samples were diluted two times with phosphate buffer solution. A typical square wave voltammogram of sample 1 at bare EPPGE is shown in Figure 5. A well-defined peak of BF was noticed at Ep ~792 mV. The urine sample of the patient was then spiked with a known concentration of BF. The voltammogram in Figure 4 clearly depicts that the peak current increases significantly for the peak at Ep ~792 mV. The concentration of BF was determined using the regression equation. Using the proposed method described above, the results obtained for different urine samples, before and after spiking, are tabulated in Table 2.
4. Conclusions
The electroanalytical method described here employed EPPGE/BPPGE as working electrode for determination of BF. A well-defined oxidation peak was observed at ~954 mV and ~792 mV potential at BPPGE and EPPGE respectively in phosphate buffer medium of pH 7.2. Peak current at EPPGE was always higher than that observed at BPPGE. EPPGE also showed linear calibration region which is wider than that for BPPGE. A slightly smaller surface area of EPPGE in comparison to BPPGE shows that higher current in case of EPPGE is not due to larger surface area and points towards the superior nature of EPPGE for electro-analytical purpose. Pharmaceutical excipients do not interfere with determination of BF in this method. Hence, the method eliminates the need for derivitization prior to analysis. The square-wave voltammetric method can be effectively used for the determination of BF at EPPGE which is better than BPPGE for this purpose. The method developed also showed good ability to quantify drug contents in tablets with reliable accuracy and the practical utility of the present method was successfully examined by analyzing urine samples obtained from patients being treated with BF. A comparison of common quantification parameters of bisoprolol at bare BPPGE and EPPGE in the present method with single wall carbon nanotube modified glassy carbon electrode using differential pulse voltammetry [13] is presented in Table 3 and clearly indicates that BPPGE sensor and modified glassy carbon exhibit almost similar detection limits, however, the peak is more sharp and well-defined in the case of bare EPPGE.
Thus, it is concluded that surface modification of glassy carbon by carbon nanotubes exhibits similar electrocatalytic property as that exhibited by bare BPPGE. Hence, it is suggested that in place of carbon nanotube modified glassy carbon, bare EPPGE can be easily used to achieve better sensitivity and detection limit for the determination of bisoprolol and therefore, surface modification procedure of glassy carbon is not necessary.

Table 1. Determination of BF in pharmaceutical formulations using bare EPPGE.
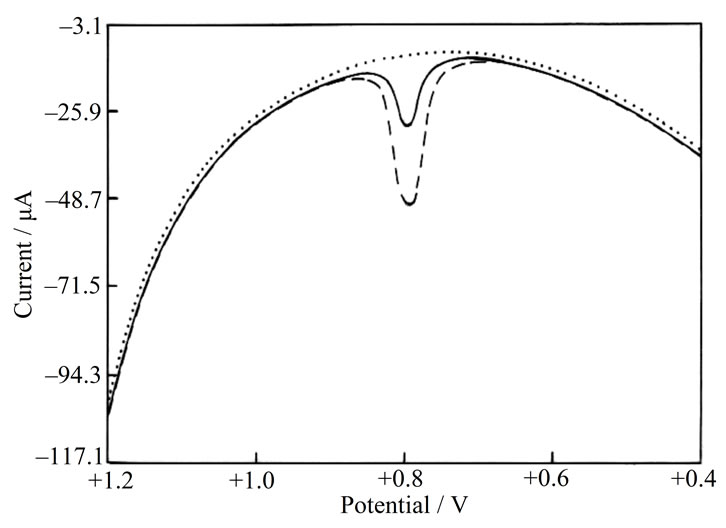
Figure 5. A comparison of voltammograms observed for urine sample of patient being treated with BF ( — ) and the patient sample spiked with BF ( - - - - ) at pH 7.2 at EPPGE. Background is represented as ( ∙∙∙∙∙∙ ).
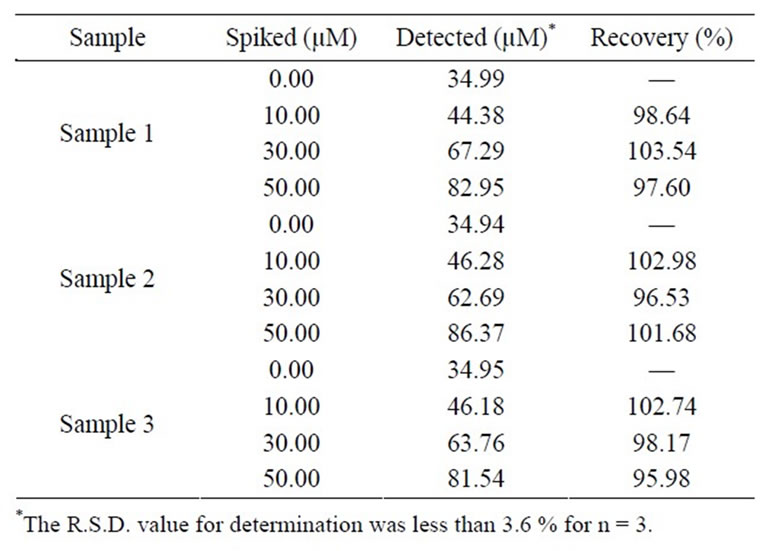
Table 2. Concentration of BF in human urine determined after 10 h of BF administration at bare EPPGE at pH 7.2.

Table 3. A comparison of common quantification parameters for bisoprolol at nanotube modified glassy carbon electrode and pyrolytic graphite electrode at pH 7.2.
5. Acknowledgements
Authors (HC and SC) are thankful to the Council of Scientific and Industrial Research, New Delhi for the award of Junior Research Fellowship and Senior Research Fellowship respectively.
REFERENCES
- P. Groote, P. V. Ennezat and F. Mouquet, “Bisoprolol in the Treatment of Chronic Heart Failure,” Vascular Health and Risk Management, Vol. 3, No. 4, 2007, pp. 431-439.
- http://www.drugwatch.com/bisoprolol/
- P. Dubach, J. Myers, P. Bonetti, T. Schertler, V. Froelicher, D. Wagner, M. Scheidegger, M. Stuber, R. Luchinger, J. Schwitter and O. Hess, “Effects of Bisoprolol Fumarate on Left Ventricular Size, Function, and Exercise Capacity in Patients with Heart Failure: Analysis with Magnetic Resonance Myocardial Tagging,” American Heart Journal, Vol. 143, No. 4, 2002, pp. 676-683. doi:10.1067/mhj.2002.121269
- http://www.wada-ama.org/en/World-Anti-Doping-Program/Sports-and-Anti-Doping-Organizations/International-Standards/Prohibited-List/
- L. Ding, X. Zhou, X. Guo, Q. Song, J. He and G. Xu, “LC-ESI-MS Method for the Determination of Bisoprolol in Human Plasma,” Journal of Pharmaceutical and Biomedical Analysis, Vol. 44, No. 2, 2007, pp. 520-525. doi:10.1016/j.jpba.2007.03.001
- M. F. Tutunji, H. M. Ibrahim, M. H. Khabbas and L. F. Tutunji, “Simultaneous Determination of Bisoprolol and Hydrochlorothiazide in Human Plasma by HPLC Coupled with Tandem Mass Spectrometry,” Journal of Chromatography B, Analytical Technologies in the Biomedical and Life Sciences, Vol. 877, No. 16-17, 2009, pp. 1689- 1697. doi:10.1016/j.jchromb.2009.04.021
- S. J. Joshi, P. A. Karbhari, S. I. Bhoir, K. S. Bindu and C. Das, “RP-HPLC Method for Simultaneous Estimation of Bisoprolol Fumarate and Hydrochlorothiazide in Tablet Formulation,” Journal of Pharmaceutical and Biomedical Analysis, Vol. 52, No. 3, 2010, pp. 362-371. doi:10.1016/j.jpba.2009.10.021
- J. Wang, X. Zhang, F. Pi, X. Wang and N. Yang, “Tris(2,2′-bipyridyl) Ruthenium(II)-bisoprolol-based Electrochemiluminescence Coupled with Capillary Zone Electrophoresis,” Electrochimica Acta, Vol. 54, No. 8, 2009, pp. 2379-2384. doi:10.1016/j.electacta.2008.10.066
- M. Baecker, S. Beging, M. Biselli, A. Poghossian, J. Wang, W. Zang, P. Wagner and M. J. Schoening, “Concept for a Solid-State Multi-Parameter Sensor System for Cell-Culture Monitoring,” Electrochimica Acta, Vol. 54, No. 25, 2009, pp. 6107-6112. doi:10.1016/j.electacta.2009.02.091
- R. N. Goyal, M. Oyama and S. P. Singh, “Fast Determination of Salbutamol, Abused by Athletes for Doping, in Pharmaceuticals and Human Biological Fluids by Square Wave Voltammetry,” Journal of Electroanalytical Chemistry, Vol. 611, No. 1-2, 2007, pp. 140-148. doi:10.1016/j.jelechem.2007.08.014
- R. N. Goyal, M. Oyama and S. P. Singh, “Simultaneous Determination of Adenosine and Adenosine-5′-triphosphate at Nanogold Modified Indium Tin Oxide Electrode by Osteryoung Square-Wave Voltammetry,” Electroanalysis, Vol. 19, No. 5, 2007, pp. 575-581. doi:10.1002/elan.200603766
- J. Wu, K. Y. Chumbimuni-Torres, M. Galik, C. Thammakhet, D. A. Haake and J. Wang, “Potentiometric Detection of DNA Hybridization Using Enzyme-Induced Metallization and a Silver Ion Selective Electrode,” Analytical Chemistry, Vol. 81, No. 24, 2009, pp. 10007- 10012. doi:10.1021/ac9018507
- R. N. Goyal, A. Tyagi, N. Bachheti and S. Bishnoi, “Voltammetric Determination of Bisoprolol Fumarate in Pharmaceutical Formulations and Urine Using SingleWall Carbon Nanotubes Modified Glassy Carbon Electrode,” Electrochimica Acta, Vol. 53, No. 6, 2008, pp. 2802-2808. doi:10.1016/j.electacta.2007.10.057
- C. E. Banks, A. Crossley, C. Salter, S. J. Wilkins and R. G. Compton, “Carbon Nanotubes Contain Metal Impurities Which Are Responsible for the ‘Electrocatalysis’ Seen at Some Nanotube-Modified Electrodes,” Angewandte Chemie International Edition, Vol. 45, No. 16, 2006, pp. 2533-2537. doi:10.1002/anie.200600033
- R. N. Goyal and S. P. Singh, “Simultaneous Voltammetric Determination of Dopamine and Adenosine Using a Single Walled Carbon Nanotube—Modified Glassy Carbon Electrode,” Carbon, Vol. 46, No. 12, 2008, pp. 1556- 1562. doi:10.1016/j.carbon.2008.06.051
- G. D. Christian and W. C. Purdy, “The Residual Current in Orthophosphate Medium,” Journal of Electroanaytical Chemistry, Vol. 3, No. 6, 1962, pp. 363-367. doi:10.1016/0022-0728(62)80012-6
- R. N. Goyal, S. Chatterjee and B. Agrawal, “Electrochemical Investigations of Diclofenac at Edge Plane Pyrolytic Graphite Electrode and Its Determination in Human Urine,” Sensors and Actuators B: Chemical, Vol. 145, No. 2, 2010, pp.743-748. doi:10.1016/j.snb.2010.01.038
- A. J. Bard and L. R. Faulkner, “Fundamentals and Applications,” Electrochemical Methods, Wiley, New York, 1980, p. 525.
- R. H. Wopshall and I. Shain, “Effects of Adsorption of Electroactive Species in Stationary Electrode Polarography,” Analytical Chemistry, Vol. 39, 1967, pp. 1514-1527. doi:10.1021/ac50156a018
- R. N. Goyal and A. Sangal, “Electrochemical Investigations of Adenosine at Solid Electrodes,” Journal of Electroanalytical Chemistry, Vol. 521, No. 1-2, 2002, pp. 72- 80. doi:10.1016/S0022-0728(02)00645-9
- A. Radi, M. A. EL Ries and G. E. Bekhiet, “Electrochemical Oxidation of the Hypoglycaemic Drug Gliclazide,” Analytical Letters, Vol. 32, No. 8, 1999, pp. 1603-1612. doi:10.1080/00032719908542919
- M. R. C. Massaroppi, S. A. S. Machado and L. A. Avaca, “Electroanalytical Determination of the Herbicide Picloram in Natural Waters by Square Wave Voltammetry,” Journal of Brazilian Chemical Society, Vol. 14, No. 1, 2003, pp. 113-119. doi:10.1590/S0103-50532003000100018
- S. Komorsky-Lovric, S. Gagic and R. Penovski, “Voltammetric Determination of Benzoylecgonine,” Analytica Chimica Acta, Vol. 389, No. 1, 1999, pp. 219-223. doi:10.1016/S0003-2670(99)00091-4
NOTES
*Corresponding author.