Open Journal of Statistics
Vol.1 No.3(2011), Article ID:8067,6 pages DOI:10.4236/ojs.2011.13018
Revisit the Two Sample t-Test with a Known Ratio of Variances
Department of Mathematics and Statistics, York University, Toronto, Canada
E-mail: august@yorku.ca
Received August 1, 2011; revised September 4, 2011; accepted September 12, 2011
Keywords: Behrens-Fisher Problem, Canonical Parameter, Exponential Family Model, Likelihood Based Inference, Modified Signed Log-Likelihood Ratio Statistic, Satterthwaite Method
Abstract
Inference for the difference of two independent normal means has been widely studied in staitstical literature. In this paper, we consider the case that the variances are unknown but with a known relationship between them. This situation arises frequently in practice, for example, when two instruments report averaged responses of the same object based on a different number of replicates, the ratio of the variances of the response is then known, and is the ratio of the number of replicates going into each response. A likelihood based method is proposed. Simulation results show that the proposed method is very accurate even when the sample sizes are small. Moreover, the proposed method can be extended to the case that the ratio of the variances is unknown.
1. Introduction
Inference for the difference of two independent normal means is omnipresent in statistical practice and is introduced in most introductory staitstics texts. Typically, the variances are assumed to be unknown and must be estimated. When we assume equal variances, then a pooled estimate of the common variance is used and the test statistic is exactly distributed as a t-distribution. However, without making the equality of variances assumption, the problem is then the well-known Behrens-Fisher problem, where no exact distribution of the test statistic is available. Although there exists many approximate solutions for this problem, most statistical software packages use the Satterthwaite solution, where the test statistic is approximately distributed as a t-distribution. Maity & Sherman [1] considered the Behrens-Fisher problem with an additional assumption that one of the variances is known, and a Satterthwaite type solution is obtained. Wong & Wu [2] examined the problem considered by Maity & Sherman [1] and derived a likelihood based asymptotic solution, which has excellent coverage property.
Schechtman & Sherman [3] also considered the Behrens-Fisher problem but with an assumption that the ratio of the two variances is known. This problem arises in many practical situations. For example, when two instruments report averaged responses of the same object based on a different number of replicates, the ratio of the variances of the response is then known, and is the ratio of the number of replicates going into each response. Schechtman & Sherman [3] showed that their proposed solution is equivalent to the one suggested by Sprott & Farewell [4].
In this paper, we followed the approach by Wong & Wu [2] and obtained a likelihood based asymptotic solution for the problem considered in Schechtman & Sherman [3]. The underlying theories of the proposed method are discussed in Wong & Wu [2]. Simulation results showed that the proposed solution has excellent coverage property even for small sample sizes. The proposed method is then applied to the Behrens-Fisher problem. Again, simulation results showed the excellent coverage property of the proposed method.
The structure of the paper is as follows. Likelihood based inference for a scalar canonical parameter of the exponential family model is presented in a step-by-step algorithm in Section 2. The proposed method is applied to obtain inference for the difference of two independent normal means with known ratio of variances in Section 3. Simulation results are also recorded in Section 3 to illustrate the coverage properties of the proposed method. The proposed method is then applied to the BehrensFisher problem in Section 4. Simulation results recorded in Section 4 showed that the proposed method and the Satterthwaite method have similar coverage properties. Some concluding remarks are given in Section 5.
2. An Algorithm to Obtain Confidence Interval for a Scalar Parameter of Interest
Let  be a sample from an exponential family model with density

where  is the canonical parameter, and
  is a minimal sufficient statistic. Also let
  where
where  is the scalar parameter of interest and
  is the vector nuisance parameter. Two widely used methods for inference concerning
  are based on the Wald statstic and the signed log-likelihood ratio statistic. It is well-known that
 , the maximum likelihood estimate of
 , is asymptotically distributed as a normal distribution with mean
  and that the asymptotic variance can be estimated by the inverse of either the expected Fisher information matrix or the observed information matrix evaluated at
 . Hence a
  confidence interval for
  based on the Wald statistic is

where  is the
  percentile of
 ,
,  , and
, and  is the estimated asymptotic variance of
 , which can be derived from the asymptotic variance of
  using the Delta method. Alternatively, the signed log-likelihood ratio statistic

is also asymptotically distributed as  with
with  being the constrained maximum likelihood estimate of
  for a given
 . Therefore a
  confidence interval for
  based on the signed log-likelihood ratio statistic is
In this paper, we consider the method discussed in Wong & Wu [2], which can be summarized into the following algorithm:
Given:
a) A sample  from an exponential family model.
b) Log-likelihood function of the model is 
 where
where  is an additive constant that does not depend on
 , and
, and  is the canonical parameter.
Aim: Inference for .
.
Step 1:
a) Obtain the overall maximum likelihood estimate  by solving
 .
.
b) Obtain , the determinant of the observed information matrix evaluated at
 , where
 .
.
c) Obtain the constrained maximum likelihood estimate  at a fixed
  by solving
 .
.
d) Obtain , the determinant of the observed nuisance information matrix evaluated at
 , where
 .
.
Step 2: Calculate the signed log-likelihood ratio statistic

Under regularity conditions as given in DiCiccio et al [5],  is asymptotically distributed as
  with order of convergence
 . Hence a
  confidence interval of
  is
is , where
  is the
  percentile of
 .
.
Step 3: With the canonical parameter , calculate
a) 
b) 
c)  first row of
Step 4: Parameter of interest and its variance in  space are
a)  calculated in
  space is
 where
where .
.
b)  where
where
 and
and .
.
Step 5. The standardized maximum likelihood departure in  space is

Step 6: The modified signed log-likelihood ratio statistic is
which is shown in Barndorff-Nielsen [6,7] and Wong & Wu [2] to be distributed as  with order of convergence
 . Hence a
  confidence interval of
  is
is .
.
3. Inference for the Difference of Two Independent Normal Means with a Known Ratio of Variances
3.1. Proposed Likelihood Based Inference
Let  and
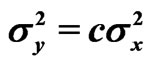
and  be samples from two independent normal distributions with mean and variance
  and
and  respectively. Assume
  and
and  are unknown parameters but
  is known. Schechtman & Sherman [3] showed that a
  confidence interval for
  can be obtained by
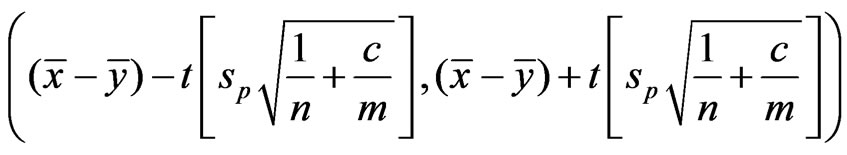
where ,
,  ,
,  ,
,  ,
,  , and
, and  is the
  percentile of the t-distribution with
  degrees of freedom.
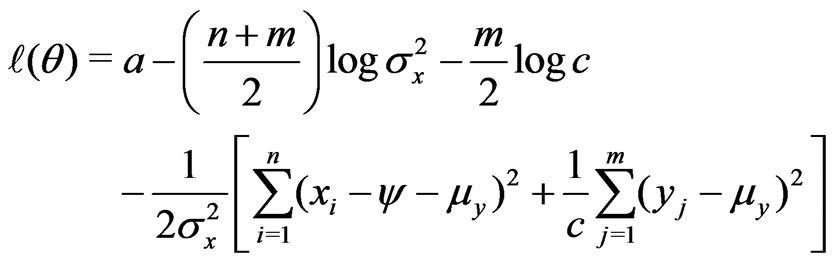
The log-likelihood function can be written as
 (1)
(1)
where . Following the algorithm given in Section 2, we have:
Step 1:
a)  where
where ,
,  , and
, and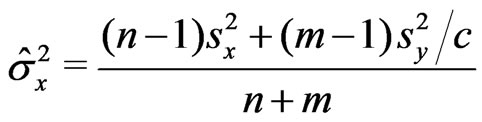 .
.
b) 
c) 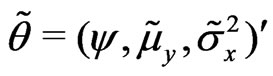 where
where  and
and
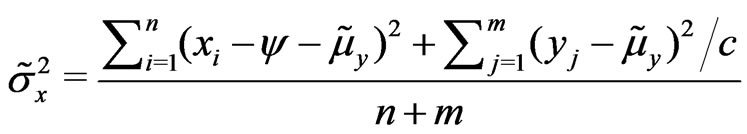 .
.
d)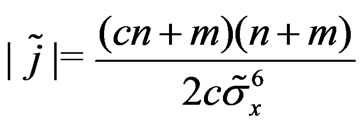 .
.
Step 2:  can be obtained.
Step 3: For this problem, the canonical parameter is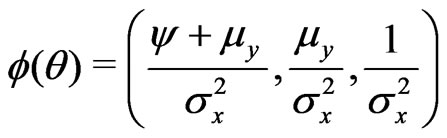 . Hence, we have a)
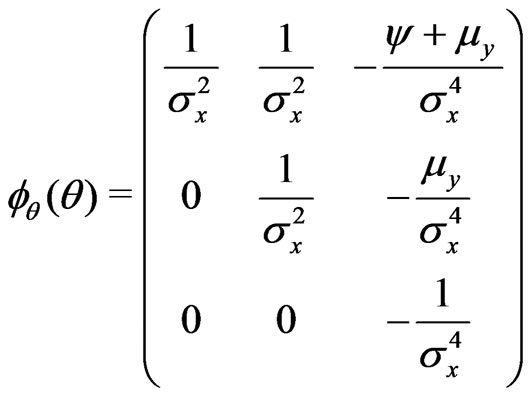 .
.
b)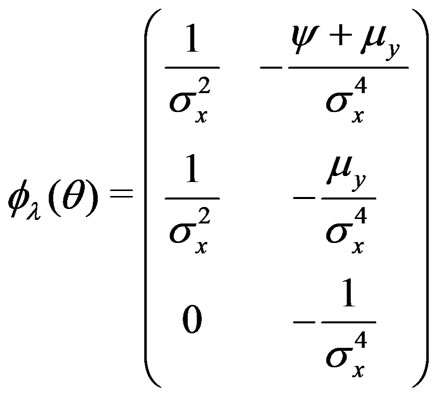 .
.
c)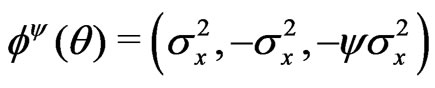 .
.
The rest of the steps can be obtained from the above information. Hence  confidence interval can be obtained from the modified signed log likelihood ratio statistic.
3.2. Simulation Study
To compare the accuracy of the proposed method with the signed log likelihood ratio method, and the Schechtman & Sherman [3] method, Monte Carlo simulation studies were conducted. We generated 10,000 simulated samples for some combinations of the parameters. For each simulated sample, we calculate the 95% confidence intervals for  obtained by the proposed method (
 ) with the signed log-likelihood ratio method (
 ), and the Schechtman & Sherman [3] method (
 ). For each simulated setting, we report the proportion of
  that falls outside the lower bound of the confidence interval (lower error), the proportion of
  that falls outside the upper bound of the confidence interval (upper error), and the proportion of
  that falls within the confidence interval (central coverage). The nominal values for the central coverage, and the lower and upper errors are 0.95, 0.025, and 0.025 respectively. The simulation standard errors for these three quantities are 0.0022, 0.0016 and 0.0016 respectively. Results are recorded in Tables 1-3. It is clear that the results from signed log-likelihood method are not satisfactory especially when the sample sizes are small. Results from the Schechtman & Sherman [3] method and the proposed method are almost indistinguishable even for small sample sizes (they are all within 3 simulated standard errors). The major difference between the two methods is that Schechtman & Sherman [3] method is tailor-made for this problem and cannot be applied when
  is unknown; whereas the proposed method can be applied to the
  is unknown case.
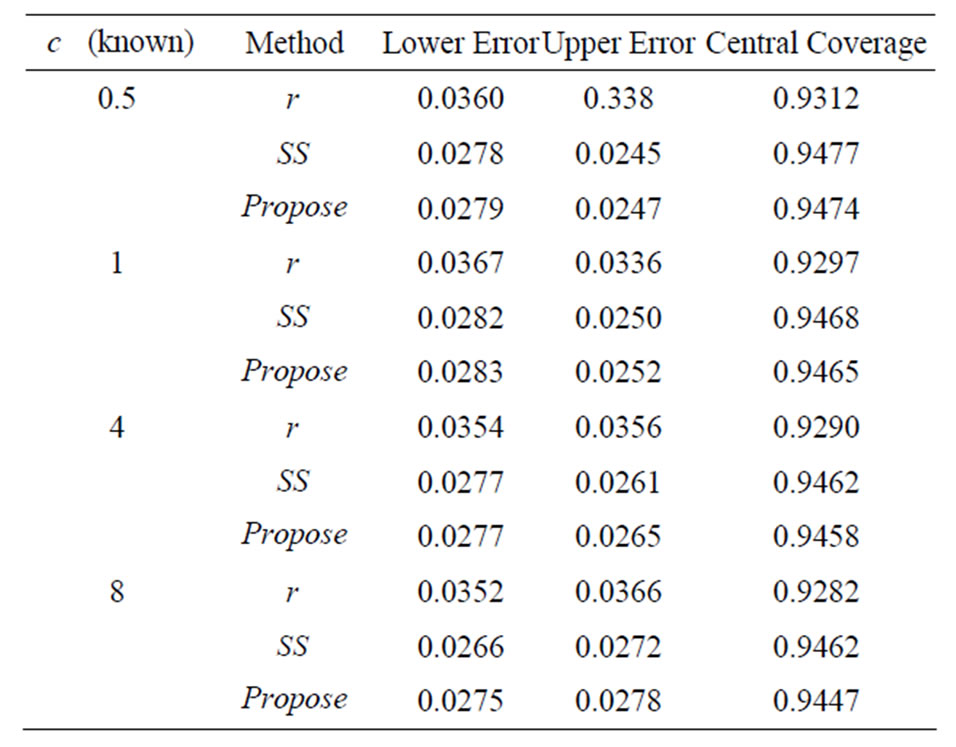
Table 1. ,
,  ,
,  ,
,  ,
, 
 and
and .
.

Table 2. ,
,  ,
,  ,
,  ,
, 
 and
and .
.
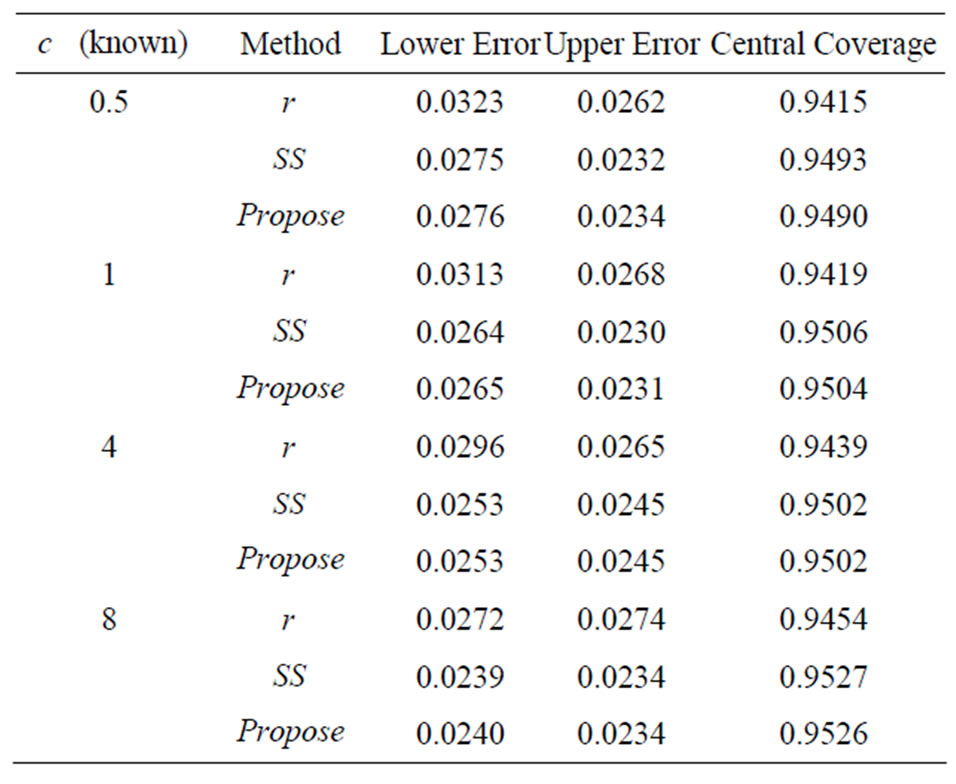
Table 3. ,
,  ,
,  ,
,  ,
, 
 and
and .
.
4. Inference for the Difference of Two Independent Normal Means with an Unknown Ratio of Variances
4.1. Proposed Likelihood Based Inference
In this section, we consider the same model set up as in Section 3, but the ratio of variances is unknown. This is the Behrens-Fisher problem, and no exact distribution of the test statistic is available. The most common approximate solution is the Satterthwaite solution, which is discussed in most of the introductory statistics texts, and it is implemented in most statistical software packages.
For this problem, the log likelihood function can be written as
 (2)
(2)
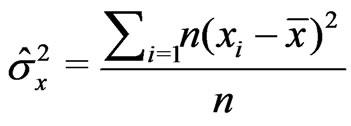
where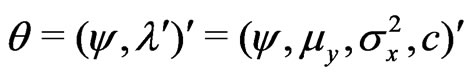 . Again, following the algorithm given in Section 2, we have Step 1:
a) 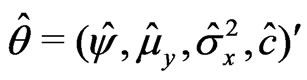 where
where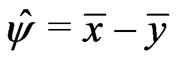 ,
,  ,
,  , and
, and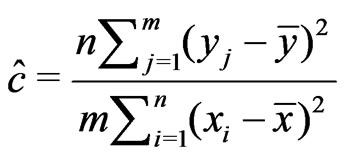 .
.
b) 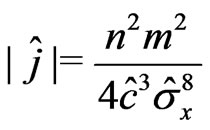
c) The constrained maximum likelihood estimate of  for a given
 ,
,  does not have a closed form. However, it can be obtained by the following iterative procedure:
i) Set 
ii) Then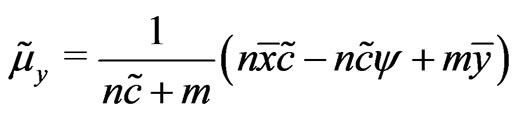 , and
, and
iii) 
iv) Update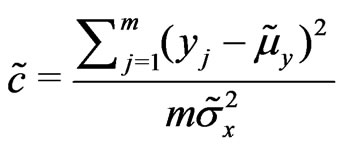 .
.
v) Go to ii). Will stop when the absolute value of the difference of two consecutive  is less than some pre-set tolerance level.
d) Since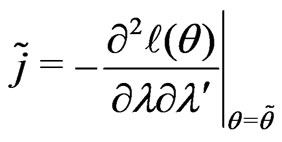 ,
,  can be obtained.
Step 2:  can be obtained.
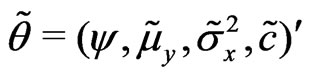
Step 3: For this problem, the canonical parameter is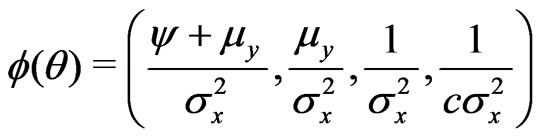 . Hence, we have
a)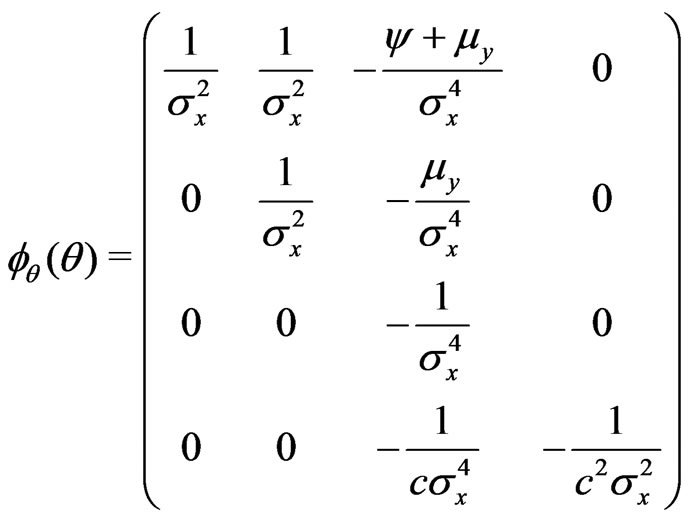 .
.
b)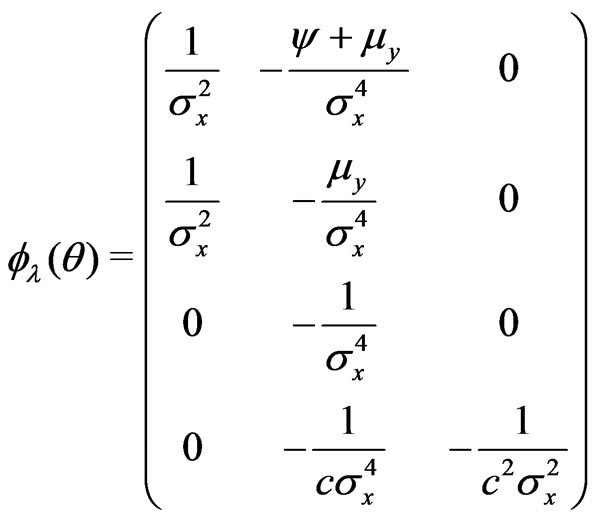 .
.
c)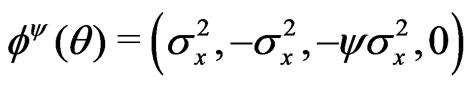 .
.
The rest of the steps can be obtained from the above information. Hence  confidence interval can be obtained from the modified signed log-likelihood ratio statistic.
4.2. Simulation
Monte Carlo simulation studies, with setting being the same as those considered in Section 3, were conducted to compare the coverage properties of the proposed method ( ) with the signed log-likelihood ratio method (
 ). Results are recorded in Tables 4-6 and they are similar to what we have observed in Section 3: the signed log-likelihood method does not have good coverage properties, whereas the proposed method have coverages very closed to the nominal levels.
5. Discussion
A likelihood based method to obtain inference for the
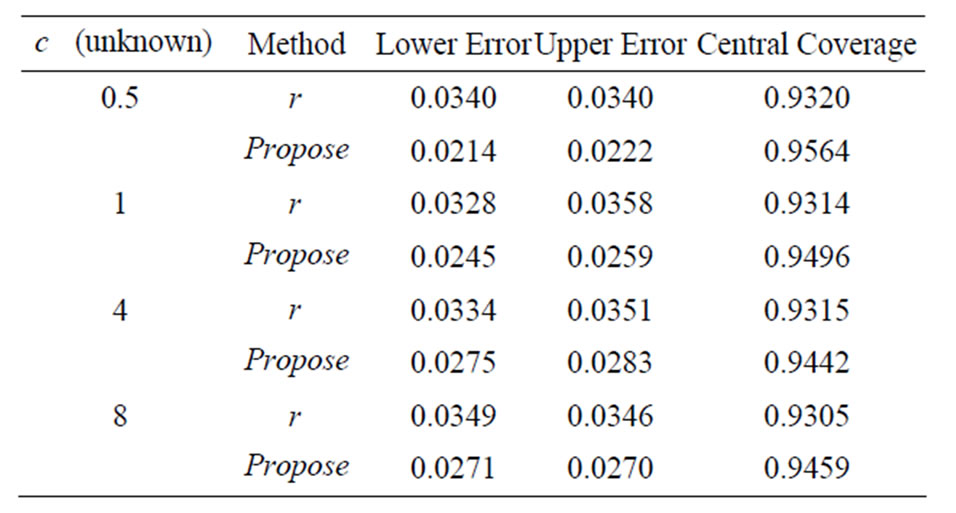
Table 4. ,
,  ,
,  ,
,  ,
, 
 and
and .
.
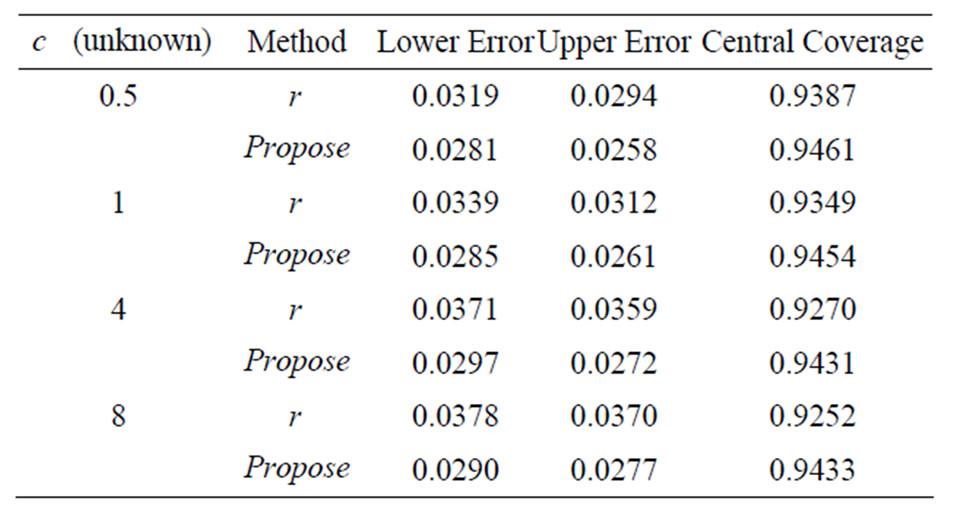
Table 5. ,
,  ,
,  ,
,  ,
, 
 ,
, .
.
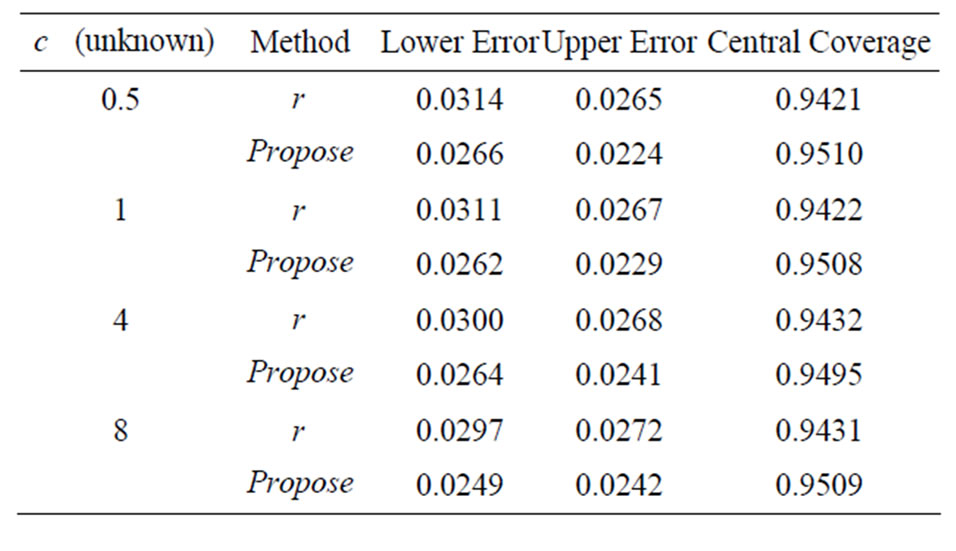
Table 6. ,
,  ,
,  ,
,  ,
, 
 and
and .
.
difference of two independent normal means with known ratio of variances is proposed. Monte Carlo simulation results showed that the proposed method and the Schechtman & Sherman [3] method are almost indistinguishable. However, Schechtman & Sherman [3] method is tailored made for this particular problem and cannot be applied to the case where the ratio of variances is unknown. On the other hand, the proposed method can still be applied to the unknown ratio of variance case. Simulation studies for other combinations of the parameters have also been conducted and results are consistent with those reported in this paper. A simple  program to perform the calculations is available upon request. As a final note, the theoretical accuracy of the modified signed log-likelihood method is shown in BarndorffNielsen [5,6] and Wong & Wu [2].
6. References
[1] A. Maity and M. Sherman, “The Two Sample t-Test with One Variance Unknown,” The American Statistician, Vol. 60, No. 2, 2006, pp. 163-166. doi:10.1198/000313006X108567
[2] A. Wong and Y. Wu, “Likelihood Analysis for the Difference in Means of Two Independent Normal Distributions with One Variance Unknown,” Journal of Statistical Research, Vol. 42, 2008, pp. 17-35.
[3] E. Schechtman and M. Sherman, “The Two-sample t-Test with a Known Ratio of Variances,” Statistical Methodology, Vol. 4, No. 4, 2007, pp. 508-514. doi:10.1016/j.stamet.2007.03.001
[4] D. A. Sprott and V. T. Farewell, “The Difference between Two Normal Means,” The American Statistician, Vol. 47, No. 2, 1993, pp. 126-128. doi:10.2307/2685194
[5] O. E. Barndorff-Nielsen, “Inference on Full and Partial Parameters, Based on the Standardized Signed Log-likelihood Ratio,” Biometrika, Vol. 73, 1986, pp. 307-322.
[6] O. E. Barndorff-Nielsen, “Modified Signed Log-likelihood Ratio,” Biometrika, Vol. 78, No. 3, 1991, pp. 557- 563. doi:10.1093/biomet/78.3.557
[7] T. DiCiccio, C. Field and D. A. S. Fraser, “Approximation of Marginal Tail Probabilities and Inference for Scalar Parameters,” Biometrika, Vol. 77, 1990, pp. 77-95. doi:10.1093/biomet/77.1.77