R. K. STANDISH
that of the vertebrates. A typical suburban house garden will
contain city-scale populations of ants. A nave application of
anthropic reasoning would conclude that ants could not be con-
scious, as otherwise we would expect to be an ant rather than a
human.
Unfortunately this usage of anthropic reasoning raises the
Chinese paradox. Why wasn’t I born in the most populous na-
tion on Earth, China, which has 50 times the population of my
country of birth, Australia?
Furthermore, ants are not a single species, but are taxonomi-
cally speaking a family, with which we are comparing a single
species homo sapiens. It would be better to rephrase the ques-
tion in a way that didn’t depend on a somewhat human-biased
taxonomic scheme.
In the rest of this paper I show that the Chinese paradox is
actually not a problem for anthropic reasoning, and in so doing
demonstrate a previously unknown process for generating
power law distributions. Then by recasting the ant conscious-
ness problem into a question of expected body mass, which is
an objective physical measurement rather than a possibly sub-
jective classification, and including the proper handling of the
Chinese paradox, we can conclude that the vast majority of
animal species (particularly the small ones) are unlikely to be
conscious (or in the reference class, if you prefer) by anthropic
reasoning.
Chinese Paradox
China has well over a billion people, and along with India,
has by far the biggest population of all the nations in the world.
I happen to live in Australia, for instance, a country with
around 1/50th the population of China. It would be absurd to
conclude that Chinese people are unconscious, so namely one
would expect on anthropic grounds to be Chinese or Indian. At
first sight this looks disastrous for anthropic reasoning, until
you realize that it is ill-posed. Suppose you asked the question
of what is the chance of being Chinese versus not being Chi-
nese. There is about a 20% chance of being Chinese, and 80%
not, so it then becomes unsurprising to not be Chinese.
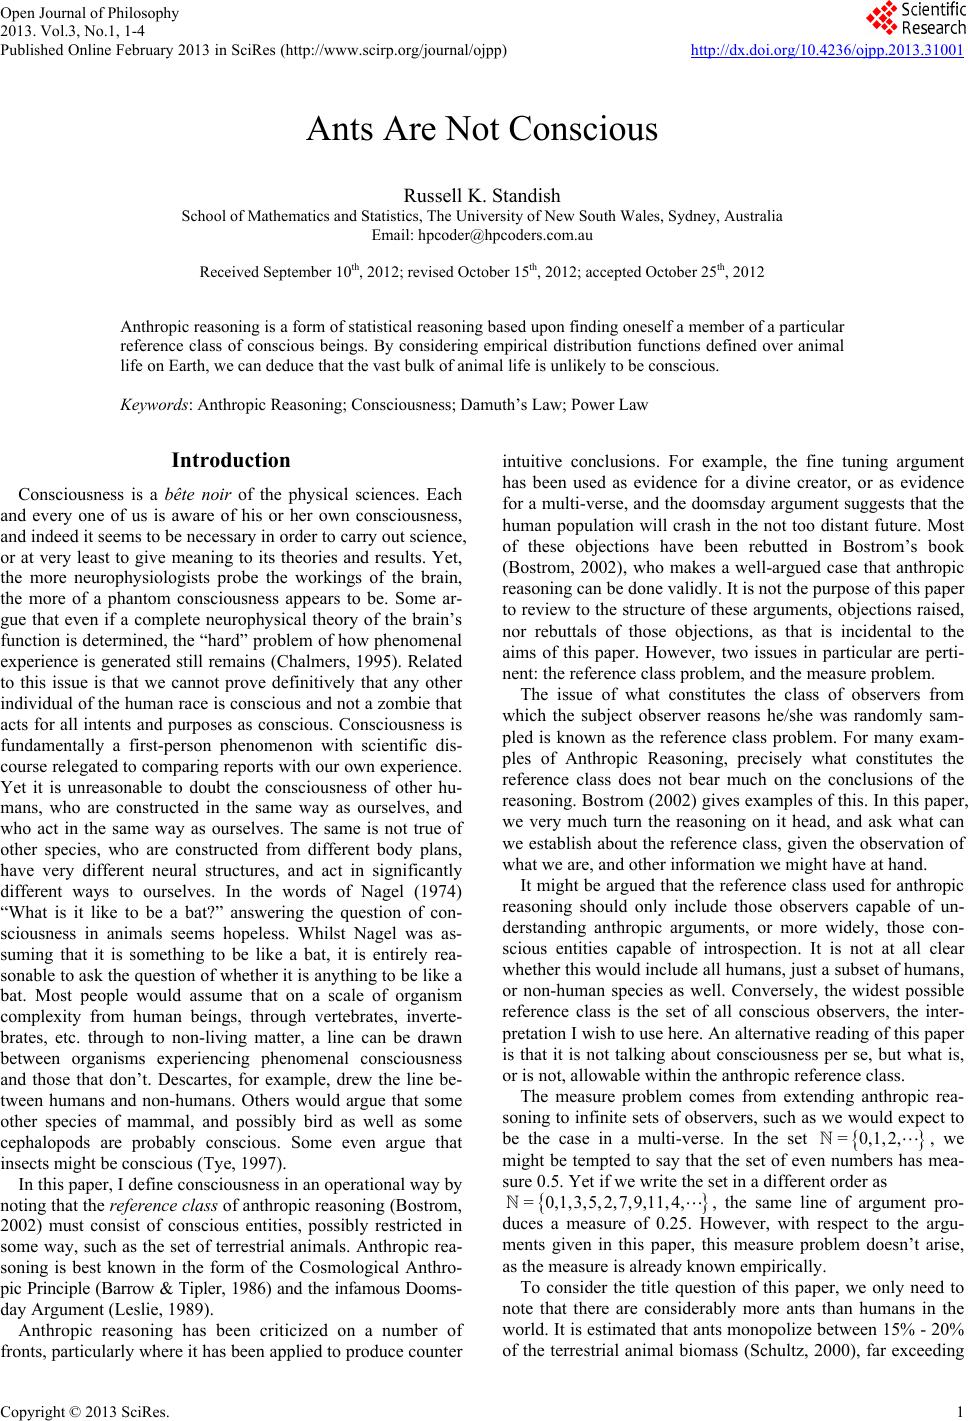
We can rephrase the Chinese question in a different way:
What is the expected population size of one’s country of birth?
It turns out (see Figure 1) that there are far more countries with
fewer people, than countries with more people. The relationship
between population size and the number of countries looks
roughly proportional to 1/x, where x is the population of the
country. This law is an example of a power law, and it appears
in all sorts of circumstances, for example the frequency with
which words are used in the English language.
With a 1/x power law, the number of countries of a given
population size exactly offsets the population of those countries,
so anthropically speaking, we should expect to find ourselves in
just about any sized country, with the same probability. Being
in a country with a population the size of Australia’s would be
no more surprising than being in a more populated country such
as the US or China.
However, the actual distribution of country populations turns
out to be a log normal distribution1, whose probability dis-
tribution is
22
=expln 2px Cxx
(1)
The parameters
and
can be found by means of the
maximum likelihood method outlined by Clauset et al. (2009).
In fact one can compare the likelihood of the lognormal dis-
tribution explaining the population data with the likelihood that
the 1/x power law explains it, and it turns out to be of the order
of 1011 times as likely. Similar results hold for other population
datasets in the range 1965-2005. So indeed it would be more
likely for one to find oneself in a middle ranked country like
Kuwait or Estonia, than in the most populous nations of India
or China. However, the effect is not marked. India and China
together have about 2.4 billion people, and the total number of
people living in countries with populations in the range 10 -
100 million is about 2.1 billion, and in the range 100 million to
a billion is about 1.5 billion.
Given the ubiquity of power laws, and the fact that a 1/x
power law exactly neuters any observer selection effect as in
the above case, might a 1/x power law be a signature of an
arbitrary, or random classification?
Mass Distribution of Animal Species
OK, well let’s get back to our ants, and ask the question of
what is the expected abundance of our species, assuming we are
randomly sampled from all conscious species on the Earth. The
distribution of species populations tends to follow a power law,
with a typical rank-abundance plot within a species size class
following a power law m
r with exponent m = −1.9 (Sie-
mann et al. 1999), where A is the abundance of the the rth most
abundant species. Rank-abundance plots are related to cumu-
lative size distributions (Newman, 2005):
=
A
rANpxx
d
(2)
where N is the total number of species in a size class, and
px the distribution of species abundances. Solving (2) im-
plies
pA is also a power law, with exponent −1.52. By the
argument in the previous section, we would therefore expect to
find ourselves to be one of the many species with few indi-
viduals, if all animals were conscious, as the distribution of
abundances falls off faster than 1/A. Yet our species abundance
is many orders higher (6 × 10⁹) than the minimum abundance
for viability (approx 103). However, for the most part of our
species’ existence on the Earth, our abundance was much less,
and perhaps integrated over time, our total abundance is not so
different from that of other species of our size class.
However, let us ask a different question: “what is our ex-
pected body mass if we are randomly sampled from the re-
ference class of conscious beings?” For this we need the abun-
dance distribution
Pm as a function of body mass.
There is a well known biological law (called Damuth’s law)
(Damuth, 1991) that states the population density of a species is
inversely proportional to the 3/4ths power of that species’ body
mass, i.e. 34
Am
. To turn this result into the mass distribu-
tion of individuals
Pm, we need to multiply this law by the
mass distribution of species
Sm. Informally, we note that
there are many more smaller bodied species of animals than
larger ones; there are many more types of insect than of ma-
mmals, for example. The exact form of the distribution function
Sm is still a matter of conjecture. Some theoretical models
suggest that
Sm is peaked at intermediate body sizes (Hut-
chinson & MacArthur, 1959), and experimental results appear
to confirm this (Siemann et al. 1999), although it must be ad-
mitted that the latter study was confined to insects, and ignored
1Thank you to Aaron Clauset for pointing this out.
Copyright © 2013 SciRes.
2