Paper Menu >>
Journal Menu >>
 Wireless Sensor Network, 2010, 2, 703-709 doi:10.4236/wsn.2010.29085 Published Online September 2010 (http://www.SciRP.org/journal/wsn) Copyright © 2010 SciRes. WSN Design of Building Monitoring Systems Based on Wireless Sensor Networks* Qifen Dong, Li Yu, Huanjia Lu, Zhen Hong, Yourong Chen College of Information Engineerin g, Zhejiang University of Technology, Hangzhou, Zhejiang, Ch ina E-mail: dongqifen0419@163.com, lyu@zjut.edu.cn, {hongzhen614, luhuanjia1020}@126.com, jack_chenry@163.com Received June 9, 2010; revised July 11, 2010; accepted August 19, 2010 Abstract Wireless Sensor Network provides a potential technique for monitoring the indoor environment. This paper presents a Building Monitoring system based on Wireless Sensor Networks. A clustering-based network specified for building monitoring is proposed, which is inspired by LEACH (Low Energy Adaptive Cluster Hierarchy) method. Further, two key ideas are used to implement the clustering-based network. First, the configuration module of building management software is used to conduct all nodes in a room forming a local cluster. This cluster formation method does not consume node energy. Second, because cluster-heads cannot directly transmit packets to th e sin k node du e to limited wireless co mmunication range, the clu st er - h e a d communications are represented by a multi-hop tree rooted at the sink node. The experiment has been made to demonstrate the feasibility of the proposed results. Keywords: Wireless Sensor Networks, Building Monitoring, LEACH, Cluster 1. Introduction According to the 2007 UN Environment Program [1], about 40 percent of total energy is used for heating, cooling, lightin g and ventilation of buildings. Subs tantial savings can be made by applying these functions only when and where they are needed. Such control is only possible when indoor conditions such as temperature, relative humidity or light are measured. Wired sensors could certainly be installed at sensing locations, but such a step requires significant effort and an additional set of wires throughout a building. Estimates of the cost to de- ploy wires ranged from $2.2 per meter for new buildings to $7.19 per meter for existing constructions in 2002 [2]. In addition, running wires in existing constructions in- duces other problems, such as destroying appearance of buildings. Transmitting sensing data wirelessly provides a significant benefit for monitoring indoor environment. However, traditional wireless systems suffer from their own disadvantages, such as high running cost, and high energy consumption of monitoring devices. Wireless Sensor Network (WSN) [3] which co nsists of dense sensor nodes that continuously observe physical phenomenon provides an opportunity for building moni- toring [4,5]. Thomas Schmid [6] reported their experienc e with the implementation, deployment and operation of SensorScope, an indoor environmental monitoring net- work based on WSNs. Literature [7] demonstrated an industrial-strength wireless sensor network application for indoor environment monitoring. This application is integrated WSNs with a Building Management System. Won-Suk Jang showed how advanced WSN technologies can be used to monitor conditions in and around build- ings [8]. A WSN system was deployed in a number of residential and commercial buildings in [9]. W.S. Jang and W. M. Healy investigated WSN performance metric for building monitoring applications [10]. It appears that WSN provides huge potential for building monitoring. However, it still needs getting more attention continu- ously. The main contributions of this paper are as follows: (1) a Building Monitoring system based on WSNs (BMW SNs) is presented; (2) inspired by LEACH (Low Energy Adaptive Cluster Hierarchy) method [11,12], a cluster- ing-based network specified for building monitoring is proposed; (3) the configuration module of building management software is used to conduct all nodes in a room forming a local cluster. This cluster formation method does not consume node energy; (4) because cluster-heads cannot d irectly transmit packets to the sink node due to limited wireless communication range, the *Supported by the Key Project of Zhejiang Provincial Ministry of Education under Grant NO.ZD2007003, and the Zhejiang Provincial N a t ural Science Foundation of China under Grant NO.Y1080163. 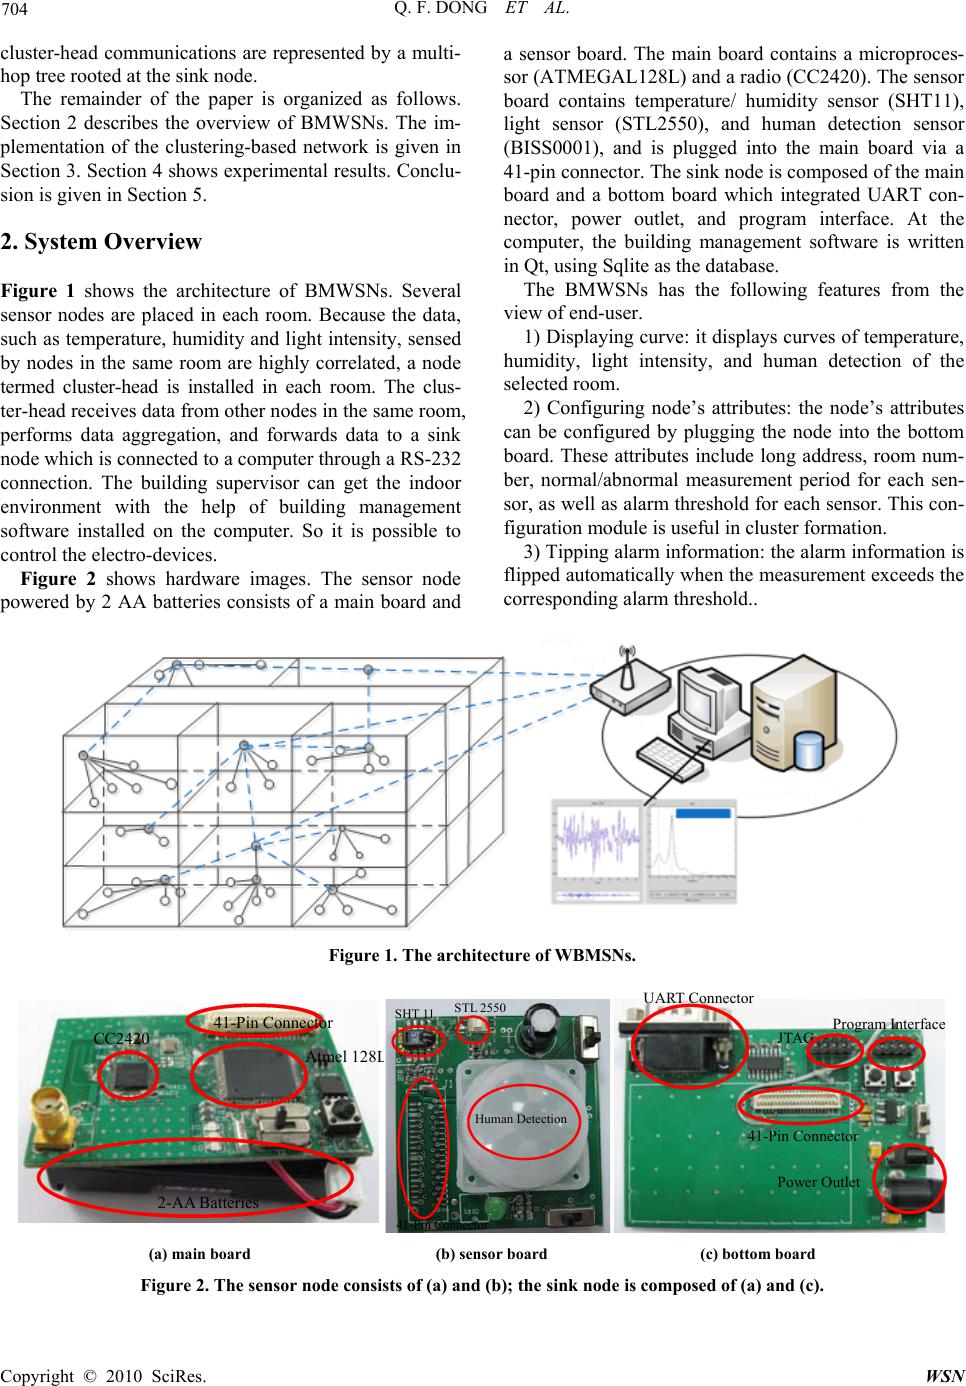 Q. F. DONG ET AL. Copyright © 2010 SciRes. WSN 704 cluster-head communications are represented by a multi- hop tree rooted at the sink node. The remainder of the paper is organized as follows. Section 2 describes the overview of BMWSNs. The im- plementation of the clustering-based network is given in Section 3. Section 4 shows experimental results. Conclu- sion is given in Section 5. 2. System Overview Figure 1 shows the architecture of BMWSNs. Several sensor nodes are placed in each room. Because the data, such as temperature, humidity and light intensity, sensed by nodes in the same room are highly correlated, a node termed cluster-head is installed in each room. The clus- ter-head receives data from other nodes in the same room, performs data aggregation, and forwards data to a sink node which is connected to a computer throu gh a RS- 232 connection. The building supervisor can get the indoor environment with the help of building management software installed on the computer. So it is possible to control the electro-devices. Figure 2 shows hardware images. The sensor node powered by 2 AA batteries consists of a main board and a sensor board. The main board contains a microproces- sor (ATMEGAL128L) and a radio (CC2420). The sensor board contains temperature/ humidity sensor (SHT11), light sensor (STL2550), and human detection sensor (BISS0001), and is plugged into the main board via a 41-pin connector. The sink node is composed of the main board and a bottom board which integrated UART con- nector, power outlet, and program interface. At the computer, the building management software is written in Qt, using Sqlite as the database. The BMWSNs has the following features from the view of end-user. 1) Displaying cu rve: it displays curves of temperature, humidity, light intensity, and human detection of the selected room. 2) Configuring node’s attributes: the node’s attributes can be configured by plugging the node into the bottom board. These attributes include long address, room num- ber, normal/abnormal measurement period for each sen- sor, as well as alarm threshold for each sensor. This con- figuration module is useful in cluster formation. 3) Tipping alarm information: the alarm information is flipped automatically when the measurement exceeds the corresponding alarm threshold.. Figure 1. The architecture of WBMSNs. CC2420 Atmel 128 L 41-Pin Connector 2-AA Batteries STL 2550 SHT 11 Human Detection 41-Pin Connector UART Connector JTAG Power Outlet Program Interface 41-Pin Connector (a) main board (b) sensor board (c) bottom board Figure 2. The sensor node consists of (a) and (b); the sink node is compose d of (a) and (c ). 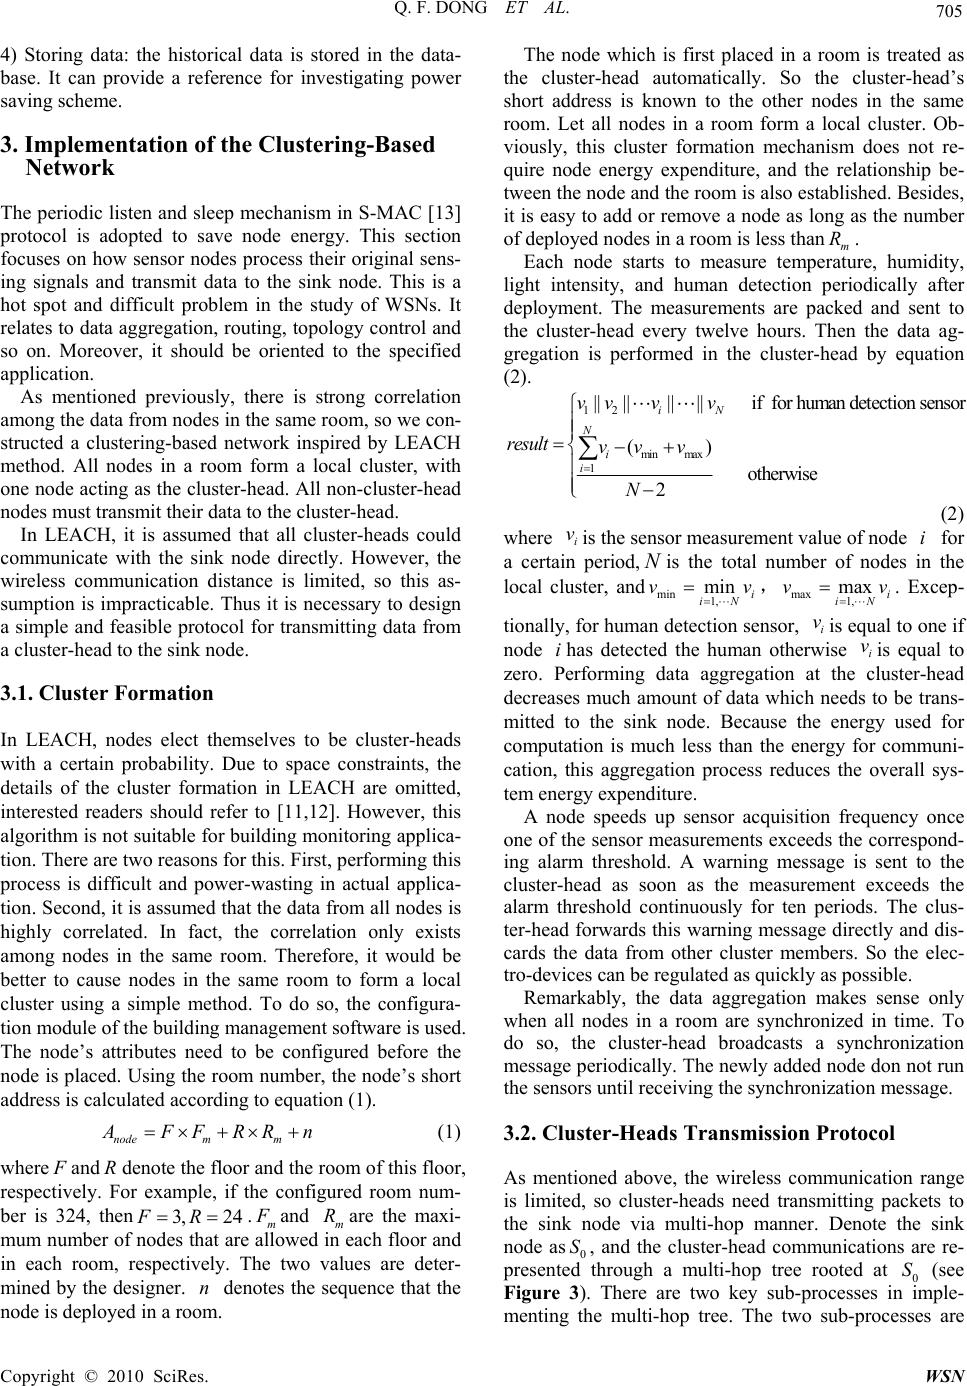 Q. F. DONG ET AL. Copyright © 2010 SciRes. WSN 705 4) Storing data: the historical data is stored in the data- base. It can provide a reference for investigating power saving scheme. 3. Implementation of the Clustering-Based Network The periodic listen and sleep mechanism in S-MAC [13] protocol is adopted to save node energy. This section focuses on how sensor nodes process their original sens- ing signals and transmit data to the sink node. This is a hot spot and difficult problem in the study of WSNs. It relates to data aggregatio n, routing, topology control and so on. Moreover, it should be oriented to the specified application. As mentioned previously, there is strong correlation among the data from nodes in the same room, so we con- structed a clustering-based network inspired by LEACH method. All nodes in a room form a local cluster, with one node acting as the cluster-head. All non-cluster-head nodes must transmit their data to the clu s ter-head. In LEACH, it is assumed that all cluster-heads could communicate with the sink node directly. However, the wireless communication distance is limited, so this as- sumption is impracticable. Thus it is necessary to design a simple and feasible protocol for transmitting data from a cluster-head to the sink node. 3.1. Cluster Formation In LEACH, nodes elect themselves to be cluster-heads with a certain probability. Due to space constraints, the details of the cluster formation in LEACH are omitted, interested readers should refer to [11,12]. However, this algorithm is not suitable for building monitoring applica- tion. There are two reasons for this. First, performing this process is difficult and power-wasting in actual applica- tion. Second, it is assumed that the data from all nodes is highly correlated. In fact, the correlation only exists among nodes in the same room. Therefore, it would be better to cause nodes in the same room to form a local cluster using a simple method. To do so, the configura- tion module of the building management software is used. The node’s attributes need to be configured before the node is placed. Using the room number, the node’s short address is calculated according to equation (1). nodem m A FF RRn (1) where F andRdenote the floor and the room of this floor, respectively. For example, if the configured room num- ber is 324, then3, 24FR .m F and m Rare the maxi- mum number of nodes that are allowed in each floor and in each room, respectively. The two values are deter- mined by the designer. n denotes the sequence that the node is deployed in a room. The node which is first placed in a room is treated as the cluster-head automatically. So the cluster-head’s short address is known to the other nodes in the same room. Let all nodes in a room form a local cluster. Ob- viously, this cluster formation mechanism does not re- quire node energy expenditure, and the relationship be- tween the node and the room is also established. Besides, it is easy to add or remove a node as long as the number of deployed nodes in a room is less thanm R. Each node starts to measure temperature, humidity, light intensity, and human detection periodically after deployment. The measurements are packed and sent to the cluster-head every twelve hours. Then the data ag- gregation is performed in the cluster-head by equation (2). 12 min max 1 ||||||||if for hum an detection sensor () other wise 2 iN N i i vv vv result vv v N (2) where i vis the sensor measurement value of node i for a certain period, N is the total number of nodes in the local cluster, andmin 1, min i iN vv ,max 1, max i iN vv . Excep- tionally, for human detection sensor, i vis equal to one if node ihas detected the human otherwise i vis equal to zero. Performing data aggregation at the cluster-head decreases much amount of data which needs to be trans- mitted to the sink node. Because the energy used for computation is much less than the energy for communi- cation, this aggregation process reduces the overall sys- tem energy expenditure. A node speeds up sensor acquisition frequency once one of the sensor measurements exceeds the correspond- ing alarm threshold. A warning message is sent to the cluster-head as soon as the measurement exceeds the alarm threshold continuously for ten periods. The clus- ter-head forwards this warning message directly and dis- cards the data from other cluster members. So the elec- tro-devices can be regulated as quickly as possible. Remarkably, the data aggregation makes sense only when all nodes in a room are synchronized in time. To do so, the cluster-head broadcasts a synchronization message periodically. The newly added node don not run the sensors until receiving the synchronization message. 3.2. Cluster-Heads Transmission Protocol As mentioned above, the wireless communication range is limited, so cluster-heads need transmitting packets to the sink node via multi-hop manner. Denote the sink node as0 S, and the cluster-head communications are re- presented through a multi-hop tree rooted at 0 S (see Figure 3). There are two key sub-processes in imple- menting the multi-hop tree. The two sub-processes are  Q. F. DONG ET AL. Copyright © 2010 SciRes. WSN 706 Figure 3. An example of multi-hop tree. The red circle de- notes the sink node, while the yellow ones denote clus- ter-heads. tree initialization and tree maintenance. The goal of the tree initialization is to initialize a tree with cluster-heads and the sink node. The tree maintenance is aimed at up- dating the tree structure to balance energy consumption among cluster-heads. 3.2.1. Tree Initialization All cluster-heads are separated originally. The sink node forms a “network” and its depth in the network is zero. The aim of the tree initializatio n is to exp and th e n etwork to construct a tree rooted at 0 S. The initialization pro- cedure is described as follows. Step 1 A cluster-head that plans to join the network broadcasts a join-network request message. This clus- ter-head is termed CH. Meanwhile, a timer with fixed time period is scheduled. Then CH waits for response message during this time. The waiting time period should be long enough so that it allows multiple neighbors to response to the request. Step 2 Neighbors of CH would receive the join-net- work request message. The neighbor sends out a join- network response message containing its depth in the network if it has joined the network, otherwise it discards the request. Step 3 CH chooses the neighbor whose response mes- sage has the strongest received signal strength (RSS) as its candidate parent. The RSS is indicated by the re- ceived signal streng th indicator in cc2420 ch ip. Then CH unicasts an association request message to the selected candidate parent. Step 4 Upon reception of the association request mes- sage, the candidate parent responses it and adds CH to its children table. Step 5 Receiving an association response message in- dicates that CH has joined the network successfully. CH stores information of the parent node and its depth in the network. CH’s depth in the network is one more than the depth of parent node. If CH cannot receive any join-network response mes- sage when the timer expires or it fails to request associa- tion, it tries to join the network again after a random de- lay. Using this method, neighbors of the sink node join the network firstly. Then do the two-hop cluster-heads of the sink node. A tree rooted at0 Sis formed gradually. 3.2.2. Tree Maintenance Each cluster-head can send packets to its parent after the tree is formed. However, the energy consumption among these cluster-heads is very different even they have the same depth in the tree, because each of them has a dif- ferent number of children. Therefore, it is necessary to perform tree maintenance to balance the energy con- sumption. To do so, each cluster-head updates its parent periodi- cally, and the update period is computed randomly to avoid radio interference. The updating process is similar to the tree initialization sub-process, and the difference between them is that the join-network response message from nodej contains more parameters about nodejin the updating process. These parameters include the chil- dren number j c, the residual energy j E, and the depth j din the tree. The combinations of them are considered in Step 3. Denote E as the initial energy of 2 AA bat- teries. A cluster-head ichooses the neighbor n as its parent with probabilityin P, as calculated by equation (3): 3 12 3 12 (1 /)(1 /)(/), (1 /)(1 /)(/) i n nn in i j jj jp cdEE Pnp cdEE (3) where i pis the set of cluster-heads that response to the join-network request from cluster-headi, and 12 3 ,,and are nonnegative weighting factors for each item. 4. Experiments The BMWSNs is operated in buildings, and the material quality of the buildings, environmental condition, and so on can affect the distance and quality of the wireless communication. Figure 4 shows the packet loss rate versus the wireless communication distance between two nodes which are separated by a wall. It indicates that the packet loss rate is lower than 20%. The packet is re- transmitted if it is lost, then the packet loss rate is less than 4%. This demonstrates that deploying a cluster-head in each room can guarantee the network connectivity if all rooms are smaller than the size of 15×15. The BMWSNs is tested with 21 nodes deployed ran- domly in several rooms. The node’s attributes are con- figured using the configuration module of the building management software before the node is deployed. The actual deployment is shown as Figure 5. The sink node is deployed in room 323. Each room has a cluster-head and several sensor nodes. The figure between brackets 0 S  Q. F. DONG ET AL. Copyright © 2010 SciRes. WSN 707 01 2 3 4 5 6 7 8 910 11 12 13 14 15 0 0.1 0.2 0.3 0.4 0.5 0.6 0.7 0.8 0.9 1 distance(m) packet loss rate Figure 4. The packet loss rate VS. the distance. denotes the node’s shor t address. In th e test, the maximal number of nodes that are allowed in each floor and each room are 100 and 10, respectively. Figure 6 is a network topology graph as the BMWSNs starts up. The dotted lines with arrow denote communi- cation links. It demonstrates the feasibility of the pro- posed clustering-based network. All nodes in a room form a star network centered on the cluster-head and all the cluster-heads build a multi-hop tree rooted at the sink node. Along this tree, all packets can be delivered to the sink node. For example, the route from nodes in room 322 to the sink node is as follows: 322 322 323NS CHCHSINK where NSn and CHn denote the sensor nodes and the cluster-head in room n, respectively. Figure 7 shows the temperature curve of room 323. It also can display curves of other parameters by clicking on the icon at upper-right corner. This provides reference for controlling electrical devices in real time. We regulate the temperature of room 322 at 16C (The upper and lower thresholds of temperature are 18 C and 26C , respectively), then the alarm informa- tion is flipped automatically (see Figure 8). Figure 9 shows historical temperature analysis chart. It provides a basis for building energy-saving plan. 5. Conclusions The system architecture of BMWSNs is presented and an overview of system features is given. This paper focuses on the two key methodologies which are used to imple- ment the clustering-based network specified for building monitoring. The experiment was made to demonstrate the feasibility of the BMWSNs. However, there exist shortages inevitably as a result of exploratory research on applying WSNs to building monitoring. We will per- form further tests to find problems, and then improve it from both hardware and software. Future plans for the BMWSNs include: Figure 5. The actual deployment.  Q. F. DONG ET AL. Copyright © 2010 SciRes. WSN 708 1) Usually, electric devices are regulated only when the data exceeds the alarm threshold. Therefore, nodes could store normal data locally in order to save com- munication energy consumption, and the user queries data depending on the need. Thus nodes deployed in the building construct a distributed storage and query data- base. Figure 6. The network topology. Figure 7. The temperature curve of room 323. Figure 8. The alarm information. Figure 9. The historical temperature analysis chart. 2) In current WBMSNs, a node is always the clus- ter-head once it is configured as a cluster-head. This leads to exhausting the energy of these cluster-heads quickly. In order to solve this problem, it is necessary to explore a mechanism for switching cluster-heads auto- matically. 3) How to deploy nodes to optimize the network per- formance is also the focus of further research. 5. References [1] B. Robert, “Buildings Can Play a Key Role in Com- bat- in g C l i m a te Change,” 2007. http://www.unep.org/Documents.Multilingual/Default.asp [2] K. M. Michael and R. B. Michael, “Pros & Cons of Wire- less,” American Society and Heating, Refrigerating, and Air-Conditioning Engineers Journal, Vol. 44, No. 11, November 2002, pp. 54 - 61. [3] L. M. Sun, J. Z. Li, Y. Chen and H. S. Zhu, “Wireless Sensors Networks,” Tsinghua University Press, Beijing, 2005. [4] A. Willing, “Wireless Sensor Networks: Concept, Chal- lenges and Approaches,” Elektrotechnik & Information- stechnik, Vol. 123, No.6, June 2006, pp. 224-231. [5] C. Adam and W. Jakub, “On Applications of Wireless Sensor Networks,” Internet - Technical Development and Applications, Springer, 2009, pp.91-99. [6] S. Thomas, D. F. Henri and V. Martin, “Sensor Scope: Experiences with a Wireless Building Monitoring Sensor Network,” Proceedings of the Workshop on Real-World Wireless Sensor Networks, Stockholm, 2005. [7] J. Y. Chang, J. Y. Kim and O. Kwon, “Demo Abstract: Control City – Integrating Wireless Sensor Networks and Building Management Systems,” Proceedings of the 2009 International Conference on Information Processing in Sensor Networks. San Francisco, February, 2009, pp. 421-422.  Q. F. DONG ET AL. Copyright © 2010 SciRes. WSN 709 [8] W. S. Jang, W. M. Healy and J. S. Miroslaw, “Wireless Sensor Networks as Part of a Web-Based Building Envi- ronmental Monitoring System,” Automation in Construc- tion, Vol. 17, No. 6, August 2008, pp. 729-736. [9] D. Tessa, G. Elena and B. James, “Wireless Sensor Net- works to Enable the Passive House- Deployment Experi- ences,” Smart Sensing and Context, Berlin Heidelberg: Springer, 2009, pp. 177-192. [10] W. S. Jang and W. M. Healy, “Wireless Sensor Network Performance Metrics for Building Applications,” Energy and Buildings, Vol. 42, No. 6, 2010, pp. 862-868. [11] W. B. Heinzelman, A. P. Chandrakasan and H. Balak- rishnan, “An Application-Specific Protocol Architecture for Wireless Micro-sensor Networks,” IEEE Transactions on Wireless Communications, Vol. 1, No. 4, 2002, pp. 660-670. [12] W. B. Heinzelman, A. P. Chandrakasan and H. Balak- rishnan, “Energy-Efficient Communication Protocol for Wireless Micro-sensor Networks,” Proceedings of the 33rd Hawaii International Conference on System Sci- ences. Hawaii, 2000, pp. 1-10. [13] W. Ye, J. Heidemann and D. Estrin, “An Ene rgy -Ef fici ent MAC Protocol for Wireless Sensor Networks,” Proceed- ings of the 21st International Joint Conference on IEEE Computer and Communications Societies, New York, June 2002, pp. 1567-1576. |