Paper Menu >>
Journal Menu >>
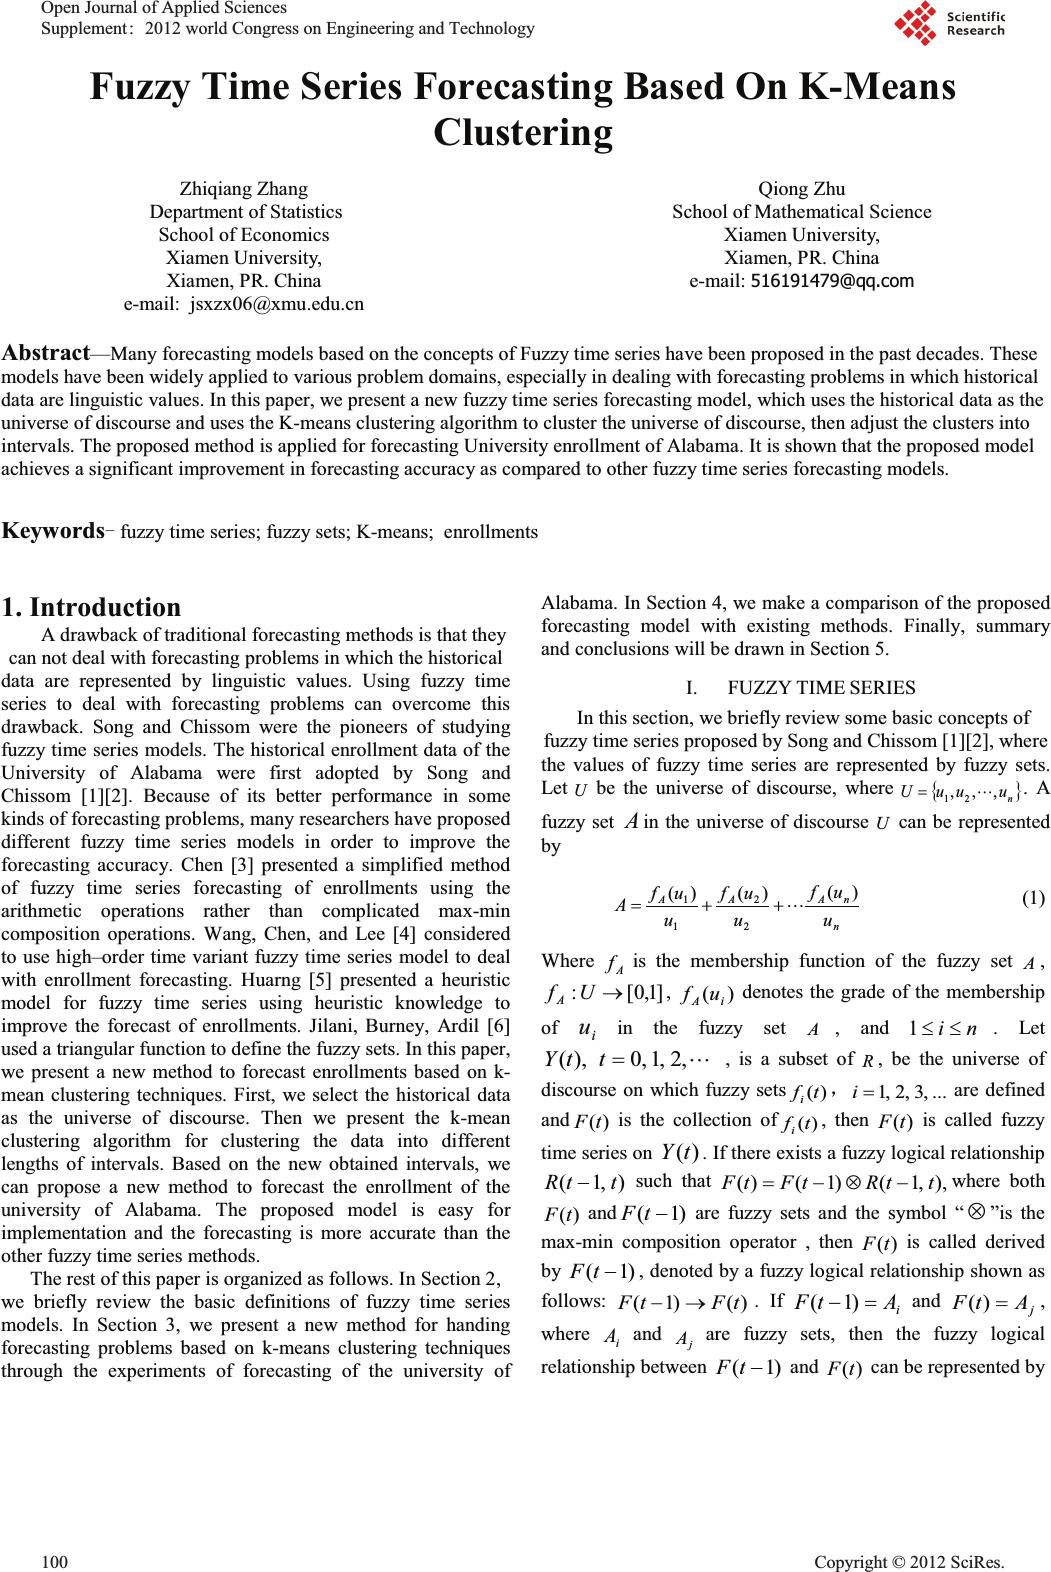 Fuzzy Time Series Forecasting Based On K-Means Clustering Zhiqiang Zhang Department of Statistics School of Economics Xiamen University, Xiamen, PR. China e-mail: jsxzx06@xmu.edu.cn Qiong Zhu School of Mathematical Science Xiamen University, Xiamen, PR. China e-mail: 516191479@qq.com Abstract—Many forecasting models based on the concepts of Fuzzy time series have been proposed in the past decades. These models have been widely applied to various problem domains, especially in dealing with forecasting problems in which historical data are linguistic values. In this paper, we present a new fuzzy time series forecasting model, which uses the historical data as the universe of discourse and uses the K-means clustering algorithm to cluster the universe of discourse, then adjust the clusters into intervals. The proposed method is applied for forecasting University enrollment of Alabama. It is shown that the proposed model achieves a significant improvement in forecasting accuracy as compared to other fuzzy time series forecasting models. Keywords fuzzy time series; fuzzy sets; K-means; enrollments 1. Introduction A drawback of traditional forecasting methods is that they can not deal with forecasting problems in which the historical data are represented by linguistic values. Using fuzzy time series to deal with forecasting problems can overcome this drawback. Song and Chissom were the pioneers of studying fuzzy time series models. The historical enrollment data of the University of Alabama were first adopted by Song and Chissom [1][2]. Because of its better performance in some kinds of forecasting problems, many researchers have proposed different fuzzy time series models in order to improve the forecasting accuracy. Chen [3] presented a simplified method of fuzzy time series forecasting of enrollments using the arithmetic operations rather than complicated max-min composition operations. Wang, Chen, and Lee [4] considered to use high–order time variant fuzzy time series model to deal with enrollment forecasting. Huarng [5] presented a heuristic model for fuzzy time series using heuristic knowledge to improve the forecast of enrollments. Jilani, Burney, Ardil [6] used a triangular function to define the fuzzy sets. In this paper, we present a new method to forecast enrollments based on k- mean clustering techniques. First, we select the historical data as the universe of discourse. Then we present the k-mean clustering algorithm for clustering the data into different lengths of intervals. Based on the new obtained intervals, we can propose a new method to forecast the enrollment of the university of Alabama. The proposed model is easy for implementation and the forecasting is more accurate than the other fuzzy time series methods. The rest of this paper is organized as follows. In Section 2, we briefly review the basic definitions of fuzzy time series models. In Section 3, we present a new method for handing forecasting problems based on k-means clustering techniques through the experiments of forecasting of the university of Alabama. In Section 4, we make a comparison of the proposed forecasting model with existing methods. Finally, summary and conclusions will be drawn in Section 5. I. FUZZY TIME SERIES In this section, we briefly review some basic concepts of fuzzy time series proposed by Song and Chissom [1][2], where the values of fuzzy time series are represented by fuzzy sets. Let U be the universe of discourse, where ^` n uuuU ,,, 21 " . A fuzzy set A in the universe of discourse U can be represented by n nA AA u uf u uf u uf A)( )()( 2 2 1 1 " (1) Where A f is the membership function of the fuzzy set A , ]1,0[: oUf A , )( iA uf denotes the grade of the membership of i u in the fuzzy set A , and ni dd1 . Let ",2,1,0),( ttY , is a subset of R , be the universe of discourse on which fuzzy sets )(tf i ˈ ...,3,2,1 i are defined and )(tF is the collection of )(tf i , then )(tF is called fuzzy time series on )(tY . If there exists a fuzzy logical relationship ),1( ttR such that ),,1()1()( ttRtFtF where both )(tF and )1( tF are fuzzy sets and the symbol “ ”is the max-min composition operator , then )(tF is called derived by )1( tF , denoted by a fuzzy logical relationship shown as follows: )()1( tFtFo . If i AtF )1( and j AtF )( , where i A and j A are fuzzy sets, then the fuzzy logical relationship between )1( tF and )(tF can be represented by Open Journal of Applied Sciences Supplement:2012 world Congress on Engineering and Technology 100 Cop y ri g ht © 2012 SciRes.  ji AA o , where i A and j A are called current state and the next state of the fuzzy logical relationship, respectively. 2. A New Method For Fuzzy Time Series Forecasting In this section, we present the stepwise procedure of the proposed method for fuzzy time series forecasting based on historical time series data and apply the proposed method to forecast the enrollments of the University of Alabama. TABLE 1 shows the historical enrollments data of the University of Alabama. TABLE 1. HISTORICAL ENROLLMENTS OF UNIVERSITY OF ALABAMA YearActual enrollmentsYearActual enrollments 1971 13055 1982 15433 1972 13563 1983 15497 1973 13867 1984 15145 1974 14696 1985 15163 1975 15460 1986 15984 1976 15311 1987 16859 1977 15603 1988 18150 1978 15861 1989 18970 1979 16807 1990 19328 1980 16919 1991 19337 1981 16388 1992 18876 The proposed method and the experiment results are now presented as follows: Step 1: Apply the K-means clustering algorithm to partition the historical time series data into 14 clusters and sort the data in clusters in an ascending sequence, the results are as follows: {13055},{13563},{13867},{14696},{15145,15163},{15311,1 5433,15460,15497},{15603},{15861},{15984},{16388},{168 07,16859,16919},{18150},{18876,18970},{19328,19337}. Step 2: Calculate the cluster center m centercluster _ shown in TABLE 2 of each cluster m cluster as follows: r d centercluster r jj m ¦ 1 _ (2) Step 3: Adjust the clusters into intervals according to the follow rules. Assume that m centercluster _ and 1 _ m centercluster are adjacent cluster centers, then the upper bound m uBoundcluster _ of m cluster and the lower bound 1 _ m lBoundcluster of 1m cluster shown in TABLE 2 can be calculated as follows: 2 __ _ 1 mm m centerclustercentercluster uBoundcluster (3) mm uBoundclusterlBoundcluster __ 1 (4) wher e .1,2,1 km " Because there is no previous cluster before the first cluster and there is no next cluster after the last cluster, the lower bound 1 _lBoundcluster of the first cluster and the upper bound k uBoundcluster _ of the last cluster can be calculated as follows: )__( __ kk kk lBoundclustercentercluster centerclusteruBoundcluster )__( __ 11 11 centerclusteruBoundcluster centerclusterlBoundcluster After applying the procedure, we can get the following intervals and calculate the middle value of the interval in TABLE 2, )13309,12801[ 1 u )13715,13309[ 2 u )14282,13715[ 3 u )14925,14282[ 4 u )15290,14925[ 5 u )15514,15290[ 6 u )15732,15514[ 7 u )15923,15732[ 8 u )16186,15923[ 9 u )16625,16186[ 10 u )17506,16625[ 11 u )18537,17506[ 12 u )19128,18537[ 13 u ]19537,19128[ 14 u Step 4: Define each fuzzy set i X based on the intervals and the historical enrollments shown in TABLE 1, where fuzzy set i X denotes a linguistic value of the enrollments represented by a fuzzy set. As in [6], we use a triangular function to define the fuzzy sets i X . Step 5: Defuzzify the fuzzy data using the forecasting formula The support of National Social Science Fund Project (11BTJ001), MOE Key Laboratory of Econometrics and Fujian Key Laboratory of Statistical Sciences are gratefully acknowledged. Cop y ri g ht © 2012 SciRes.101 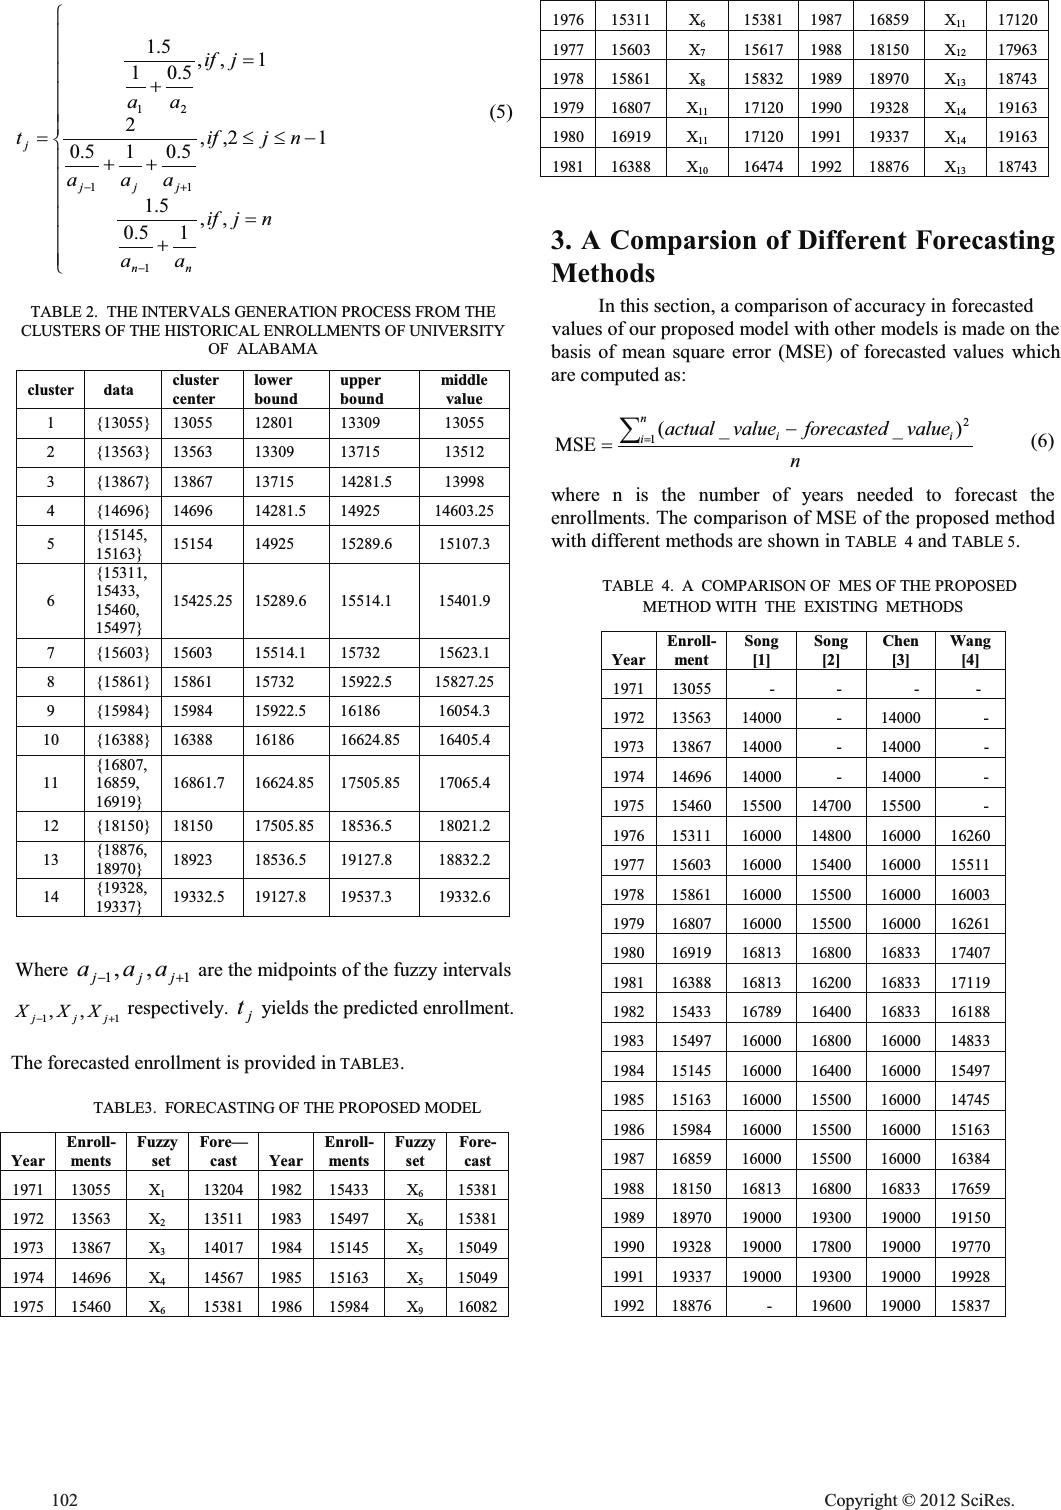 ° ° ° ° ° ° ¯ ° ° ° ° ° ° ® dd njif aa njif aaa jif aa t nn jjj j ,, 15.0 5.1 12,, 5.015.0 2 1,, 5.01 5.1 1 11 21 (5) TABLE 2. THE INTERVALS GENERATION PROCESS FROM THE CLUSTERS OF THE HISTORICAL ENROLLMENTS OF UNIVERSITY OF ALABAMA cluster datacluster center lower bound upper bound middle valu e 1 {13055} 13055 12801 13309 13055 2 {13563} 13563 13309 13715 13512 3 {13867} 13867 13715 14281.5 13998 4 {14696} 14696 14281.5 14925 14603.25 5 {15145, 15163} 15154 14925 15289.6 15107.3 6 {15311, 15433, 15460, 15497} 15425.25 15289.6 15514.1 15401.9 7 {15603} 15603 15514.1 15732 15623.1 8 {15861} 15861 15732 15922.5 15827.25 9 {15984} 15984 15922.5 16186 16054.3 10 {16388} 16388 16186 16624.85 16405.4 11 {16807, 16859, 16919} 16861.7 16624.85 17505.85 17065.4 12 {18150} 18150 17505.85 18536.5 18021.2 13 {18876, 18970} 18923 18536.5 19127.8 18832.2 14 {19328, 19337} 19332.5 19127.8 19537.3 19332.6 Where 11 ,, jjj aaa are the midpoints of the fuzzy intervals 11 ,, jjj XXX respectively. j t yields the predicted enrollment. The forecasted enrollment is provided in TABLE3. TABLE3. FORECASTING OF THE PROPOSED MODEL Year Enroll- ment s Fuzzy set Fore— cast Year Enroll- ment s Fuzzy set Fore- cast 1971 13055 X1 13204 1982 15433 X6 15381 1972 13563 X2 13511 1983 15497 X6 15381 1973 13867 X3 14017 1984 15145 X5 15049 1974 14696 X4 14567 1985 15163 X5 15049 1975 15460 X6 15381 1986 15984 X9 16082 1976 15311 X6 15381 1987 16859 X11 17120 1977 15603 X7 15617 1988 18150 X12 17963 1978 15861 X8 15832 1989 18970 X13 18743 1979 16807 X11 17120 1990 19328 X14 19163 1980 16919 X11 17120 1991 19337 X14 19163 1981 16388 X10 16474 1992 18876 X13 18743 3. A Comparsion of Different Forecasting Methods In this section, a comparison of accuracy in forecasted values of our proposed model with other models is made on the basis of mean square error (MSE) of forecasted values which are computed as: n valueforecastedvalueactual n iii ¦ 1 2 )__( MSE (6) where n is the number of years needed to forecast the enrollments. The comparison of MSE of the proposed method with different methods are shown in TABLE 4 and TABLE 5. TABLE 4. A COMPARISON OF MES OF THE PROPOSED METHOD WITH THE EXISTING METHODS Year Enroll- ment Song [1] Song [2] Chen [3] Wan g [4] 1971 13055 - - - - 1972 13563 14000 - 14000 - 1973 13867 14000 - 14000 - 1974 14696 14000 - 14000 - 1975 15460 15500 14700 15500 - 1976 15311 16000 14800 16000 16260 1977 15603 16000 15400 16000 15511 1978 15861 16000 15500 16000 16003 1979 16807 16000 15500 16000 16261 1980 16919 16813 16800 16833 17407 1981 16388 16813 16200 16833 17119 1982 15433 16789 16400 16833 16188 1983 15497 16000 16800 16000 14833 1984 15145 16000 16400 16000 15497 1985 15163 16000 15500 16000 14745 1986 15984 16000 15500 16000 15163 1987 16859 16000 15500 16000 16384 1988 18150 16813 16800 16833 17659 1989 18970 19000 19300 19000 19150 1990 19328 19000 17800 19000 19770 1991 19337 19000 19300 19000 19928 1992 18876 - 19600 19000 15837 102 Cop y ri g ht © 2012 SciRes. 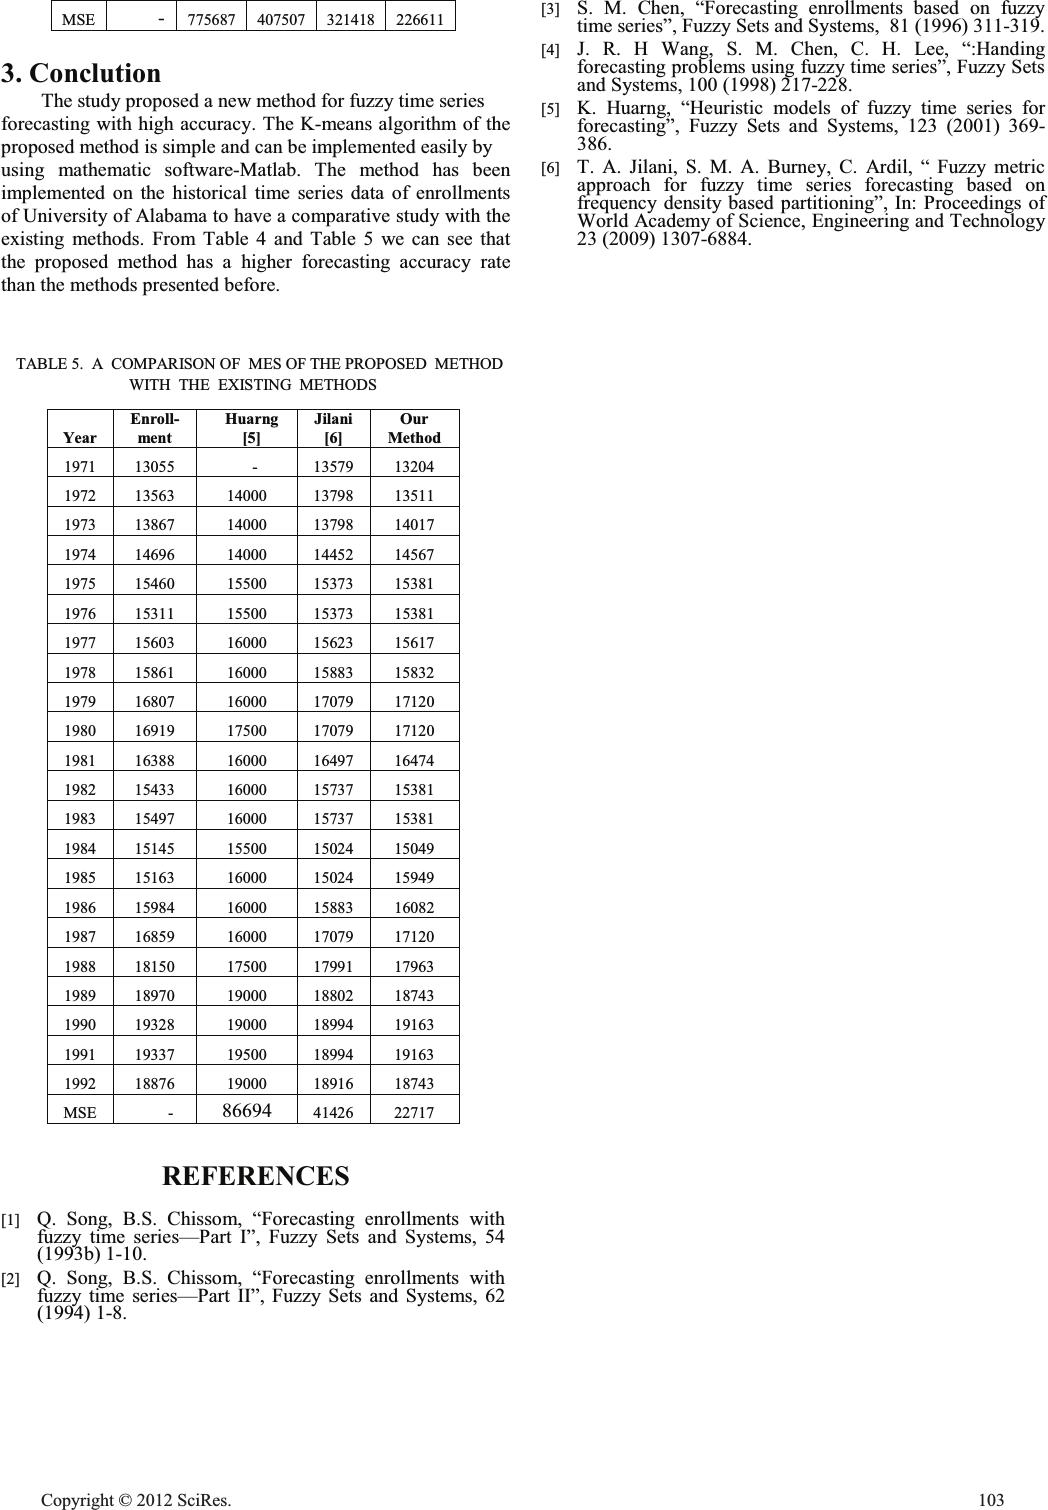 MSE - 775687 407507 321418 226611 3. Conclution The study proposed a new method for fuzzy time series forecasting with high accuracy. The K-means algorithm of the proposed method is simple and can be implemented easily by using mathematic software-Matlab. The method has been implemented on the historical time series data of enrollments of University of Alabama to have a comparative study with the existing methods. From Table 4 and Table 5 we can see that the proposed method has a higher forecasting accuracy rate than the methods presented before. TABLE 5. A COMPARISON OF MES OF THE PROPOSED METHOD WITH THE EXISTING METHODS Year Enroll- ment Huarng [5] Jilani [6] Our Method 1971 13055 - 13579 13204 1972 13563 14000 13798 13511 1973 13867 14000 13798 14017 1974 14696 14000 14452 14567 1975 15460 15500 15373 15381 1976 15311 15500 15373 15381 1977 15603 16000 15623 15617 1978 15861 16000 15883 15832 1979 16807 16000 17079 17120 1980 16919 17500 17079 17120 1981 16388 16000 16497 16474 1982 15433 16000 15737 15381 1983 15497 16000 15737 15381 1984 15145 15500 15024 15049 1985 15163 16000 15024 15949 1986 15984 16000 15883 16082 1987 16859 16000 17079 17120 1988 18150 17500 17991 17963 1989 18970 19000 18802 18743 1990 19328 19000 18994 19163 1991 19337 19500 18994 19163 1992 18876 19000 18916 18743 MSE - 86694 41426 22717 REFERENCES [1] Q. Song, B.S. Chissom, “Forecasting enrollments with fuzzy time series—Part I”, Fuzzy Sets and Systems, 54 (1993b) 1-10. [2] Q. Song, B.S. Chissom, “Forecasting enrollments with fuzzy time series—Part II”, Fuzzy Sets and Systems, 62 (1994) 1-8. [3] S. M. Chen, “Forecasting enrollments based on fuzzy time series”, Fuzzy Sets and Systems, 81 (1996) 311-319. [4] J. R. H Wang, S. M. Chen, C. H. Lee, “:Handing forecasting problems using fuzzy time series”, Fuzzy Sets and Systems, 100 (1998) 217-228. [5] K. Huarng, “Heuristic models of fuzzy time series for forecasting”, Fuzzy Sets and Systems, 123 (2001) 369- 386. [6] T. A. Jilani, S. M. A. Burney, C. Ardil, “ Fuzzy metric approach for fuzzy time series forecasting based on frequency density based partitioning”, In: Proceedings of World Academy of Science, Engineering and Technology 23 (2009) 1307-6884. Cop y ri g ht © 2012 SciRes.103 |