Paper Menu >>
Journal Menu >>
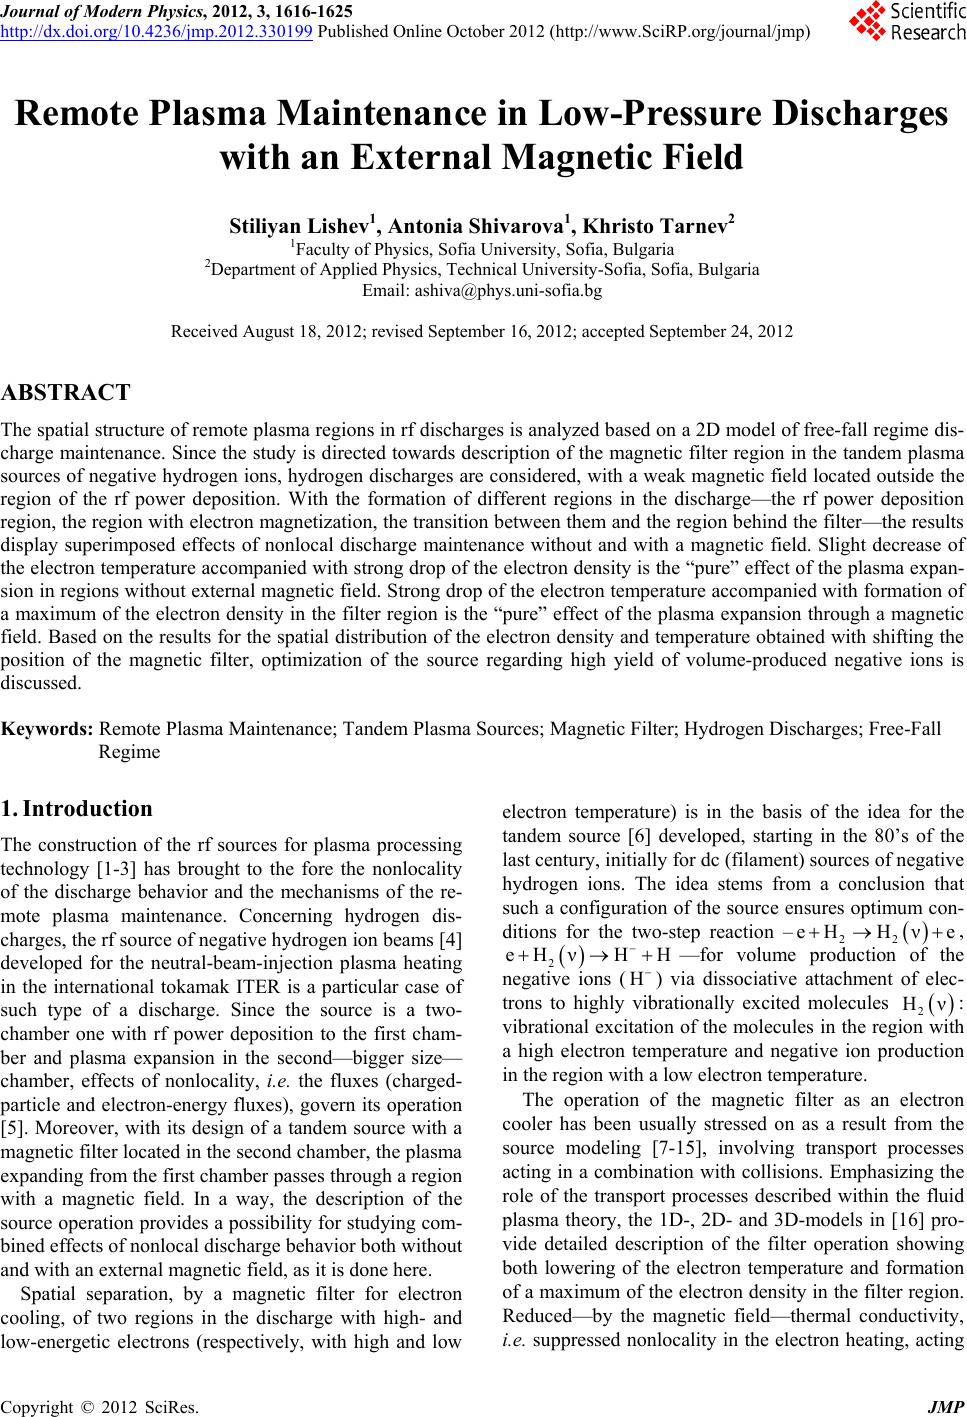 Journal of Modern Physics, 2012, 3, 1616-1625 http://dx.doi.org/10.4236/jmp.2012.330199 Published Online October 2012 (http://www.SciRP.org/journal/jmp) Remote Plasma Maintenance in Low-Pressure Discharges with an External Magnetic Field Stiliyan Lishev1, Antonia Shivarova1, Khristo Tarnev2 1Faculty of Physics, Sofia University, Sofia, Bulgaria 2Department of Applied Physics, Technical University-Sofia, Sofia, Bulgaria Email: ashiva@phys.uni-sofia.bg Received August 18, 2012; revised September 16, 2012; accepted September 24, 2012 ABSTRACT The spatial structure of remote plasma regions in rf discharges is analyzed based on a 2D model of free-fall regime dis- charge maintenance. Since the study is directed towards description of the magnetic filter region in the tandem plasma sources of negative hydrogen ions, hydrogen discharges are considered, with a weak magnetic field located outside the region of the rf power deposition. With the formation of different regions in the discharge—the rf power deposition region, the region with electron magnetization, the transition between them and the region behind the filter—the results display superimposed effects of nonlocal discharge maintenance without and with a magnetic field. Slight decrease of the electron temperature accompanied with strong drop of the electron density is the “pure” effect of the plasma expan- sion in regions without external magnetic field. Strong drop of the electron temperature accompanied with formation of a maximum of the electron density in the filter region is the “pure” effect of the plasma expansion through a magnetic field. Based on the results for the spatial distribution of the electron density and temperature obtained with shifting the position of the magnetic filter, optimization of the source regarding high yield of volume-produced negative ions is discussed. Keywords: Remote Plasma Maintenance; Tandem Plasma Sources; Magnetic Filter; Hydrogen Discharges; Free-Fall Regime 1. Introduction The construction of the rf sources for plasma processing technology [1-3] has brought to the fore the nonlocality of the discharge behavior and the mechanisms of the re- mote plasma maintenance. Concerning hydrogen dis- charges, the rf source of negative hydrogen ion beams [4] developed for the neutral-beam-injection plasma heating in the international tokamak ITER is a particular case of such type of a discharge. Since the source is a two- chamber one with rf power deposition to the first cham- ber and plasma expansion in the second—bigger size— chamber, effects of nonlocality, i.e. the fluxes (charged- particle and electron-energy fluxes), govern its operation [5]. Moreover, with its design of a tandem source with a magnetic filter located in the second chamber, the plasma expanding from the first chamber passes through a region with a magnetic field. In a way, the description of the source operation provides a possibility for studying com- bined effects of nonlocal discharge behavior both without and with an external magnetic field, as it is done here. Spatial separation, by a magnetic filter for electron cooling, of two regions in the discharge with high- and low-energetic electrons (respectively, with high and low electron temperature) is in the basis of the idea for the tandem source [6] developed, starting in the 80’s of the last century, initially for dc (filament) sources of negative hydrogen ions. The idea stems from a conclusion that such a configuration of the source ensures optimum con- ditions for the two-step reaction – Hνe 22 eH , eHνHH 2 H —for volume production of the negative ions ( ) via dissociative attachment of elec- trons to highly vibrationally excited molecules Hν 2: vibrational excitation of the molecules in the region with a high electron temperature and negative ion production in the region with a low electron temperature. The operation of the magnetic filter as an electron cooler has been usually stressed on as a result from the source modeling [7-15], involving transport processes acting in a combination with collisions. Emphasizing the role of the transport processes described within the fluid plasma theory, the 1D-, 2D- and 3D-models in [16] pro- vide detailed description of the filter operation showing both lowering of the electron temperature and formation of a maximum of the electron density in the filter region. Reduced—by the magnetic field—thermal conductivity, i.e. suppressed nonlocality in the electron heating, acting C opyright © 2012 SciRes. JMP 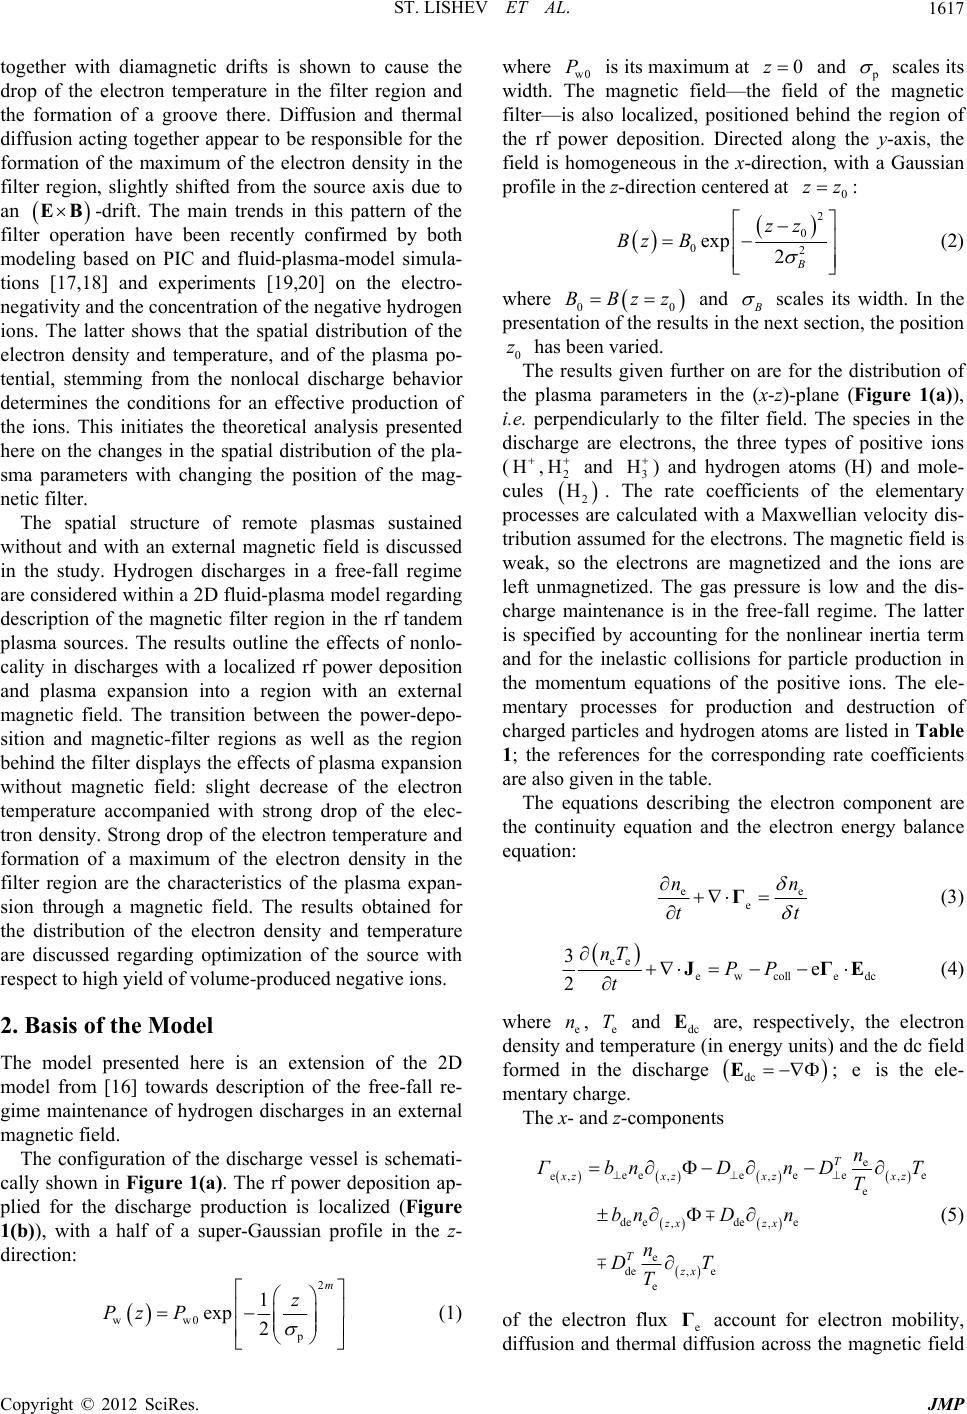 ST. LISHEV ET AL. 1617 together with diamagnetic drifts is shown to cause the drop of the electron temperature in the filter region and the formation of a groove there. Diffusion and thermal diffusion acting together appear to be responsible for the formation of the maximum of the electron density in the filter region, slightly shifted from the source axis due to an -drift. The main trends in this pattern of the filter operation have been recently confirmed by both modeling based on PIC and fluid-plasma-model simula- tions [17,18] and experiments [19,20] on the electro- negativity and the concentration of the negative hydrogen ions. The latter shows that the spatial distribution of the electron density and temperature, and of the plasma po- tential, stemming from the nonlocal discharge behavior determines the conditions for an effective production of the ions. This initiates the theoretical analysis presented here on the changes in the spatial distribution of the pla- sma parameters with changing the position of the mag- netic filter. EB The spatial structure of remote plasmas sustained without and with an external magnetic field is discussed in the study. Hydrogen discharges in a free-fall regime are considered within a 2D fluid-plasma model regarding description of the magnetic filter region in the rf tandem plasma sources. The results outline the effects of nonlo- cality in discharges with a localized rf power deposition and plasma expansion into a region with an external magnetic field. The transition between the power-depo- sition and magnetic-filter regions as well as the region behind the filter displays the effects of plasma expansion without magnetic field: slight decrease of the electron temperature accompanied with strong drop of the elec- tron density. Strong drop of the electron temperature and formation of a maximum of the electron density in the filter region are the characteristics of the plasma expan- sion through a magnetic field. The results obtained for the distribution of the electron density and temperature are discussed regarding optimization of the source with respect to high yield of volume-produced negative ions. 2. Basis of the Model The model presented here is an extension of the 2D model from [16] towards description of the free-fall re- gime maintenance of hydrogen discharges in an external magnetic field. The configuration of the discharge vessel is schemati- cally shown in Figure 1(a). The rf power deposition ap- plied for the discharge production is localized (Figure 1(b)), with a half of a super-Gaussian profile in the z- direction: 2 p 1 2 m z P0z ww 0 expPz P (1) where w0 is its maximum at and p scales its width. The magnetic field—the field of the magnetic filter—is also localized, positioned behind the region of the rf power deposition. Directed along the y-axis, the field is homogeneous in the x-direction, with a Gaussian profile in the z-direction centered at : 0 zz 2 0 02 exp 2B zz Bz B (2) BBzz 00 and B where scales its width. In the presentation of the results in the next section, the position has been varied. 0 z The results given further on are for the distribution of the plasma parameters in the (x-z)-plane (Figure 1(a)), i.e. perpendicularly to the filter field. The species in the discharge are electrons, the three types of positive ions (H ,2 H and 3 H ) and hydrogen atoms (H) and mole- cules H2. The rate coefficients of the elementary processes are calculated with a Maxwellian velocity dis- tribution assumed for the electrons. The magnetic field is weak, so the electrons are magnetized and the ions are left unmagnetized. The gas pressure is low and the dis- charge maintenance is in the free-fall regime. The latter is specified by accounting for the nonlinear inertia term and for the inelastic collisions for particle production in the momentum equations of the positive ions. The ele- mentary processes for production and destruction of charged particles and hydrogen atoms are listed in Table 1; the references for the corresponding rate coefficients are also given in the table. The equations describing the electron component are the continuity equation and the electron energy balance equation: ee e nn tt Γ (3) ee ewcoll edc 3e 2 nT PP t JΓE n TE (4) where e, e and dc are, respectively, the electron density and temperature (in energy units) and the dc field formed in the discharge dc Ee ; is the ele- mentary charge. The x- and z-components e eeee ee e, ,,, e de edee ,, e de e , e T xz xzxzxz zx zx T zx n ΓbnDn DT T bnD n n DT T μ μ Γ (5) of the electron flux e account for electron mobility, diffusion and thermal diffusion across the magnetic field Copyright © 2012 SciRes. JMP 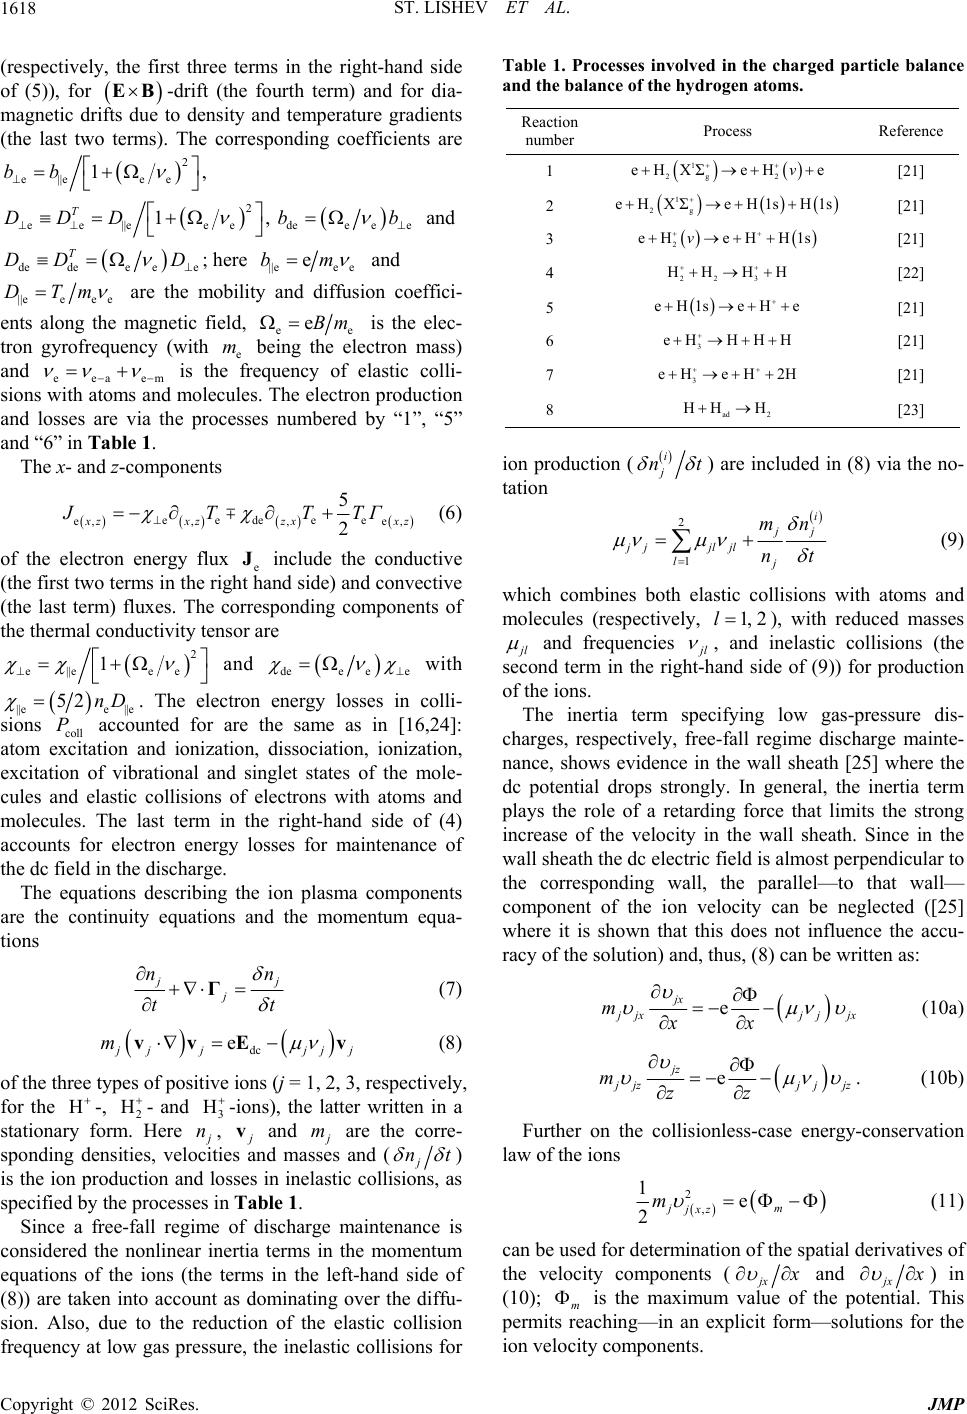 ST. LISHEV ET AL. 1618 (respectively, the first three terms in the right-hand side of (5)), for -drift (the fourth term) and for dia- magnetic drifts due to density and temperature gradients (the last two terms). The corresponding coefficients are EB 2 |e ee 1, e| bb 2 e||ee e 1, TD e DD dee ee bb and e ee D de DD de T ; here ||ee e ebm and ||e DT ee e m are the mobility and diffusion coeffici- ents along the magnetic field, ee is the elec- tron gyrofrequency (with e being the electron mass) and eeaem eBm m is the frequency of elastic colli- sions with atoms and molecules. The electron production and losses are via the processes numbered by “1”, “5” and “6” in Table 1. The x- and z-components ee e, 5 2 eede e,,, x zxz JT μzx xz TTΓ J (6) of the electron energy flux e include the conductive (the first two terms in the right hand side) and convective (the last term) fluxes. The corresponding components of the thermal conductivity tensor are 2 ee e| |e 1 and dee ee with 52 nD P ||ee||e. The electron energy losses in colli- sions coll accounted for are the same as in [16,24]: atom excitation and ionization, dissociation, ionization, excitation of vibrational and singlet states of the mole- cules and elastic collisions of electrons with atoms and molecules. The last term in the right-hand side of (4) accounts for electron energy losses for maintenance of the dc field in the discharge. The equations describing the ion plasma components are the continuity equations and the momentum equa- tions j j j nn tt Γ dc (7) e j jj m vv jjj E v H HH (8) of the three types of positive ions (j = 1, 2, 3, respectively, for the -, 2- and 3-ions), the latter written in a stationary form. Here j n, j v and j m are the corre- sponding densities, velocities and masses and (j nt ) is the ion production and losses in inelastic collisions, as specified by the processes in Table 1. Since a free-fall regime of discharge maintenance is considered the nonlinear inertia terms in the momentum equations of the ions (the terms in the left-hand side of (8)) are taken into account as dominating over the diffu- sion. Also, due to the reduction of the elastic collision frequency at low gas pressure, the inelastic collisions for Table 1. Processes involved in the charged particle balance and the balance of the hydrogen atoms. Reaction number Process Reference 1 1 2g 2 eHXΣeH ev [21] 2 1 2g eHXΣeH1s H1s [21] 3 2 eHeH H1sv 22 3 HH HH [21] 4 [22] 5 eH1seH e 3 eH HHH [21] 6 3 eHeH2H ad 2 HH H [21] 7 [21] 8 [23] i j nt ion production ( ) are included in (8) via the no- tation 2 1 i j j j jjljl lj mn nt 1, 2l (9) which combines both elastic collisions with atoms and molecules (respectively, ), with reduced masses j l and frequencies j l , and inelastic collisions (the second term in the right-hand side of (9)) for production of the ions. The inertia term specifying low gas-pressure dis- charges, respectively, free-fall regime discharge mainte- nance, shows evidence in the wall sheath [25] where the dc potential drops strongly. In general, the inertia term plays the role of a retarding force that limits the strong increase of the velocity in the wall sheath. Since in the wall sheath the dc electric field is almost perpendicular to the corresponding wall, the parallel—to that wall— component of the ion velocity can be neglected ([25] where it is shown that this does not influence the accu- racy of the solution) and, thus, (8) can be written as: e jx j jxj jjx mxx (10a) e jz j jzj jjz mzz . (10b) Further on the collisionless-case energy-conservation law of the ions 2 , 1e 2jm jxz m (11) can be used for determination of the spatial derivatives of the velocity components (jx x x and jx ) in (10); m is the maximum value of the potential. This permits reaching—in an explicit form—solutions for the ion velocity components. Copyright © 2012 SciRes. JMP 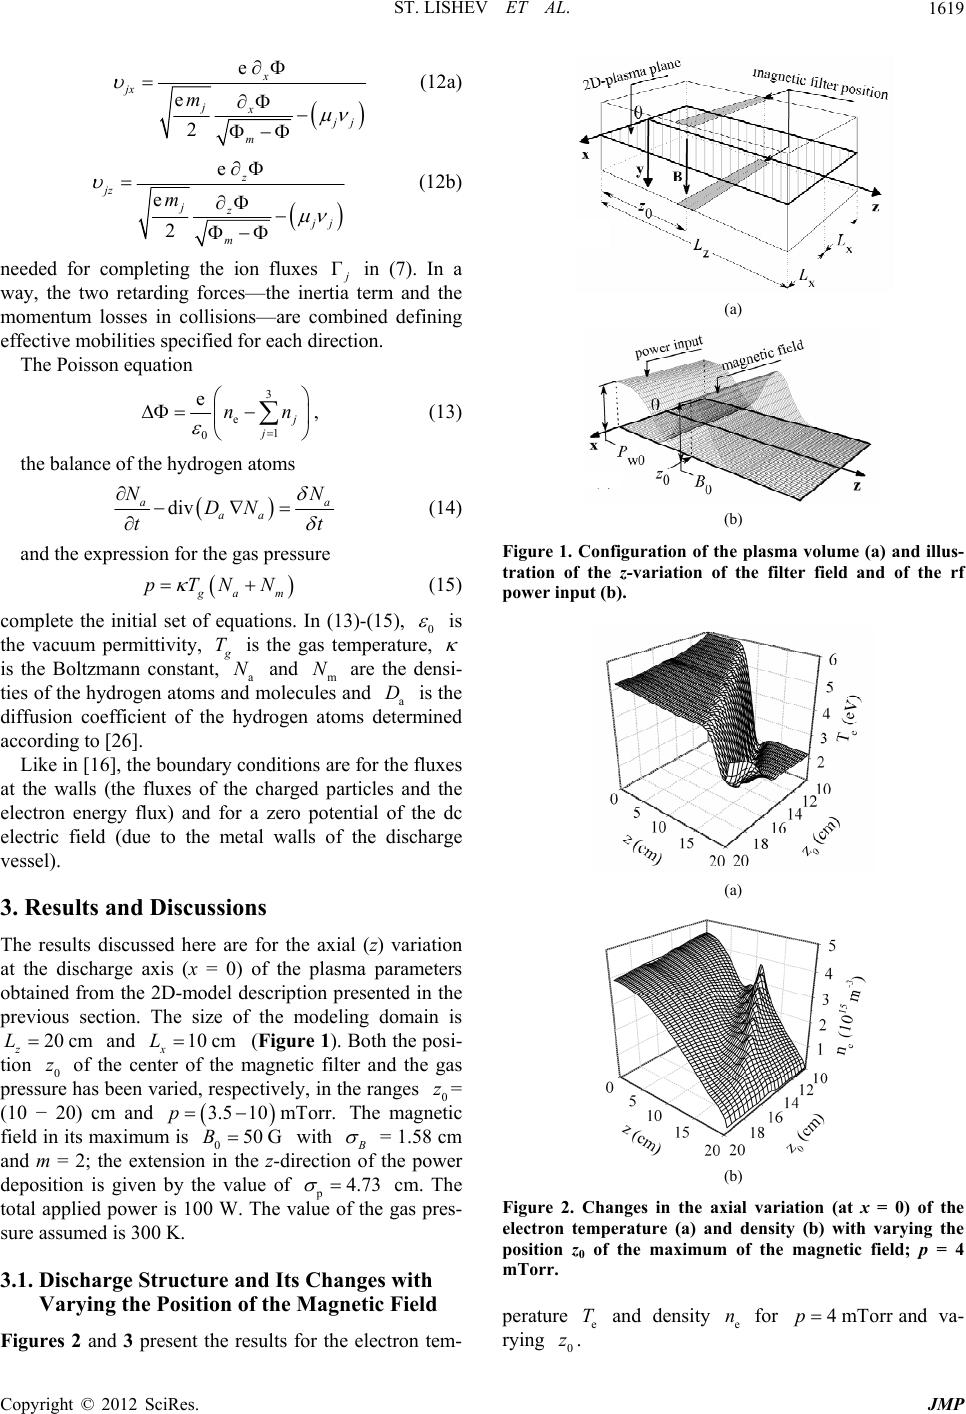 ST. LISHEV ET AL. 1619 e e 2 jx jx x j j m m (12a) e e 2 jz jz z j j m m Γ (12b) needed for completing the ion fluxes j in (7). In a way, the two retarding forces—the inertia term and the momentum losses in collisions—are combined defining effective mobilities specified for each direction. The Poisson equation 3 e 1 0 e j j nn , (13) the balance of the hydrogen atoms div aa aa NN DN tt (14) and the expression for the gas pressure g am NNpT (15) complete the initial set of equations. In (13)-(15), 0 is the vacuum permittivity, g T is the gas temperature, is the Boltzmann constant, a and m are the densi- ties of the hydrogen atoms and molecules and a is the diffusion coefficient of the hydrogen atoms determined according to [26]. N D L10 cmL z 10 mT G N Like in [16], the boundary conditions are for the fluxes at the walls (the fluxes of the charged particles and the electron energy flux) and for a zero potential of the dc electric field (due to the metal walls of the discharge vessel). 3. Results and Discussions The results discussed here are for the axial (z) variation at the discharge axis (x = 0) of the plasma parameters obtained from the 2D-model description presented in the previous section. The size of the modeling domain is z and x (Figure 1). Both the posi- tion 0 of the center of the magnetic filter and the gas pressure has been varied, respectively, in the ranges 0= (10 − 20) cm and The magnetic field in its maximum is 0 with 20 cm z 3.5p B orr. 50 B = 1.58 cm and m = 2; the extension in the z-direction of the power deposition is given by the value of p4.73 cm. The total applied power is 100 W. The value of the gas pres- sure assumed is 300 K. 3.1. Discharge Structure and Its Changes with Varying the Position of the Magnetic Field Figures 2 and 3 present the results for the electron tem- (a) (b) Figure 1. Configuration of the plasma volume (a) and illus- tration of the z-variation of the filter field and of the rf power input (b). (a) (b) Figure 2. Changes in the axial variation (at x = 0) of the electron temperature (a) and density (b) with varying the position z0 of the maximum of the magnetic field; p = 4 mTorr. perature and density for and va- rying . e Te n4mTorrp 0 z Copyright © 2012 SciRes. JMP  ST. LISHEV ET AL. 1620 (a) (b) Figure 3. Comparison of the axial variation (at x = 0) of the electron temperature (a) and density (b) for different values of z0, as marked on the figure; p = 4 mTorr. With the extension of the power deposition region of about and of the magnetic filter region of about B shifting the position 0 of the maximum of the magnetic field between 10 cm and 20 cm displays effects of plasma expansion from the power deposition region into regions without and with an ex- ternal magnetic field. The axial profiles of the plasma parameters (Figures 2 and 3) obtained for 0 P5cmz 4cm,z z 15 cmz show the complete pattern of consecutively ordered re- gions in the discharge: plasma expansion from the power deposition region first in a region without a magnetic field followed by plasma expansion through the magnetic field and ending with expansion again in a region without a magnetic field. Thus, the nonlocality governing the operation of the discharge via the electron-energy and charged-particle fluxes from the power deposition region is the factor determining the axial variations of the elec- tron density and temperature. In the rf power deposition region the electron tem- perature stays almost constant and the electron density slightly decreases. The drastic changes in the axial profiles of e and e are within the full width B of the mag- netic filter: strong drop of , i.e. an effect of electron cooling by the magnetic field, and formation of a maxi- mum of e in the region of the electron magnetization. The physical pattern which stays behind the changes in the spatial distribution of the plasma parameters in the filter region has been described in details in [16]. As a summary it is, as follows. T n4cmz n T e T The strong drop of e in the filter region is due to reduced—by the magnetic field—nonlocality of the elec- tron heating. With the localized rf power applied, the plasma existence outside the region of its deposition is due to the electron energy flux (and charged particle fluxes) from this region. The suppression—by the filter field—of the coeffi- cient e of thermal conductivity, reduces the electron energy flux e and causes the drop of e. Figure 4 shows the axial variation of the contributions of the dif- ferent terms in the stationary form of the electron energy balance (4): The power input in the magnetic filter region via e (in particular, via the conductive flux) is in a balance with the electron energy losses in collisions (mainly inelastic collisions); the contributions of the elastic collisions as well as the energy transfer between the electrons and the dc electric field (the last term in (4)) are negligible. The formation of a minimum of the elec- tron temperature in the filter region (Figures 2 and 3) stems mainly from the thermal (conductive) flux associ- ated with diamagnetic drifts (Figure 5). According to the second term in (6), the axial (z-) decrease of e leads to a thermal flux in the x-direction (Figure 5(b)) which is related to a diamagnetic drift. This causes an increase of e in the x-direction. Consequently, the latter determines a thermal flux related again to a diamagnetic drift, how- ever, now in the z-direction, that results into electron heating behind the filter and, thus, into formation of a groove in the filter region. In addition, the diamagnetic drift in the electron flux ((5) and Figure 5(a)), also con- tribute through the convective flux (the last term in (6)) JT J T T Figure 4. Axial variation (at x = 0) of the contributions to the electron energy balance: Pw (external power deposition), Je and (electron energy losses in collisions presented separately for elastic div collel.coll. inel.coll. P= P+P e P and inelas- tic i P0=10cm, =4mTorr.zp collisions); Copyright © 2012 SciRes. JMP  ST. LISHEV ET AL. 1621 (a) (b) Figure 5. Arrow plot presentation of the electron flux (a) and of the electron energy flux (b) in the (x-z)-plane; 4mTorr.zp e T n T e n T 010 cm, to the increase of behind the filter and, thus, to the formation of the final distribution of the electron tem- perature. The appearance of the maximum of e in the filter region is due to diffusion and thermal diffusion acting together: due to the axial drop of e the thermal diffusion gains in importance forming a forward ther- mal-diffusion flux. On the other hand, the diffusion flux is lowered, due to the magnetic field. This results into an accumulation of electrons in the filter region and a for- mation of the maximum of e there. Since only axial profiles at x = 0 are presented in Figure 2(a) the shift— due to the -drift—of the maximum of in the x-direction shown in [16], is not discussed here. n EB The axial variation of e within the full width B z of the magnetic filter region includes its drop, the forma- tion of its minimum and its slight increase further on (Figure 3). Compared to the structure of the e-profile, the structuring of the e- profile consists of more details. The increase of e in the filter region leads to formation of a minimum in front of the filter. The formation of the main maximum of e in the filter region is preceded by slight maximum and minimum. The strong drop of e after its maximum also starts within the filter region. The minimum of e and the maximum of e, being slightly shifted from the center of the filter, are at the same posi- tion. T n n n n T n 15 cm,z With a magnetic filter located in the vicinity of 0 two regions of plasma expansion without magnetic field show evidence in the axial profiles of e and e (Figures 2 and 3). These are the transition be- tween the regions of the power deposition and the mag- netic filter and the region behind the filter. The pure ef- fects of plasma expansion without magnetic field are: 1) a very slight decrease of the electron temperature related to high nonlocality of the electron heating due to the high value of the thermal conductivity coefficient ||e n T with- out magnetic field (Figures 2(a) and 3(a)), and 2) strong decrease of the electron density (Figures 2(b) and 3(b)). With a position of the magnetic filter close to 0= 10 cm, the plasma expansion from the region of the rf power deposition is directly into the magnetic field, i.e. plasma expansion without magnetic field shows evidence only behind the filter. In this case the drop of the electron temperature in the magnetic field region starts from its value in the power deposition region. z 20 cm,z For a position of the magnetic filter approaching 0 the pattern of plasma expansion without magnetic field (slight decrease of e and strong drop of e) covers almost completely the total volume of the discharge. T n n n n n T n T n T n e Te n Shifting the position of the filter field away from the power deposition region does not influence the axial gra- dient of e T (Figure 3(a)). However, the maximum of e in the filter region becomes lower (Figure 3(b)), since the increase of e in the filter region starts from a lower value of e. The latter is due to the larger exten- sion of the region of plasma expansion outside the power deposition in front of the filter and, respectively, to the stronger drop of there. e The structuring of the axial profiles of the electron temperature and density in the filter region as well as their complete behavior, including the region of plasma expansion before the filter (expansion outside the power deposition region) shown in Figures 2 and 3 agrees qua- litatively very well with the experimental results from probe diagnostics in [19,20]. Not only the minimum of e and the maximum of e in the filter region have been experimentally observed. The entire behavior of the profiles, including their changes with shifting the posi- tion of the magnetic filter, follows the trends outlined in Figure 3: 1) lower e behind the filter and higher maximum of e in the filter region when the filter is located close to the power deposition region; 2) the same gradients of e in the filter region for different positions of the filter; 3) a minimum of e preceding its maxi- mum in the filter region; and 4) the same position of the minimum of and of the maximum of in the filter Copyright © 2012 SciRes. JMP  ST. LISHEV ET AL. 1622 region. As it has been already mentioned, the magnetic filter is a key component in the design of the sources of negative hydrogen ions developed for fusion applications. The role of the filter to cool the electrons, necessary for local production of the negative ions by electron impact with vibrationally excited molecules, has been usually stressed on. However, the results in Figures 2(b) and 3(b) show that the structuring of the axial profile of the plasma den- sity can be also employed in the optimization of the source. Since efficient local production of negative ions requires not only low e T but also comparatively high e, conditions for maximum negative ion production should be looked for by choosing a proper position of the magnetic filter with respect to the power deposition re- gion and the extraction region. n H The axial profile of the densities of the positive ions (Figure 6 where the densities of the molecular 2 and 3 ions are given) show the same structure as that of the electron-density profiles: strong decrease due to plasma expansion outside the power deposition region and formation of a maximum in the filter region, fol- lowed by strong drop after the filter. The structuring in the axial profile of the density of the 3-ions is better pronounced. The value of the maximum of their density in the filter region is even higher than that in the power H H (a) (b) Figure 6. The same as in Figure 2 but for the densities of the -(a) and -(b) ions. + 3 H deposition region. The changes in the axial profiles with varying the position of the filter field are also the same as of the electrons. Since the electron density is compara- tively low, the concentration of the atomic H ions, not shown here, is lower than that of the molecular ions (about 5 times lower). In general, the axial profiles of the ions show that the plasma quasi-neutrality in the different regions of the discharge is ensured by interplay between the concentrations of the three types of positive ions. 3.2. Influence of the Gas Pressure Figure 7 shows results for the influence of the gas pres- sure variation on the axial discharge structure for a given position of the magnetic filter 10 cm.z e T n 4mTorrp 0 The results for the electron temperature (Figure 7(a)) and density (Figure 7(b)) in the power deposition region show the basic trends of the changes in the gas discharge behavior with varying gas pressure: higher electron tem- perature and lower electron density for lower gas pres- sure due to the increased charged particle losses via their fluxes towards the walls. Further on, in the filter region, this trend is kept: the highest and the lowest e are for the lowest value of the gas pressure. (a) (b) Figure 7. Comparison of the axial variation (at of the electron temperature (a) and density (b) for different values of the gas pressure p, as marked on the figure; = 10 cm. =0x 0 z + 2 H Copyright © 2012 SciRes. JMP  ST. LISHEV ET AL. 1623 Only at the very end of the discharge, in the wall sheath at the back wall, due to the larger gradients of e for higher gas pressure, the electron density drops faster when the gas pressure is higher. n nz T n T H z 4mTorrp z 10 cmz 20 cmz T n The more pronounced structuring in the e-profile for higher pressure is related to the reduction—with the pressure increase—of the diffusion coefficient outside the filter region. The gradient of e in the filter region decreases with the gas pressure increase. The positions of the minimum of e and of the maximum of e in the filter region slightly depend on the gas pressure. The lowest value of e in the filter region and behind it and the highest value of e in the filter are for the highest value of the gas pressure. T n The axial profiles of the densities of the positive ions follow the trends of the axial profiles of the electron den- sity (Figure 7(b)). In the entire gas pressure range stud- ied here, the concentrations of the molecular ions are higher than that of the atomic ions. Also in the entire pressure range the structuring of the density profile of the 3-ions is better pronounced and the maximum of their concentration in the filter region exceeds the density value in the power deposition region. 3.3. Axial Profiles of the Potential of the dc Electric Field in the Discharge Figure 8(a) shows the axial profiles of the potential of the dc electric field for different positions 0 of the center of the filter field for whereas the corresponding results obtained for a given value of 0 (0) and varying pressure values are in Figure 8(b). The well pronounced wall sheath at the end of the pro- files (z approaching ), with a strong drop of the dc potential there, shows discharge behavior in a free-fall regime and, thus, the necessity of accounting for the inertia terms in the momentum equations of the posi- tive ions, as it has been done in Section 2. The minimum of e and the maximum of e in the filter region are accompanied with a change in the gradient of the poten- tial of the dc field there, i.e. with a change in the dc elec- tric field. 4. Conclusion Based on an extension of the 2D fluid-plasma model from [16] towards description of the free-fall regime discharge maintenance, developed in the study, results for the spatial structure of low-pressure hydrogen dis- charges with localized rf power deposition and an exter- nal magnetic field positioned outside it are discussed. The characteristics of the remote plasma maintenance in regions without and with an external magnetic field, as determined by the nonlocality of the discharge behavior, (a) (b) Figure 8. Axial profiles (at ) of the potential 0x of the dc electric field: (a) at a given value of the gas pressure 4mTorrp0 and different positions of the center z of the magnetic filter, and (b) for a given value of the center of the magnetic filter 010 cmz and different values of the gas pressure. are outlined. Slight decrease of the electron temperature accompanied with strong drop of the electron density characterizes the plasma expansion in regions without external magnetic field whereas strong drop of the elec- tron temperature accompanied with formation of a max- imum of the electron density characterizes the plasma expansion through an external magnetic field. The analy- sis of the results could be employed in conclusions for optimization of the discharge as a source of volume- produced negative ions regarding use for addional plas- ma heating in big fusion machines (ITER size tokamaks). Electron cooling by the magnetic filter is the result usu- ally stressed on with regards to the requirements for local production of negative hydrogen ions. In addition, the formation of the maximum of the electron density in the filter region can be also used for reaching high density of the negative ions. For achieving this, a proper position of the magnetic filter with respect to both the power deposi- tion region and the extraction region should be chosen. 5. Acknowledgements The work is within the programme of the Bulgarian As- sociation EURATOM/INRNE (task 2.1.1). Copyright © 2012 SciRes. JMP  ST. LISHEV ET AL. 1624 REFERENCES [1] M. J. Kushner, “Plasma Chemistry of He/O2/SiH4 and He/N2O/SiH4 Mixtures for Remote Plasma-Activated Chemical-Vapor Deposition of Silicon Dioxide,” Journal of Applied Physics, Vol. 74, No. 11, 1993, pp. 6538-6553. doi:10.1063/1.355115 [2] D. P. Lymberopoulos and D. J. Economou, “Two-Dimen- sional Self-Consistent Radio Frequency Plasma Simula- tions Relevant to the Gaseous Electronics Conference RF Reference Cell,” Journal of Research of the National In- stitute of Standards and Technology, Vol. 100, No. 4, 1995, pp. 473-494. doi:10.6028/jres.100.036 [3] M. J. Kushner, “Hybrid Modelling of Low Temperature Plasmas for Fundamental Investigations and Equipment Design,” Journal of Physics D: Applied Physics, Vol. 42, 2009, Article ID: 194013. [4] E. Speth, H. D. Falter, P. Franzen, U. Fantz, M. Bandyo- padhyay, S. Christ, A. Encheva, M. Fröschle, D. Holtum, B. Heinemann, W. Kraus, A. Lorenz, Ch. Martens, P. Mc- Neely, S. Obermayer, R. Riedl, R. Süss, A. Tanga, R. Wil- chelm and D. Wünderlich, “Overview of the RF Source Development Programme at IPP Garching,” Nuclear Fu- sion, Vol. 46, No. 6, 2006, pp. S220-S238. doi:10.1088/0029-5515/46/6/S03 [5] Ts. V. Paunska, A. P. Shivarova, Kh. Ts. Tarnev and Ts. V. Tsankov, “2D Model of a Tandem Plasma Source: The Role of the Transport Processes,” AIP Conference Pro- ceedings, Vol. 1097, 1997, pp. 12-21. [6] M. Bacal, “Physics Aspects of Negative Ion Sources,” Nuclear Fusion, Vol. 46, No. 6, 2006, pp. S250-S259. doi:10.1088/0029-5515/46/6/S05 [7] A. J. T. Holmes, “Electron Flow through Transverse Magnetic Fields in Magnetic Multipole Arc Discharges,” Review of Scientific Instruments, Vol. 53, No. 10, 1982, pp. 1517-1522. doi:10.1063/1.1136828 [8] A. J. T. Holmes, “Electron Cooling in Magnetic Multi- pole Arc Discharges,” Review of Scientific Instruments, Vol. 53, No. 10, 1982, pp. 1523-1526. doi:10.1063/1.1136829 [9] F. A. Haas, L. M. Lea and A. J. T. Holmes, “A ‘Hydro- dinamic’, Model of the Negatice-Ion Source,” Journal of Physics D: Applied Physics, Vol. 24, No. 9, 1991, pp. 1541-1550. doi:10.1088/0022-3727/24/9/005 [10] A. J. T. Holmes, R. McAdams, G . Proudfoot, S. Cox, E. Surrey and R. King, “Intense Negative Ion Sources at Culham Laboratory,” Review of Scientific Instruments, Vol. 65, No. 4, 1994, pp. 1153-1158. doi:10.1063/1.1145043 [11] M. Shirai, M. Ogasawara, T. Koishimine and A. Hata- yama, “Theoretical Investigations of Electron Tempera- ture Variation across Magnetic Filter in a Negative Ion Source,” Review of Scientific Instruments, Vol. 67, No. 3, 1996, pp. 1085-1087. doi:10.1063/1.1147230 [12] A. J. T. Holmes, “A One-Dimensional Model of a Nega- tive Ion Source,” Plasma Sources Science and Technol- ogy, Vol. 5, No. 3, 1996, pp. 453-473. doi:10.1088/0963-0252/5/3/014 [13] K. Ohi, H. Naitou, Y. Tauchi and O. Fukumasa, “Obser- vation of the Limit Cycle in Symmetric Plasma Divided by a Magnetic Filter,” Physics of Plasmas, Vol. 8, No. 1, 2001, pp. 23-30. doi:10.1063/1.1329653 [14] T. Mizuno, Y. Kitade, A. Hatayama, T. Sakurabayashi, N. Imai, T. Miroshita and T. Inoue, “Numerical Analysis of Plasma Spatial Uniformity in Negative Ion Sources by a Fluid Model,” Review of Scientific Instruments, Vol. 75, No. 5, 2004, pp. 1760-1763. doi:10.1063/1.1695622 [15] H. Naitou, K. Ohi and O. Fukumasa, “Beam Instability Excited by the Magnetic Filter,” Review of Scientific In- struments, Vol. 71, No. 2, 2000, pp. 875-877. doi:10.1063/1.1150318 [16] St. Kolev, St. Lishev, A. Shivarova, Kh. Tarnev and R. Wilhelm, “Magnetic Filter Operation in Hydrogen Plas- mas,” Plasma Physics and Controlled Fusion, Vol. 49, No. 9, 2007, pp. 1349-1369. doi:10.1088/0741-3335/49/9/001 [17] St. Kolev, G. J. M. Hagelaar and J. P. Boeuf, “Particle-in- Cell with Monte Carlo Collision Modeling of the Electron and Negative Hydrogen Ion Transport across a Localized Transverse Magnetic Field,” Physics of Plasmas, Vol. 16, 2009, Article ID: 042318. [18] G. J. M. Hagelaar and N. Oudini, “Plasma Transport across Magnetic Field Lines in Low-Temperature Plasma Sources,” Plasma Physics and Controlled Fusion, Vol. 53, No. 12, 2011, Article ID: 124032. [19] St. St. Lishev, A. P. Shivarova and Ts. V. Tsankov, “Ex- periments on the Detection of Negative Hydrogen Ions in a Small-Size Tandem Plasma Source,” AIP Conference Proceedings, Vol. 1097, 2009, pp. 127-136. doi:10.1063/1.3112505 [20] St. St. Lishev and A. P. Shivarova, “Laser-Photodetach- ment and Faraday-Cup Measurements in the Expansion Region of a Tandem-Type Plasma Source,” AIP Confer- ence Proceedings, Vol. 1390, 2011, pp. 192-201. [21] R. K. Janev, W. D. Langer, K. Evans Jr. and D. E. Post Jr., “Elementary Processes in Hydrogen-Helium Plasmas,” Springer, Berlin, 1987. [22] R. H. Neynaber and S. M. Trujillo, “Study of H2 + + H2 → H3 + + H Using Merging Beams,” Physical Review, Vol. 167, No. 1, 1968, pp. 63-67. doi:10.1103/PhysRev.167.63 [23] A. Rousseau, A. Granier, G. Gousset and P. Leprince, “Microwave Discharge in H2: Influence of H-Atom Den- sity on the Power Balance,” Journal of Physics D: Ap- plied Physics, Vol. 27, No. 7, 1994, pp. 1412-1422. doi:10.1088/0022-3727/27/7/012 [24] I. Koleva, Ts. Paunska, H. Schlüter, A. Shivarova and Kh. Tarnev, “Surface-Wave Produced Discharges in Hydro- gen: I. Self-Consistent Model of Diffusion-Controlled Discharges,” Plasma Sources Science and Technology, Vol. 12, No. 4, 2003, pp. 597-607. doi:10.1088/0963-0252/12/4/311 [25] St. Lishev, A. Shivarova and Kh. Tarnev, “On the Inertia Term in the Momentum Equation in the Free-Fall Regime of Discharge Maintenance,” Journal of Plasma Physics, Copyright © 2012 SciRes. JMP  ST. LISHEV ET AL. Copyright © 2012 SciRes. JMP 1625 Vol. 77, No. 4, 2011, pp. 469-478. doi:10.1017/S0022377810000620 [26] S. Weissman and E. A. Mason, “Estimation of the Mutual Diffusion Coefficient of Hydrogen Atoms and Mole- cules,” Journal of Chemical Physics, Vol. 36, No. 3, 1962, pp. 794-797. doi:10.1063/1.1732612 |