 Open Journal of Forestry 2012. Vol.2, No.4, 187-199 Published Online October 2012 in SciRes (http://www.SciRP.org/journal/ojf) http://dx.doi.org/10.4236/ojf.2012.24023 Copyright © 2012 SciRes. 187 Nutrient Use Efficiency of Three Fast Growing Hardwood Species across a Resource Gradient Dawn E. Henderson1, Shibu Jose2 1Open Rivers and Wetlands Field Station, Missouri Department of Conservation, Jackson, USA 2Department of Forestry, University of Missouri, Columbia, USA Email: Dawn.Henderson@mdc.mo.gov, joses@missouri.edu Received August 18th, 2012; revised September 23rd, 2012; accepted October 10th, 2012 Attitudes regarding traditional energy sources have shifted toward renewable resources. Specifically, short-rotation woody crop supply systems have become more prevalent for biomass and biofuel produc- tion. However, a number of factors such as environmental and inherent resource availability can limit tree production. Given the intensified demand for wood biomass production, forest and plantation manage- ment practices are focusing on increasing productivity. Fertilizer application, while generally one of the least expensive silvicultural tools, can become costly if application rates exceed nutrient uptake or de- mand of the trees especially if it does not result in additional biomass production. We investigated the ef- fect of water and varying levels of nitrogen application (56, 112, and 224 kg·N·ha–1·yr–1) on nutrient con- tent, resorption efficiency and proficiency, N:P and the relationship with ANPP, as well as leaf- and can- opy-level nutrient use efficiency of nitrogen, phosphorus, and potassium for Populus deltoides, Quercus pagoda, and Platanus occidentalis. P. deltoides and P. occidentalis reached their maximum nitrogen budget with the application of water suggesting old agricultural fields may have sufficient nutrient levels to sustain short-rotation woody crops negating the application of additional nitrogen for these two species. Additionally, for P. deltoides and Q. pagoda application of nitrogen appeared to increase the uptake of phosphorus however, resorption efficiency for these two species were more similar to studies conducted on nutrient poor sites. Nutrient resorption proficiency for all three nutrients and all three species were at levels below the highest rates of nitrogen application. These findings suggest maximum biomass produc- tion may not necessarily be tied to maximum nutrient application. Keywords: Nutrient Use Efficiency; Resorption; N:P; Biomass Production Introduction Changes in attitudes about energy production have shifted interest from traditional energy sources and techniques toward renewable resources in recent years (Dickmann, 2006). One target of the focus on renewable energy is fast growing hard- wood species with the concentration placed on species that could be harvested on rotations ranging from as little as six (Tuskan, 1998) or up to 15 years (Dickmann, 2006). The con- cept of short-rotation woody crop (SRWC) supply systems were first formalized nearly 50 years ago (Tuskan, 1998). In some areas of the United States, forest management practices that had previously focused on extensive management for fiber production have shifted to intensive management for biomass and biofuel production using SRWC systems (Geyer & Melichar, 1986; Coyle & Coleman, 2005; Augusto et al., 2009). Techniques for increasing production potential of SRWC suchas high stocking rates, hybrid selection/development, and intensive stand management have become industry standards (Dickmann, 2006). However, our knowledge about fertilizer uptake patterns and use by these fast growing species for pro- duction purposes is limited at best. Tree production can be limited by a number of factors such as light (Wang et al., 1991; Ellsworth & Reich, 1992; Jose & Gillespie, 1997; Jokela & Martin, 2000; Henderson & Jose, 2005), water (Lockaby et al., 1997; Albaugh et al., 1998; King et al., 1999; Allen et al., 2002; Albaugh et al., 2004), and growing space (Cochran et al., 1991; Schubert et al., 2004; Lockhart et al., 2006; Clark et al., 2008; Curtis, 2008) or en- hanced by practices such as fertilization (Singh, 1998; Will et al., 2002; Bekele et al., 2003; Allen et al., 2004; Samuelson et al., 2004a), or irrigation (Allen et al., 2005; Stape et al., 2008; Zalesny et al., 2007; Zalesny et al., 2008). Most frequently, biomass accumulation and stand development are restricted to inherent resource availability within a site or by community composition (Wang et al., 1995; Wang et al., 1996; Smith et al., 1998; Vogel & Gower, 1998; Blanco et al., 2006; Schilling & Lockaby, 2006; Yan et al., 2006). As a counter to nutrient losses, plants have mechanisms to minimize nutrient losses such as nutrient resorption or retrans- location (Vitousek, 1982; Berendse & Aerts, 1987; Aerts & Be- rendse, 1988; Aerts, 1996; Aerts, 1997; Wright & Westoby, 2001). Although it would seem somewhat intuitive, the nature of, and driving force behind, nutrient availability, uptake, and resorption are not well understood as is indicated by inconsis- tent findings between studies. Some studies indicate nutrient limitation should lead to higher rates of resorption efficiency and proficiency (actual nutrient level within leaf litter; a reflec- tion of soil resource) and that low rates of resorption could contribute to nutrient limitations, reduced biomass production, and survival (Boerner, 1984; Killingbeck, 1984; Killingbeck, 1986; Killingbeck, 1993; Killingbeck, 1996). Other studies suggest higher leaf level nutrient status (Lathja, 1987) or re-  D. E. HENDERSON, S. JOSE source availability (Xu & Timmer, 1999) is linked to higher or lower (Aerts & de Caluwe, 1994; Vitousek, 1998) resorption ratios or may have no effect on the ratios (Chapin & Kedrowski, 1983; Birk & Vitousek, 1986; Aerts, 1996; Wright & Westoby, 2003; Yuan & Chen, 2010). However, it appears that reaction to and indications of nutrient use can vary in response to site fertility (Bloom et al., 1985; Wright & Westoby, 2003), water availability (Boerner, 1985; del Arco et al., 1991; Escudero et al., 1992, Wright & Westoby, 2003), soil chemistry (del Arco et al., 1991; Bridgham et al., 1995; Choi et al., 2005; Campo et al., 2007) as well as between members of the same species (Birk & Vitousek, 1986; Aerts & de Caluwe, 1994; Bungart & Hüttl 2004). Nutrient resorption proficiency (NRP), has been de- scribed as a way to measure the success of nutrient conserva- tion and to reflect environmental constraints of site conditions (Killingbeck, 1996), particularly for nitrogen (N) and phospho- rus (P). NRP can be described as the realized resorption or the quantity of nutrient remaining in senesced tissue after retrans- location. NRP trends between species (deciduous versus ever- greens) across varying levels of environmental limitations (nu- trients and water) appear to influence processes such as nutrient uptake and productivity (Killingbeck, 1996). Killingbeck, (1996) further pointed out that the variation found within his results could be attributed to forest stand conditions as well as the relationship between inter-nutrient dependence (i.e. N and P levels). Given the intensified demand for SRWC worldwide and in- terest in increasing wood biomass production, determining ways to enhance yield is paramount for plantation development (Chang, 2003; Bungart & Hüttl, 2004; Coyle & Coleman, 2005; DesRochers et al., 2006). Intensive culture of hardwoods is often accompanied by site preparation, competition control, genetically improved planting stock, and selection of fast- growing species to increase the production potential (Fang et al., 1999; Chang, 2001; Samuelson et al., 2001; Bungart & Hüttl, 2004; Lee & Jose, 2005; DesRochers et al., 2006). By far the most advantageous of the silvicultural methods used to increase production is fertilization (Allen, 1987). Fertilizer application, while generally one of the least expensive silvicultural tools, can become more costly than necessary if application rates exceed nutrient uptake or demand of the trees, or does not result in additional biomass production. When coupled with irrigation, fertilization has the capability to increase production on infer- tile sites, in areas where rainfall is limited, or on soils that lack necessary water holding capacity (Axelsson & Axelsson, 1986; Lockaby et al., 1997; King et al., 1999; Bekele et al., 2003, Coyle & Coleman 2005). Many studies have indicated that growth response to differing fertilization rates for economically important tree species are species specific and/or vary with site resource levels (Wienand & Stock, 1995; Jokela et al., 2004; Prietzel et al., 2004; Sword Sayer et al., 2004; Ladanai et al., 2006; Saarsalmi et al., 2006; Moscatelli et al., 2008). However, questions remain regarding the extent that production could be enhanced by increasing resource availability, and at what levels additional resources become excessive or limit growth. In the present study, we investigated the effect of water and nutrient availability, on nutrient content (kg·ha–1), resorption efficiency (%), resorption proficiency (g nutrient/kg leaf litter (senesced tissue)), and leaf- and canopy-level nutrient use effi- ciency of nitrogen (N), phosphorus (P), and potassium (K) for Populus deltoidesBartr. (cottonwood), Quercus pagodaRaf. (cherrybark oak, previously Quercus falcata Ell.) and Platanus occidentalis L. (sycamore), (nomenclature follows USDA, NRCS Plants Database 2009). Our objectives were to: 1) de- termine the aboveground nutrient content for each nutrient for each species across a nitrogen/water gradient; specifically, what rates of fertilization are actually captured and utilized by the canopy to influence production? 2) quantify the nutrient resorp- tion efficiency and proficiency of N, P, and K for all three spe- cies; specifically does an increase in foliar nutrient content result in increased biomass production? 3) determine the nutri- ent use efficiency on a leaf- and canopy-level basis for the three nutrients and species. In particular, is nutrient use efficiency decreased in similar magnitudes as the application of fertiliza- tion? Are the amounts of fertilizer that are taken up reflected in the magnitude of resorption? We hypothesized that nutrient levels, budget, efficiencies, and ratios would peak well below the maximum level of nitrogen supplied. Methods Study Site Our study was conducted in a fertigation trial established on an abandoned agricultural field (30.50'N, 87.11'W) in Santa Rosa County, Florida, USA. The climate is temperate with mild winters and hot, humid summers. Average rainfall is 1700 mm, with average minimum and maximum temperatures of 10 and 27˚C, respectively (NOAA, 2003). The soil is characterized as a well-drained, Redbay sandy loam (a fine-loamy, siliceous, thermic, RhodicPaleudult) formed in thick beds of loamy ma- rine deposits with an average water table depth of 1.8 m (Lee & Jose, 2003). Soil variables calculated after this study ended include pH (5.8, down from the original pH of 6.0), cation ex- change capacity (4 CEC meq/100 g), and soil nutrient levels of phosphorus (34 and 55), potassium (92 and 122), calcium (599), and magnesium (179 and 146) (kg·ha–1). To our knowledge, nitrogen levels were not measured prior to the study, but were expected to be relatively high given the site was an abandoned agricultural field. Nitrogen levels measured within the control plots during a companion study indicated total inorganic nitro- gen ranged from near 2.5 to 4.5 kg·ha–1 (Lee & Jose 2006). Treatment plots of P. deltoides and P. occidentalis consisted of 40 trees plot–1 and Q. pagoda contained 16 trees plot–1; (al- though the Q. pagoda plots were the smallest of the three spe- cies, and need to be treated with caution, the results reflect data collected within the study) Figure 1. All treatment plots were planted at 2.13 m × 3.35 m spacing (1400 trees ha–1). The study design was a randomized complete block (RCB) with four rep- lications of each treatment. Site preparation included disking and subsoiling to facilitate planting. Fertilization at the time of planting included broadcast application of diammonium phos- phate, dolomitic lime, potash, and a micronutrient mixture. These treatments added elemental calcium, nitrogen, phospho- rus, magnesium, zinc, copper, and manganese (1009, 50, 56, 126, 3, 3, and 2 kg·ha–1 respectively, Greg Leach, personal communication). Soil pH was adjusted to 6.0, with 3363 kg·ha–1 of dolomitic lime, based on recommendations from a similar trial at North Carolina State University Research Coop- erative (Coleman et al., 2004; Samuelson et al., 2004a; Sam- uelson et al., 2004b). Herbaceous weed control consisted of combinations of Copyright © 2012 SciRes. 188  D. E. HENDERSON, S. JOSE Copyright © 2012 SciRes. 189 REP 1REP 2REP 3REP 4 IRRIGATION ZONE 4 Irrigation Only IRRIGATION ZONE 1 56 kg N IRRIGATION ZONE 2 112 kg N IRRIGATION ZONE 3 224kg N REP 1 REP 2 REP 2REP 3REP 4 REP 1REP 3REP 4 Control Control Control Control IRRIGATION CENTER UNDERGROUND WATER PIPE BUD DIAMOND ROAD BUD DIAMOND ROAD O A K O A K O A K O A K O A K O A K O A K O A K O A K O A K O A K O A K O A K O A K O A K O A K O A K O A K O A K O A K Figure 1. Study layout showing planting schematic and treatment applications. For this study, only P. deltoides (cottonwood), Q. pagoda (cherrybark oak re- ferred to in graphic as oak), and P. occidentalis were studied. Image reproduced from first year growth of Hardwoods under fertigationin western Florida. Unpublished international paper internal report 1996. Gregory N. Leach and Homer H. Gresham, southern forest resources technical services, western Florida region, Cantonment, Florida. chemical (sulfometuron methyl and glyphosate) and mechanical (mowing and manual pulling) treatments during the first and second growing seasons. Installation of the nutrient supply system and planting of trees occurred during spring 1995. The irrigation system operated for approximately two hours each day (on average 390 mm water Greg Leach, personal commu- nication) during the growing season (May-Sep.) with nitrogen application occurring two to eight minutes each day creating the nitrogen gradient across the treatments (Lee & Jose, 2003, 2006). Five treatments were established including control (CON), irrigation only (IRR), and three nutrient supplements supplied through irrigation including 56, 112, and 224 kg N·ha–1·yr–1 (referred to as IRR + 56, IRR + 112, and IRR + 224, respectively). Data Collection Leaf samples were collected from upper one-third (sun leaves) and lower one-third (shade leaves) of the canopy on a monthly basis during the eighth growing season. Samples were collected within each plot for each species, bagged, labeled, and placed in a cooler for transport. Leaf area (cm2) was determined by passing each leaf through a Li-Cor LI-3300 Leaf Area Meter and then weighed to the nearest 0.01 g. Specific leaf weight (SLW) was determined by dividing the foliar weight by area. Samples of bark, branches, and wood were collected in mid- growing season. Ten trees per treatment, per each species were randomly selected for woody component (bark, branch, and bole) nutrient analysis and combined, to obtain a treatment level sample for nutrient content for each tissue type. Bark sample removal was completed by surficially scraping, cutting, breaking, or peeling samples from the trees of each species. Collection of branches from the same randomly selected trees, were gathered by pruning newly formed branches from the lower and upper third of the canopy for each species. Collection of bole material consisted of coring each randomly selected tree at DBH (diameter at breast height ~1.5 m above ground level) with an increment borer. Foliar and woody samples were dried at 70˚C for 48 hours, ground to a fine powder and analyzed for total nitrogen (N) (Kjeldahl), phosphorus (P) (EPA Method 200.7—ICP (Inductively Coupled Plasma) Spectrophotometer), and potassium (K) at the University of Florida Analytical Re- search Laboratory (ARL). For biomass calculations used with nutrient data, diameter at breast height (DBH) and height of all trees in each plot within each treatment were measured yearly. Standing biomass (Mg·ha–1), ANPP (Mg·ha–1·yr–1, excluding herbivory or litter of branches, bark, or fruits), LAI (m2 m–2, calculated by multiply- ing weight (g) and area (m2) of leaf litter collected in litter trays by SLA (m2·g–1) of randomly selected canopy leaves), for year eight. Whole-tree allometric equations developed by Shelton et al., (1982) were used to calculate volume and aboveground woody biomass for P. deltoides. Their equations for P. del- toides were developed from trees of comparable age range, and soil type, grown in areas with similar longitude, latitude, and climate as this study. Standing woody biomass consisted of all woody components. Foliage biomass was determined by sum- ming the weight of annual litter fall collected monthly (May to  D. E. HENDERSON, S. JOSE January) from five litter traps (0.5 m2) for P. deltoides. Biomass equations developed by Schlaegel & Kennedy, (1986) were used to calculate volume and aboveground woody biomass for both Q. pagoda and P. occidentalis. The original Schlaegel & Kennedy, (1986) equations used diameter meas- ured at approximately 15 cm above ground level. All Q. pagoda and P. occidentalis DBH data were corrected to reflect the dbh measurements of the equations at 15 cm height above ground level, by using regression equations developed from sampling 100 trees per species measured at the appropriate height (data not shown, R2 = 0.97 and 0.93 respectively for Q. pagoda and P. occidentalis). Foliage biomass was determined similarly as above from five and two litter traps (0.5 m2), for P. occidentalis and Q. pagoda respectively in each plot. To determine nutrient use on a leaf and canopy level, pro- jected LAI, was calculated from the weight (g) and area (m2) of the leaf litter trays and SLA (scaled to the canopy level, m2·g–1) for each species within each treatment. Care was taken to en- sure only leaf litter from the species within the plot was proc- essed. If litter from other species fell or were blown into the tray, it was removed prior to collection. Nutrient content of each species for each aboveground com- ponent was calculated for N, P, and K using the equations used for the purpose of biomass production estimation developed by Shelton et al., (1982) and Schlaegel& Kennedy, (1986) and for the calculation of the nutrient concentrations for woody and foliar components (Equation (1)). The RE was calculated by determining the difference between peak nutrient concentration of green leaves and those found in fresh leaf litter (Equation (2)). Leaf level nutrient use efficiency LNUE was calculated using leaf level nutrient content and leaf litter resorption rates (Equa- tion (3)). Canopy nutrient use efficiency (CNUE) was calculated using aboveground biomass produced in year eight divided by the peak production (peak foliar production was determined from monthly leaf litter collection), and nutrient content of green leaves for each species in each treatment (Equation (4)). Resorption proficiency was reported as the nutrient content in senesced leaves (g·N·kg–1 litter, i.e. realized resorption). 1) Nutrient content (kg·ha–1) = kg·ha–1(biomass) × kg·kg–1(nutrient ) 2) Resorption (%) = (foliar(live) – foliar(litter)/foliar(live)) × 100 3) Leaf nutrient use efficiency (g·g–1) =1 /((g·g–1) × (1 – re- sorption)) 4) Canopy nutrient use efficiency (Mg·kg–1) = Mg/(kg foliage × kg·kg–1(nutrient)) Analysis All the measured and calculated variables were compared among treatments using analysis of variance (ANOVA) (SAS Institute Inc., 2001) with treatment assigned as a random effect in the model. If significant differences (α = 0.05) among treat- ments were revealed, multiple pairwise comparisons of means were performed using Tukey’s multiple mean test for mean separation and determining significance. Linear regression was used to analyze the relationships between ANPP and N:P. It has been suggested that as soil nitrogen levels increase, uptake of nitrogen can be limited by the availability of other nutrients (Aber et al., 1989). Furthermore, because of results from stud- ies like Pastor & Bridgham, (1999) and Bridgham et al., (1995) we hypothesized that the highest rate of nitrogen application would be far greater than the trees could utilize. As such, curvi- linear functions were chosen a priori to ANOVA analysis and in accordance with our hypothesis that nutrient use variable responses were likely to plateau well below the maximum level of N supplied by the treatments. Results Nutrient Con te nt The N content of aboveground components (bole, branch, bark and foliage: 4.0, 17.1, 1.8, and 217.7 kg·ha–1, respectively) and the total N (240.5 kg·ha–1) of the combined aboveground biomass in P. deltoides were significantly lower in the control (CON) treatment compared to that of the IRR and IRR + Fer- tilizer treatments (IRR + 56, IRR + 112, and IRR + 224). IRR and IRR + 56, IRR + 112, and IRR + 224 treatments had simi- lar total N content (502.9, 415.8, 422.1, and 439.0 kg·ha–1, re- spectively, Table 1). In other words, N content for year eight reached its highest at a level below the maximum N application (502.9 kg·ha–1 in the IRR treatment). The overall trend for each component (branch, bark, foliage) or total tree was to reach the highest N content in the IRR treatment with significant differ- ences found among the CON and all IRR treatments. The only exception to this trend was for the bole content, which reached its peak at the IRR + 56 treatment (10.5 kg·ha–1, Table 1) which was not significantly different from the other IRR or IRR + Fertilizer treatments. Branch, foliar, and total tree P nutrient budget for P. del- toides exhibited similar trends as N by reaching its peak in the IRR treatment (11.9, 37.6, and 50.6 kg·ha–1, respectively) with significant differences found among treatments for each com- ponent. Bole and bark P content reached their peaks in the IRR + 224, which was significantly different from all other treat- ments, and IRR + 122 treatments (1.4 and 0.3 kg·ha–1, respec- tively, Table 1). Significant differences were found among the CON and all other IRR treatments. P. deltoides branch, bark and total tree components for K reached its maximum content in the IRR treatment, (70.6, 1.2, and 353.0 kg·ha–1, respectively, Table 1), and were significantly different from the CON treat- ment. Maximum K content for the bole and foliar components were found in the IRR + 56 and IRR + 224 treatments (29.9 and 267.8 kg·ha–1, respectively) with significant differences found among treatments. Maximum N content for bole, branch and bark for Q. pagoda (6.3, 8.9, and 4.8 kg·ha–1, respectively) was found in the IRR + 224 treatment and significant differences were found among treatments for these components (Table 1). Maximum N for the foliar and total tree occurred in the IRR + 112 treatment (367.1 and 382.2 kg·ha–1 , respectively) with significant differences found only between the control and IRR + 112 treatments. For P, the bole and bark components were greatest in the IRR + 224 treatment (0.3 and 0.2 kg·ha–1, respectively) while branch and foliar components reached the highest levels in the IRR + 56 and IRR + 112 treatments (0.8 and 22.7 kg·ha–1, respectively). Significant differences for the bole component were found among the CON and IRR + 224 treatments and among treat- ments for the branch component. The total tree peak P was found in the IRR + 122 treatment, and was likely influenced by the foliar P content level (23.7 kg·ha–1), although no significant differences were found among treatments. For Q. pagoda, the highest K for bole, branch, and bark in the IRR + 224 treatment (5.9, 6.6, and 1.7 kg·ha–1, respectively). Foliar and total tree peak K nutrient content was found in the IRR + 112 treatment Copyright © 2012 SciRes. 190 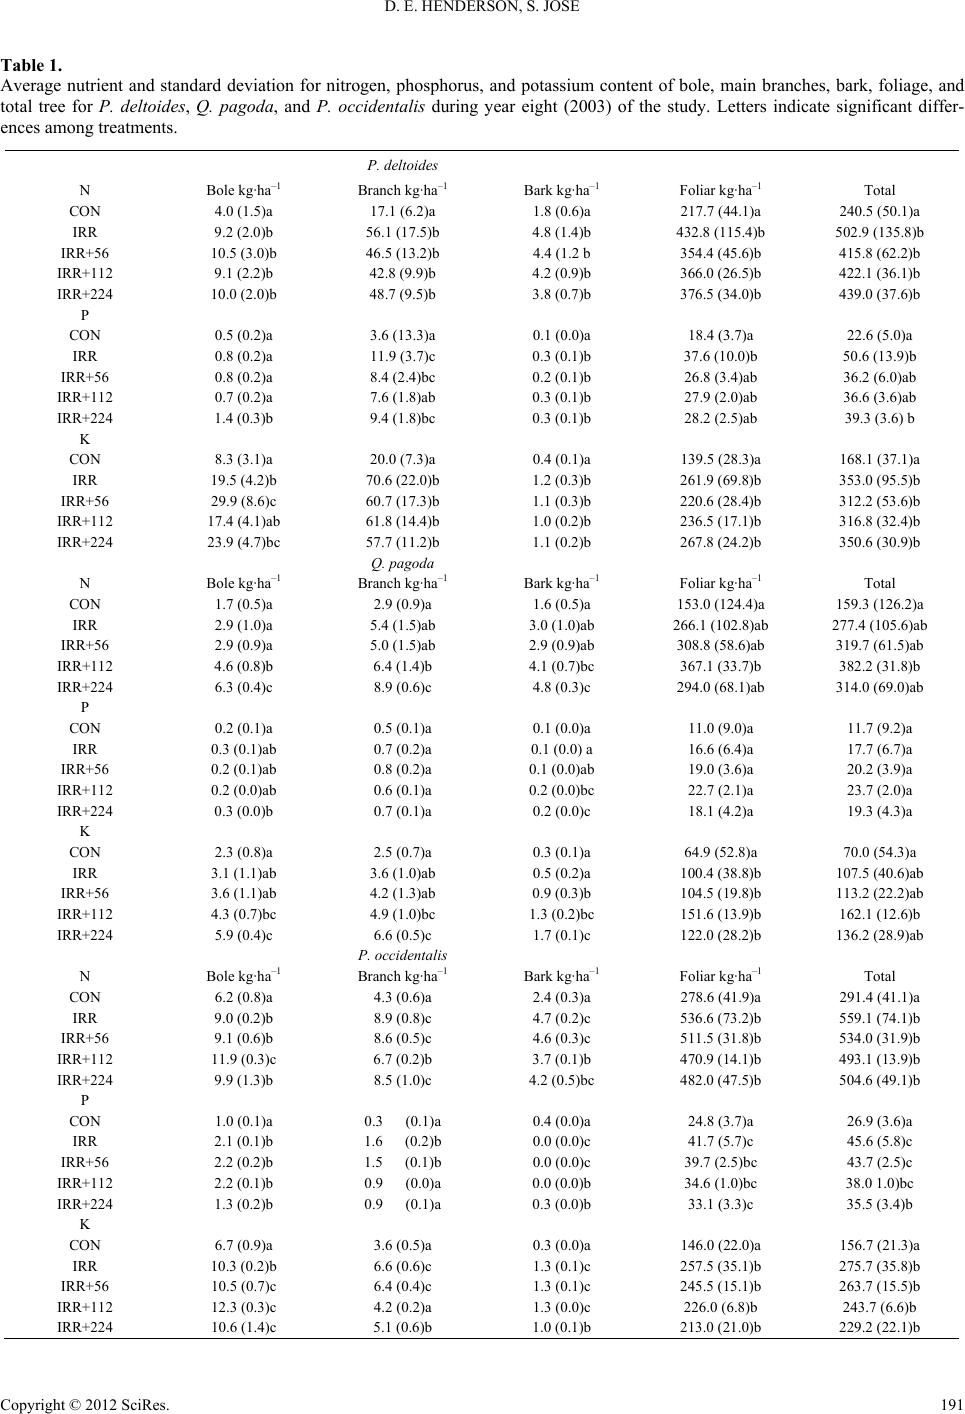 D. E. HENDERSON, S. JOSE Copyright © 2012 SciRes. 191 Table 1. Average nutrient and standard deviation for nitrogen, phosphorus, and potassium content of bole, main branches, bark, foliage, and total tree for P. deltoides, Q. pagoda, and P. occidentalis during year eight (2003) of the study. Letters indicate significant differ- ences among treatments. P. deltoides N Bole kg·ha–1 Branch kg·ha–1 Bark kg·ha–1 Foliar kg·ha–1 Total CON 4.0 (1.5)a 17.1 (6.2)a 1.8 (0.6)a 217.7 (44.1)a 240.5 (50.1)a IRR 9.2 (2.0)b 56.1 (17.5)b 4.8 (1.4)b 432.8 (115.4)b 502.9 (135.8)b IRR+56 10.5 (3.0)b 46.5 (13.2)b 4.4 (1.2 b 354.4 (45.6)b 415.8 (62.2)b IRR+112 9.1 (2.2)b 42.8 (9.9)b 4.2 (0.9)b 366.0 (26.5)b 422.1 (36.1)b IRR+224 10.0 (2.0)b 48.7 (9.5)b 3.8 (0.7)b 376.5 (34.0)b 439.0 (37.6)b P CON 0.5 (0.2)a 3.6 (13.3)a 0.1 (0.0)a 18.4 (3.7)a 22.6 (5.0)a IRR 0.8 (0.2)a 11.9 (3.7)c 0.3 (0.1)b 37.6 (10.0)b 50.6 (13.9)b IRR+56 0.8 (0.2)a 8.4 (2.4)bc 0.2 (0.1)b 26.8 (3.4)ab 36.2 (6.0)ab IRR+112 0.7 (0.2)a 7.6 (1.8)ab 0.3 (0.1)b 27.9 (2.0)ab 36.6 (3.6)ab IRR+224 1.4 (0.3)b 9.4 (1.8)bc 0.3 (0.1)b 28.2 (2.5)ab 39.3 (3.6) b K CON 8.3 (3.1)a 20.0 (7.3)a 0.4 (0.1)a 139.5 (28.3)a 168.1 (37.1)a IRR 19.5 (4.2)b 70.6 (22.0)b 1.2 (0.3)b 261.9 (69.8)b 353.0 (95.5)b IRR+56 29.9 (8.6)c 60.7 (17.3)b 1.1 (0.3)b 220.6 (28.4)b 312.2 (53.6)b IRR+112 17.4 (4.1)ab 61.8 (14.4)b 1.0 (0.2)b 236.5 (17.1)b 316.8 (32.4)b IRR+224 23.9 (4.7)bc 57.7 (11.2)b 1.1 (0.2)b 267.8 (24.2)b 350.6 (30.9)b Q. pagoda N Bole kg·ha–1 Branch kg·ha–1 Bark kg·ha–1 Foliar kg·ha–1 Total CON 1.7 (0.5)a 2.9 (0.9)a 1.6 (0.5)a 153.0 (124.4)a 159.3 (126.2)a IRR 2.9 (1.0)a 5.4 (1.5)ab 3.0 (1.0)ab 266.1 (102.8)ab 277.4 (105.6)ab IRR+56 2.9 (0.9)a 5.0 (1.5)ab 2.9 (0.9)ab 308.8 (58.6)ab 319.7 (61.5)ab IRR+112 4.6 (0.8)b 6.4 (1.4)b 4.1 (0.7)bc 367.1 (33.7)b 382.2 (31.8)b IRR+224 6.3 (0.4)c 8.9 (0.6)c 4.8 (0.3)c 294.0 (68.1)ab 314.0 (69.0)ab P CON 0.2 (0.1)a 0.5 (0.1)a 0.1 (0.0)a 11.0 (9.0)a 11.7 (9.2)a IRR 0.3 (0.1)ab 0.7 (0.2)a 0.1 (0.0) a 16.6 (6.4)a 17.7 (6.7)a IRR+56 0.2 (0.1)ab 0.8 (0.2)a 0.1 (0.0)ab 19.0 (3.6)a 20.2 (3.9)a IRR+112 0.2 (0.0)ab 0.6 (0.1)a 0.2 (0.0)bc 22.7 (2.1)a 23.7 (2.0)a IRR+224 0.3 (0.0)b 0.7 (0.1)a 0.2 (0.0)c 18.1 (4.2)a 19.3 (4.3)a K CON 2.3 (0.8)a 2.5 (0.7)a 0.3 (0.1)a 64.9 (52.8)a 70.0 (54.3)a IRR 3.1 (1.1)ab 3.6 (1.0)ab 0.5 (0.2)a 100.4 (38.8)b 107.5 (40.6)ab IRR+56 3.6 (1.1)ab 4.2 (1.3)ab 0.9 (0.3)b 104.5 (19.8)b 113.2 (22.2)ab IRR+112 4.3 (0.7)bc 4.9 (1.0)bc 1.3 (0.2)bc 151.6 (13.9)b 162.1 (12.6)b IRR+224 5.9 (0.4)c 6.6 (0.5)c 1.7 (0.1)c 122.0 (28.2)b 136.2 (28.9)ab P. occide ntalis N Bole kg·ha–1 Branch kg·ha–1 Bark kg·ha–1 Foliar kg·ha–1 Total CON 6.2 (0.8)a 4.3 (0.6)a 2.4 (0.3)a 278.6 (41.9)a 291.4 (41.1)a IRR 9.0 (0.2)b 8.9 (0.8)c 4.7 (0.2)c 536.6 (73.2)b 559.1 (74.1)b IRR+56 9.1 (0.6)b 8.6 (0.5)c 4.6 (0.3)c 511.5 (31.8)b 534.0 (31.9)b IRR+112 11.9 (0.3)c 6.7 (0.2)b 3.7 (0.1)b 470.9 (14.1)b 493.1 (13.9)b IRR+224 9.9 (1.3)b 8.5 (1.0)c 4.2 (0.5)bc 482.0 (47.5)b 504.6 (49.1)b P CON 1.0 (0.1)a 0.3 (0.1)a 0.4 (0.0)a 24.8 (3.7)a 26.9 (3.6)a IRR 2.1 (0.1)b 1.6 (0.2)b 0.0 (0.0)c 41.7 (5.7)c 45.6 (5.8)c IRR+56 2.2 (0.2)b 1.5 (0.1)b 0.0 (0.0)c 39.7 (2.5)bc 43.7 (2.5)c IRR+112 2.2 (0.1)b 0.9 (0.0)a 0.0 (0.0)b 34.6 (1.0)bc 38.0 1.0)bc IRR+224 1.3 (0.2)b 0.9 (0.1)a 0.3 (0.0)b 33.1 (3.3)c 35.5 (3.4)b K CON 6.7 (0.9)a 3.6 (0.5)a 0.3 (0.0)a 146.0 (22.0)a 156.7 (21.3)a IRR 10.3 (0.2)b 6.6 (0.6)c 1.3 (0.1)c 257.5 (35.1)b 275.7 (35.8)b IRR+56 10.5 (0.7)c 6.4 (0.4)c 1.3 (0.1)c 245.5 (15.1)b 263.7 (15.5)b IRR+112 12.3 (0.3)c 4.2 (0.2)a 1.3 (0.0)c 226.0 (6.8)b 243.7 (6.6)b IRR+224 10.6 (1.4)c 5.1 (0.6)b 1.0 (0.1)b 213.0 (21.0)b 229.2 (22.1)b 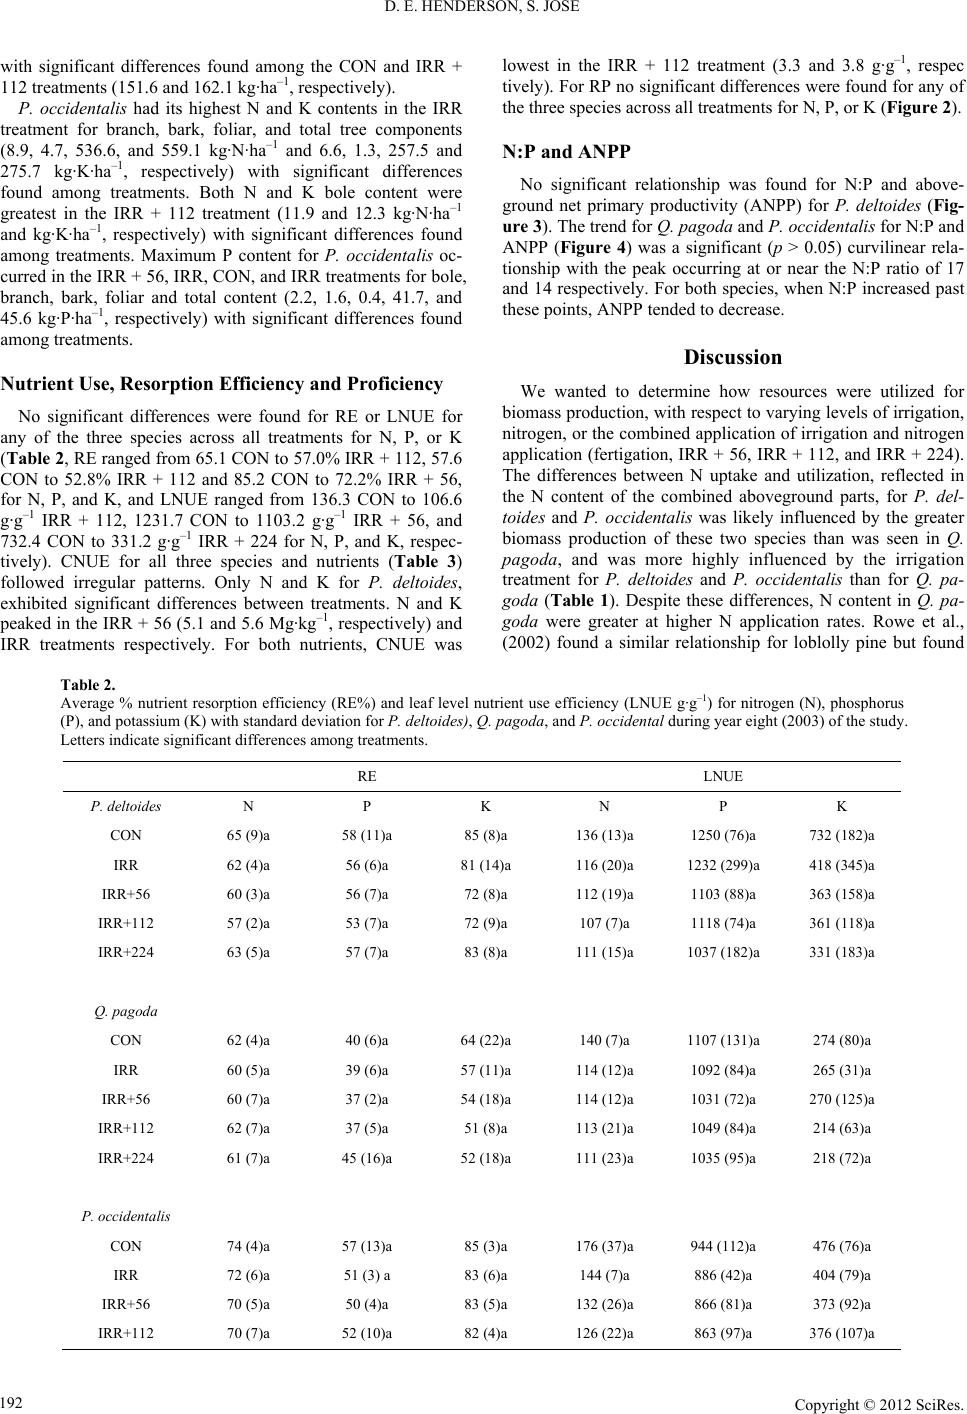 D. E. HENDERSON, S. JOSE with significant differences found among the CON and IRR + 112 treatments (151.6 and 162.1 kg·ha–1, respectively). P. occidentalis had its highest N and K contents in the IRR treatment for branch, bark, foliar, and total tree components (8.9, 4.7, 536.6, and 559.1 kg·N·ha–1 and 6.6, 1.3, 257.5 and 275.7 kg·K·ha–1, respectively) with significant differences found among treatments. Both N and K bole content were greatest in the IRR + 112 treatment (11.9 and 12.3 kg·N·ha–1 and kg·K·ha–1, respectively) with significant differences found among treatments. Maximum P content for P. occidentalis oc- curred in the IRR + 56, IRR, CON, and IRR treatments for bole, branch, bark, foliar and total content (2.2, 1.6, 0.4, 41.7, and 45.6 kg·P·ha–1, respectively) with significant differences found among treatments. Nutrient Us e, Resorption Effici en cy an d P r o f ic ie ncy No significant differences were found for RE or LNUE for any of the three species across all treatments for N, P, or K (Table 2, RE ranged from 65.1 CON to 57.0% IRR + 112, 57.6 CON to 52.8% IRR + 112 and 85.2 CON to 72.2% IRR + 56, for N, P, and K, and LNUE ranged from 136.3 CON to 106.6 g·g–1 IRR + 112, 1231.7 CON to 1103.2 g·g–1 IRR + 56, and 732.4 CON to 331.2 g·g–1 IRR + 224 for N, P, and K, respec- tively). CNUE for all three species and nutrients (Table 3) followed irregular patterns. Only N and K for P. deltoides, exhibited significant differences between treatments. N and K peaked in the IRR + 56 (5.1 and 5.6 Mg·kg–1, respectively) and IRR treatments respectively. For both nutrients, CNUE was lowest in the IRR + 112 treatment (3.3 and 3.8 g·g–1, respec tively). For RP no significant differences were found for any of the three species across all treatments for N, P, or K (Figure 2). N:P and AN PP No significant relationship was found for N:P and above- ground net primary productivity (ANPP) for P. deltoides (Fig- ure 3). The trend for Q. pagoda and P. occ i de nt al i s for N:P and ANPP (Figure 4) was a significant (p > 0.05) curvilinear rela- tionship with the peak occurring at or near the N:P ratio of 17 and 14 respectively. For both species, when N:P increased past these points, ANPP tended to decrease. Discussion We wanted to determine how resources were utilized for biomass production, with respect to varying levels of irrigation, nitrogen, or the combined application of irrigation and nitrogen application (fertigation, IRR + 56, IRR + 112, and IRR + 224). The differences between N uptake and utilization, reflected in the N content of the combined aboveground parts, for P. del- toides and P. occidentalis was likely influenced by the greater biomass production of these two species than was seen in Q. pagoda, and was more highly influenced by the irrigation treatment for P. deltoides and P. occidentalis than for Q. pa- goda (Table 1). Despite these differences, N content in Q. pa- goda were greater at higher N application rates. Rowe et al., (2002) found a similar relationship for loblolly pine but found Table 2. Average % nutrient resorption efficiency (RE%) and leaf level nutrient use efficiency (LNUE g·g–1) for nitrogen (N), phosphorus (P), and potassium (K) with standard deviation for P. deltoides), Q. pagoda, and P. occidental during year eight (2003) of the study. Letters indicate significant differences among treatments. RE LNUE P. deltoides N P K N P K CON 65 (9)a 58 (11)a 85 (8)a 136 (13)a 1250 (76)a 732 (182)a IRR 62 (4)a 56 (6)a 81 (14)a 116 (20)a 1232 (299)a 418 (345)a IRR+56 60 (3)a 56 (7)a 72 (8)a 112 (19)a 1103 (88)a 363 (158)a IRR+112 57 (2)a 53 (7)a 72 (9)a 107 (7)a 1118 (74)a 361 (118)a IRR+224 63 (5)a 57 (7)a 83 (8)a 111 (15)a 1037 (182)a 331 (183)a Q. pagoda CON 62 (4)a 40 (6)a 64 (22)a 140 (7)a 1107 (131)a 274 (80)a IRR 60 (5)a 39 (6)a 57 (11)a 114 (12)a 1092 (84)a 265 (31)a IRR+56 60 (7)a 37 (2)a 54 (18)a 114 (12)a 1031 (72)a 270 (125)a IRR+112 62 (7)a 37 (5)a 51 (8)a 113 (21)a 1049 (84)a 214 (63)a IRR+224 61 (7)a 45 (16)a 52 (18)a 111 (23)a 1035 (95)a 218 (72)a P. occide ntalis CON 74 (4)a 57 (13)a 85 (3)a 176 (37)a 944 (112)a 476 (76)a IRR 72 (6)a 51 (3) a 83 (6)a 144 (7)a 886 (42)a 404 (79)a IRR+56 70 (5)a 50 (4)a 83 (5)a 132 (26)a 866 (81)a 373 (92)a IRR+112 70 (7)a 52 (10)a 82 (4)a 126 (22)a 863 (97)a 376 (107)a Copyright © 2012 SciRes. 192 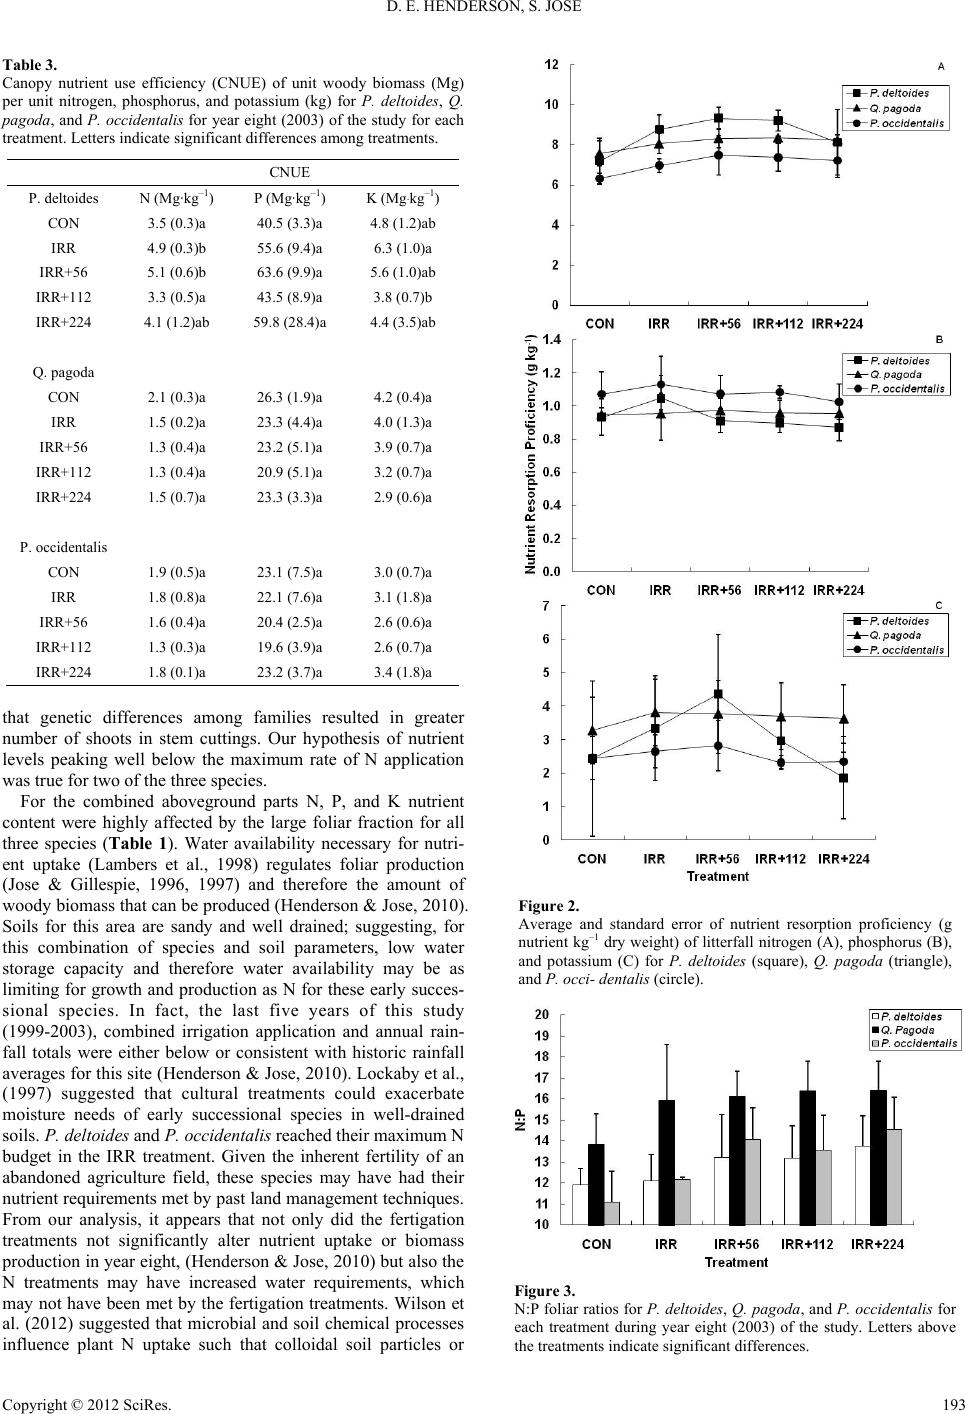 D. E. HENDERSON, S. JOSE Table 3. Canopy nutrient use efficiency (CNUE) of unit woody biomass (Mg) per unit nitrogen, phosphorus, and potassium (kg) for P. deltoides, Q. pagoda, and P. occidentalis for year eight (2003) of the study for each treatment. Letters indicate significant differences among treatments. CNUE P. deltoides N (Mg·kg–1) P (Mg·kg–1) K (Mg·kg–1) CON 3.5 (0.3)a 40.5 (3.3)a 4.8 (1.2)ab IRR 4.9 (0.3)b 55.6 (9.4)a 6.3 (1.0)a IRR+56 5.1 (0.6)b 63.6 (9.9)a 5.6 (1.0)ab IRR+112 3.3 (0.5)a 43.5 (8.9)a 3.8 (0.7)b IRR+224 4.1 (1.2)ab 59.8 (28.4)a 4.4 (3.5)ab Q. pagoda CON 2.1 (0.3)a 26.3 (1.9)a 4.2 (0.4)a IRR 1.5 (0.2)a 23.3 (4.4)a 4.0 (1.3)a IRR+56 1.3 (0.4)a 23.2 (5.1)a 3.9 (0.7)a IRR+112 1.3 (0.4)a 20.9 (5.1)a 3.2 (0.7)a IRR+224 1.5 (0.7)a 23.3 (3.3)a 2.9 (0.6)a P. occidentalis CON 1.9 (0.5)a 23.1 (7.5)a 3.0 (0.7)a IRR 1.8 (0.8)a 22.1 (7.6)a 3.1 (1.8)a IRR+56 1.6 (0.4)a 20.4 (2.5)a 2.6 (0.6)a IRR+112 1.3 (0.3)a 19.6 (3.9)a 2.6 (0.7)a IRR+224 1.8 (0.1)a 23.2 (3.7)a 3.4 (1.8)a that genetic differences among families resulted in greater number of shoots in stem cuttings. Our hypothesis of nutrient levels peaking well below the maximum rate of N application was true for two of the three species. For the combined aboveground parts N, P, and K nutrient content were highly affected by the large foliar fraction for all three species (Table 1). Water availability necessary for nutri- ent uptake (Lambers et al., 1998) regulates foliar production (Jose & Gillespie, 1996, 1997) and therefore the amount of woody biomass that can be produced (Henderson & Jose, 2010). Soils for this area are sandy and well drained; suggesting, for this combination of species and soil parameters, low water storage capacity and therefore water availability may be as limiting for growth and production as N for these early succes- sional species. In fact, the last five years of this study (1999-2003), combined irrigation application and annual rain- fall totals were either below or consistent with historic rainfall averages for this site (Henderson & Jose, 2010). Lockaby et al., (1997) suggested that cultural treatments could exacerbate moisture needs of early successional species in well-drained soils. P. deltoides and P. occidentalis reached their maximum N budget in the IRR treatment. Given the inherent fertility of an abandoned agriculture field, these species may have had their nutrient requirements met by past land management techniques. From our analysis, it appears that not only did the fertigation treatments not significantly alter nutrient uptake or biomass production in year eight, (Henderson & Jose, 2010) but also the N treatments may have increased water requirements, which may not have been met by the fertigation treatments. Wilson et al. (2012) suggested that microbial and soil chemical processes influence plant N uptake such that colloidal soil particles or Figure 2. Average and standard error of nutrient resorption proficiency (g nutrient kg–1 dry weight) of litterfall nitrogen (A), phosphorus (B), and potassium (C) for P. deltoides (square), Q. pagoda (triangle), and P. occi- dentalis (circle). Figure 3. N:P foliar ratios for P. deltoides, Q. pagoda, and P. occidentalis for each treatment during year eight (2003) of the study. Letters above the treatments indicate significant differences. Copyright © 2012 SciRes. 193 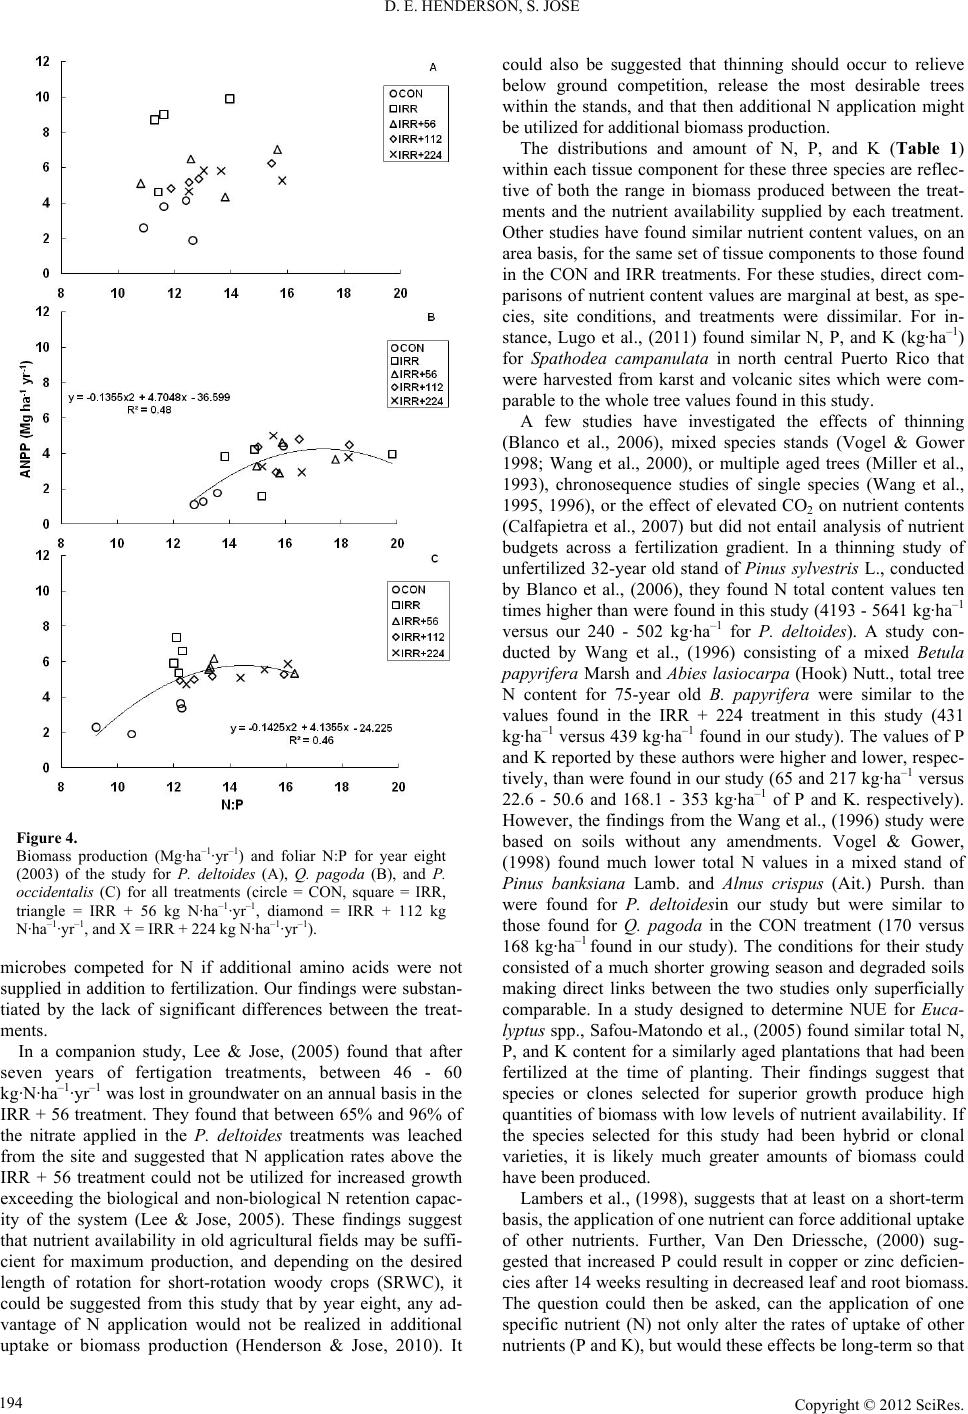 D. E. HENDERSON, S. JOSE Figure 4. Biomass production (Mg·ha–1·yr–1) and foliar N:P for year eight (2003) of the study for P. deltoides (A), Q. pagoda (B), and P. occidentalis (C) for all treatments (circle = CON, square = IRR, triangle = IRR + 56 kg N·ha–1·yr–1, diamond = IRR + 112 kg N·ha–1·yr–1, and X = IRR + 224 kg N·ha–1·yr–1). microbes competed for N if additional amino acids were not supplied in addition to fertilization. Our findings were substan- tiated by the lack of significant differences between the treat- ments. In a companion study, Lee & Jose, (2005) found that after seven years of fertigation treatments, between 46 - 60 kg·N·ha–1·yr–1 was lost in groundwater on an annual basis in the IRR + 56 treatment. They found that between 65% and 96% of the nitrate applied in the P. deltoides treatments was leached from the site and suggested that N application rates above the IRR + 56 treatment could not be utilized for increased growth exceeding the biological and non-biological N retention capac- ity of the system (Lee & Jose, 2005). These findings suggest that nutrient availability in old agricultural fields may be suffi- cient for maximum production, and depending on the desired length of rotation for short-rotation woody crops (SRWC), it could be suggested from this study that by year eight, any ad- vantage of N application would not be realized in additional uptake or biomass production (Henderson & Jose, 2010). It could also be suggested that thinning should occur to relieve below ground competition, release the most desirable trees within the stands, and that then additional N application might be utilized for additional biomass production. The distributions and amount of N, P, and K (Table 1) within each tissue component for these three species are reflec- tive of both the range in biomass produced between the treat- ments and the nutrient availability supplied by each treatment. Other studies have found similar nutrient content values, on an area basis, for the same set of tissue components to those found in the CON and IRR treatments. For these studies, direct com- parisons of nutrient content values are marginal at best, as spe- cies, site conditions, and treatments were dissimilar. For in- stance, Lugo et al., (2011) found similar N, P, and K (kg·ha–1) for Spathodea campanulata in north central Puerto Rico that were harvested from karst and volcanic sites which were com- parable to the whole tree values found in this study. A few studies have investigated the effects of thinning (Blanco et al., 2006), mixed species stands (Vogel & Gower 1998; Wang et al., 2000), or multiple aged trees (Miller et al., 1993), chronosequence studies of single species (Wang et al., 1995, 1996), or the effect of elevated CO2 on nutrient contents (Calfapietra et al., 2007) but did not entail analysis of nutrient budgets across a fertilization gradient. In a thinning study of unfertilized 32-year old stand of Pinus sylvestris L., conducted by Blanco et al., (2006), they found N total content values ten times higher than were found in this study (4193 - 5641 kg·ha–1 versus our 240 - 502 kg·ha–1 for P. deltoides). A study con- ducted by Wang et al., (1996) consisting of a mixed Betula papyrifera Marsh and Abies lasiocarpa (Hook) Nutt., total tree N content for 75-year old B. papyrifera were similar to the values found in the IRR + 224 treatment in this study (431 kg·ha–1 versus 439 kg·ha–1 found in our study). The values of P and K reported by these authors were higher and lower, respec- tively, than were found in our study (65 and 217 kg·ha–1 versus 22.6 - 50.6 and 168.1 - 353 kg·ha–1 of P and K. respectively). However, the findings from the Wang et al., (1996) study were based on soils without any amendments. Vogel & Gower, (1998) found much lower total N values in a mixed stand of Pinus banksiana Lamb. and Alnus crispus (Ait.) Pursh. than were found for P. deltoidesin our study but were similar to those found for Q. pagoda in the CON treatment (170 versus 168 kg·ha–1 found in our study). The conditions for their study consisted of a much shorter growing season and degraded soils making direct links between the two studies only superficially comparable. In a study designed to determine NUE for Euca- lyptus spp., Safou-Matondo et al., (2005) found similar total N, P, and K content for a similarly aged plantations that had been fertilized at the time of planting. Their findings suggest that species or clones selected for superior growth produce high quantities of biomass with low levels of nutrient availability. If the species selected for this study had been hybrid or clonal varieties, it is likely much greater amounts of biomass could have been produced. Lambers et al., (1998), suggests that at least on a short-term basis, the application of one nutrient can force additional uptake of other nutrients. Further, Van Den Driessche, (2000) sug- gested that increased P could result in copper or zinc deficien- cies after 14 weeks resulting in decreased leaf and root biomass. The question could then be asked, can the application of one specific nutrient (N) not only alter the rates of uptake of other nutrients (P and K), but would these effects be long-term so that Copyright © 2012 SciRes. 194 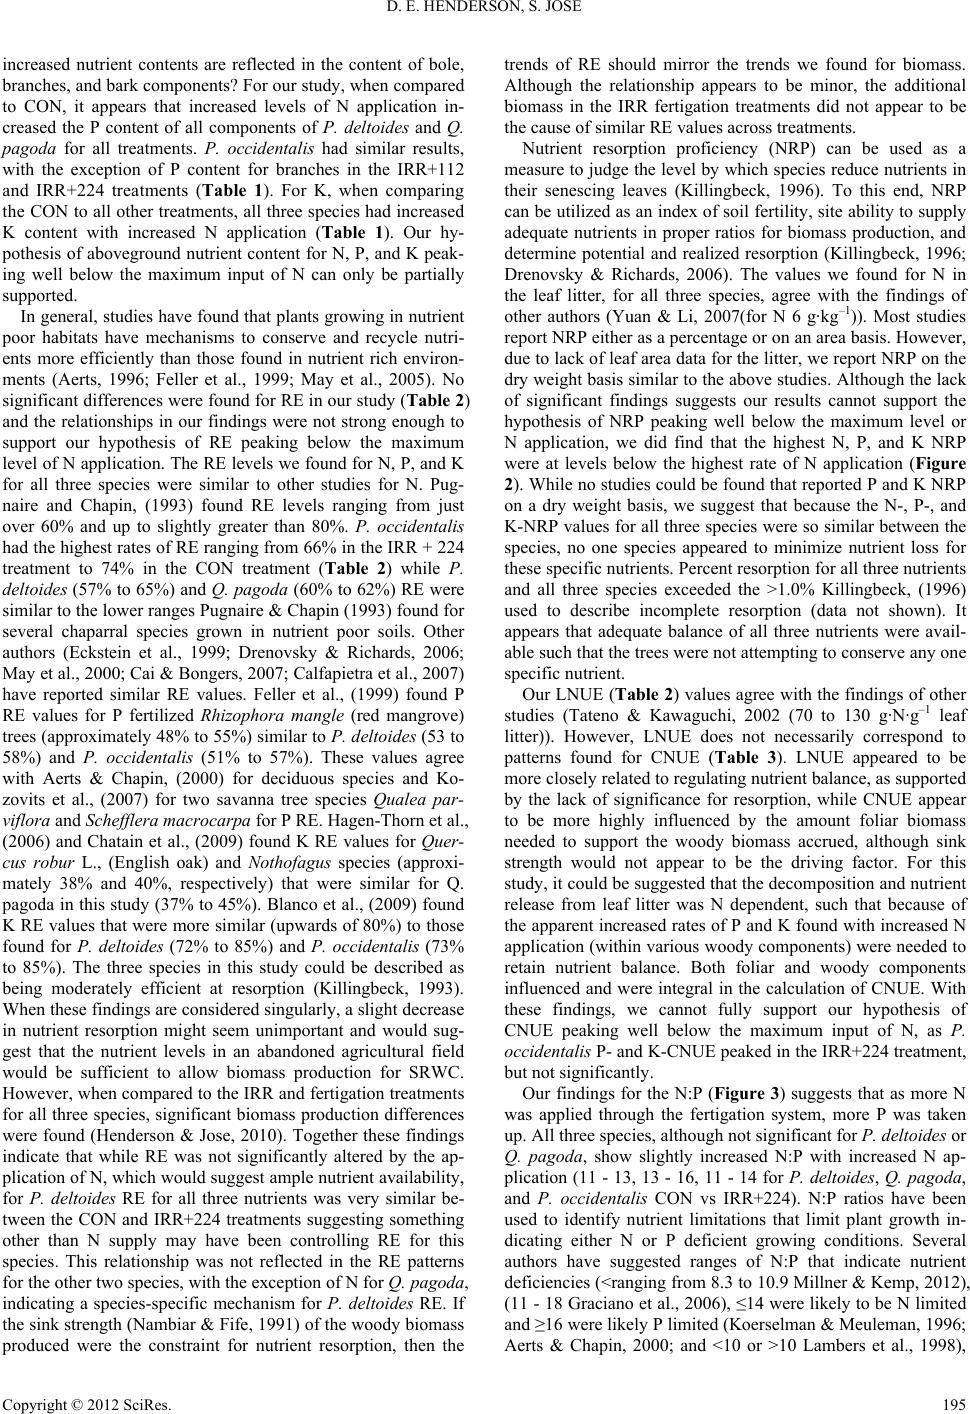 D. E. HENDERSON, S. JOSE increased nutrient contents are reflected in the content of bole, branches, and bark components? For our study, when compared to CON, it appears that increased levels of N application in- creased the P content of all components of P. deltoides and Q. pagoda for all treatments. P. occidentalis had similar results, with the exception of P content for branches in the IRR+112 and IRR+224 treatments (Table 1). For K, when comparing the CON to all other treatments, all three species had increased K content with increased N application (Table 1). Our hy- pothesis of aboveground nutrient content for N, P, and K peak- ing well below the maximum input of N can only be partially supported. In general, studies have found that plants growing in nutrient poor habitats have mechanisms to conserve and recycle nutri- ents more efficiently than those found in nutrient rich environ- ments (Aerts, 1996; Feller et al., 1999; May et al., 2005). No significant differences were found for RE in our study (Table 2) and the relationships in our findings were not strong enough to support our hypothesis of RE peaking below the maximum level of N application. The RE levels we found for N, P, and K for all three species were similar to other studies for N. Pug- naire and Chapin, (1993) found RE levels ranging from just over 60% and up to slightly greater than 80%. P. occidentalis had the highest rates of RE ranging from 66% in the IRR + 224 treatment to 74% in the CON treatment (Table 2) while P. deltoides (57% to 65%) and Q. pagoda (60% to 62%) RE were similar to the lower ranges Pugnaire & Chapin (1993) found for several chaparral species grown in nutrient poor soils. Other authors (Eckstein et al., 1999; Drenovsky & Richards, 2006; May et al., 2000; Cai & Bongers, 2007; Calfapietra et al., 2007) have reported similar RE values. Feller et al., (1999) found P RE values for P fertilized Rhizophora mangle (red mangrove) trees (approximately 48% to 55%) similar to P. deltoides (53 to 58%) and P. occidentalis (51% to 57%). These values agree with Aerts & Chapin, (2000) for deciduous species and Ko- zovits et al., (2007) for two savanna tree species Qualea par- viflora and Schefflera macrocarpa for P RE. Hagen-Thorn et al., (2006) and Chatain et al., (2009) found K RE values for Quer- cus robur L., (English oak) and Nothofagus species (approxi- mately 38% and 40%, respectively) that were similar for Q. pagoda in this study (37% to 45%). Blanco et al., (2009) found K RE values that were more similar (upwards of 80%) to those found for P. deltoides (72% to 85%) and P. occidentalis (73% to 85%). The three species in this study could be described as being moderately efficient at resorption (Killingbeck, 1993). When these findings are considered singularly, a slight decrease in nutrient resorption might seem unimportant and would sug- gest that the nutrient levels in an abandoned agricultural field would be sufficient to allow biomass production for SRWC. However, when compared to the IRR and fertigation treatments for all three species, significant biomass production differences were found (Henderson & Jose, 2010). Together these findings indicate that while RE was not significantly altered by the ap- plication of N, which would suggest ample nutrient availability, for P. deltoides RE for all three nutrients was very similar be- tween the CON and IRR+224 treatments suggesting something other than N supply may have been controlling RE for this species. This relationship was not reflected in the RE patterns for the other two species, with the exception of N for Q. pagoda, indicating a species-specific mechanism for P. deltoides RE. If the sink strength (Nambiar & Fife, 1991) of the woody biomass produced were the constraint for nutrient resorption, then the trends of RE should mirror the trends we found for biomass. Although the relationship appears to be minor, the additional biomass in the IRR fertigation treatments did not appear to be the cause of similar RE values across treatments. Nutrient resorption proficiency (NRP) can be used as a measure to judge the level by which species reduce nutrients in their senescing leaves (Killingbeck, 1996). To this end, NRP can be utilized as an index of soil fertility, site ability to supply adequate nutrients in proper ratios for biomass production, and determine potential and realized resorption (Killingbeck, 1996; Drenovsky & Richards, 2006). The values we found for N in the leaf litter, for all three species, agree with the findings of other authors (Yuan & Li, 2007(for N 6 g·kg–1)). Most studies report NRP either as a percentage or on an area basis. However, due to lack of leaf area data for the litter, we report NRP on the dry weight basis similar to the above studies. Although the lack of significant findings suggests our results cannot support the hypothesis of NRP peaking well below the maximum level or N application, we did find that the highest N, P, and K NRP were at levels below the highest rate of N application (Figure 2). While no studies could be found that reported P and K NRP on a dry weight basis, we suggest that because the N-, P-, and K-NRP values for all three species were so similar between the species, no one species appeared to minimize nutrient loss for these specific nutrients. Percent resorption for all three nutrients and all three species exceeded the >1.0% Killingbeck, (1996) used to describe incomplete resorption (data not shown). It appears that adequate balance of all three nutrients were avail- able such that the trees were not attempting to conserve any one specific nutrient. Our LNUE (Table 2) values agree with the findings of other studies (Tateno & Kawaguchi, 2002 (70 to 130 g·N·g–1 leaf litter)). However, LNUE does not necessarily correspond to patterns found for CNUE (Table 3). LNUE appeared to be more closely related to regulating nutrient balance, as supported by the lack of significance for resorption, while CNUE appear to be more highly influenced by the amount foliar biomass needed to support the woody biomass accrued, although sink strength would not appear to be the driving factor. For this study, it could be suggested that the decomposition and nutrient release from leaf litter was N dependent, such that because of the apparent increased rates of P and K found with increased N application (within various woody components) were needed to retain nutrient balance. Both foliar and woody components influenced and were integral in the calculation of CNUE. With these findings, we cannot fully support our hypothesis of CNUE peaking well below the maximum input of N, as P. occidentalis P- and K-CNUE peaked in the IRR+224 treatment, but not significantly. Our findings for the N:P (Figure 3) suggests that as more N was applied through the fertigation system, more P was taken up. All three species, although not significant for P. deltoides or Q. pagoda, show slightly increased N:P with increased N ap- plication (11 - 13, 13 - 16, 11 - 14 for P. deltoides, Q. pagoda, and P. occidentalis CON vs IRR+224). N:P ratios have been used to identify nutrient limitations that limit plant growth in- dicating either N or P deficient growing conditions. Several authors have suggested ranges of N:P that indicate nutrient deficiencies (<ranging from 8.3 to 10.9 Millner & Kemp, 2012), (11 - 18 Graciano et al., 2006), ≤14 were likely to be N limited and ≥16 were likely P limited (Koerselman & Meuleman, 1996; Aerts & Chapin, 2000; and <10 or >10 Lambers et al., 1998), Copyright © 2012 SciRes. 195 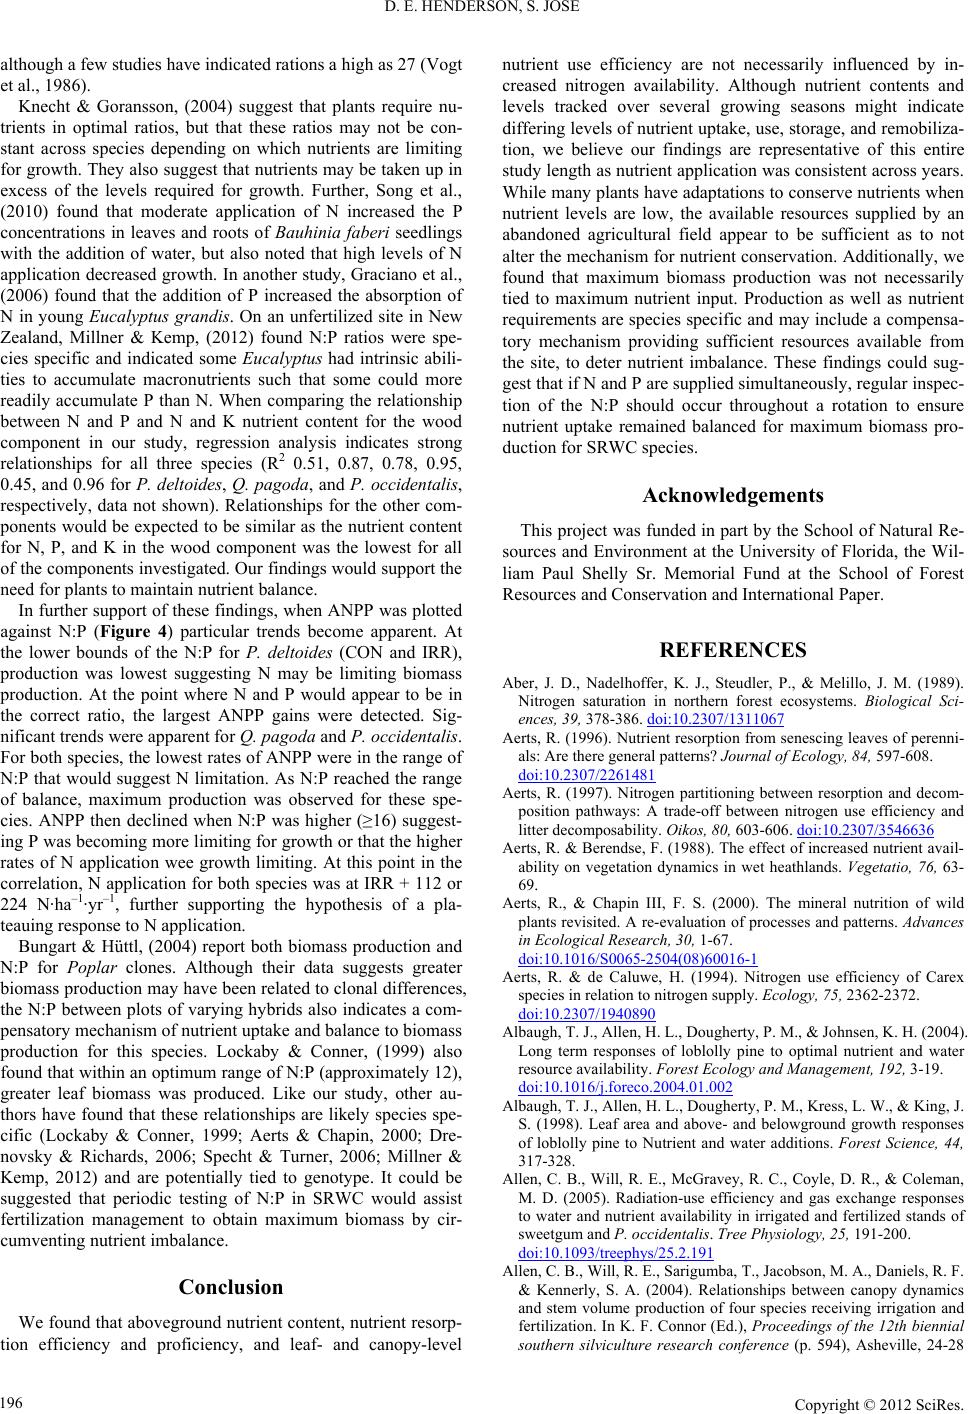 D. E. HENDERSON, S. JOSE although a few studies have indicated rations a high as 27 (Vogt et al., 1986). Knecht & Goransson, (2004) suggest that plants require nu- trients in optimal ratios, but that these ratios may not be con- stant across species depending on which nutrients are limiting for growth. They also suggest that nutrients may be taken up in excess of the levels required for growth. Further, Song et al., (2010) found that moderate application of N increased the P concentrations in leaves and roots of Bauhinia faberi seedlings with the addition of water, but also noted that high levels of N application decreased growth. In another study, Graciano et al., (2006) found that the addition of P increased the absorption of N in young Eucalyptus grandis. On an unfertilized site in New Zealand, Millner & Kemp, (2012) found N:P ratios were spe- cies specific and indicated some Eucalyptus had intrinsic abili- ties to accumulate macronutrients such that some could more readily accumulate P than N. When comparing the relationship between N and P and N and K nutrient content for the wood component in our study, regression analysis indicates strong relationships for all three species (R2 0.51, 0.87, 0.78, 0.95, 0.45, and 0.96 for P. deltoides, Q. pagoda, and P. occidentalis, respectively, data not shown). Relationships for the other com- ponents would be expected to be similar as the nutrient content for N, P, and K in the wood component was the lowest for all of the components investigated. Our findings would support the need for plants to maintain nutrient balance. In further support of these findings, when ANPP was plotted against N:P (Figure 4) particular trends become apparent. At the lower bounds of the N:P for P. deltoides (CON and IRR), production was lowest suggesting N may be limiting biomass production. At the point where N and P would appear to be in the correct ratio, the largest ANPP gains were detected. Sig- nificant trends were apparent for Q. pagoda and P. occidentalis. For both species, the lowest rates of ANPP were in the range of N:P that would suggest N limitation. As N:P reached the range of balance, maximum production was observed for these spe- cies. ANPP then declined when N:P was higher (≥16) suggest- ing P was becoming more limiting for growth or that the higher rates of N application wee growth limiting. At this point in the correlation, N application for both species was at IRR + 112 or 224 N·ha–1·yr–1, further supporting the hypothesis of a pla- teauing response to N application. Bungart & Hüttl, (2004) report both biomass production and N:P for Poplar clones. Although their data suggests greater biomass production may have been related to clonal differences, the N:P between plots of varying hybrids also indicates a com- pensatory mechanism of nutrient uptake and balance to biomass production for this species. Lockaby & Conner, (1999) also found that within an optimum range of N:P (approximately 12), greater leaf biomass was produced. Like our study, other au- thors have found that these relationships are likely species spe- cific (Lockaby & Conner, 1999; Aerts & Chapin, 2000; Dre- novsky & Richards, 2006; Specht & Turner, 2006; Millner & Kemp, 2012) and are potentially tied to genotype. It could be suggested that periodic testing of N:P in SRWC would assist fertilization management to obtain maximum biomass by cir- cumventing nutrient imbalance. Conclusion We found that aboveground nutrient content, nutrient resorp- tion efficiency and proficiency, and leaf- and canopy-level nutrient use efficiency are not necessarily influenced by in- creased nitrogen availability. Although nutrient contents and levels tracked over several growing seasons might indicate differing levels of nutrient uptake, use, storage, and remobiliza- tion, we believe our findings are representative of this entire study length as nutrient application was consistent across years. While many plants have adaptations to conserve nutrients when nutrient levels are low, the available resources supplied by an abandoned agricultural field appear to be sufficient as to not alter the mechanism for nutrient conservation. Additionally, we found that maximum biomass production was not necessarily tied to maximum nutrient input. Production as well as nutrient requirements are species specific and may include a compensa- tory mechanism providing sufficient resources available from the site, to deter nutrient imbalance. These findings could sug- gest that if N and P are supplied simultaneously, regular inspec- tion of the N:P should occur throughout a rotation to ensure nutrient uptake remained balanced for maximum biomass pro- duction for SRWC species. Acknowledgements This project was funded in part by the School of Natural Re- sources and Environment at the University of Florida, the Wil- liam Paul Shelly Sr. Memorial Fund at the School of Forest Resources and Conservation and International Paper. REFERENCES Aber, J. D., Nadelhoffer, K. J., Steudler, P., & Melillo, J. M. (1989). Nitrogen saturation in northern forest ecosystems. Biological Sci- ences, 39, 378-386. doi:10.2307/1311067 Aerts, R. (1996). Nutrient resorption from senescing leaves of perenni- als: Are there general patterns? Journal of Ecology, 84, 597-608. doi:10.2307/2261481 Aerts, R. (1997). Nitrogen partitioning between resorption and decom- position pathways: A trade-off between nitrogen use efficiency and litter decomposability. Oikos, 80, 603-606. doi:10.2307/3546636 Aerts, R. & Berendse, F. (1988). The effect of increased nutrient avail- ability on vegetation dynamics in wet heathlands. Vegetatio, 76, 63- 69. Aerts, R., & Chapin III, F. S. (2000). The mineral nutrition of wild plants revisited. A re-evaluation of processes and patterns. Advances in Ecological Research, 3 0, 1-67. doi:10.1016/S0065-2504(08)60016-1 Aerts, R. & de Caluwe, H. (1994). Nitrogen use efficiency of Carex species in relation to nitrogen supply. Ecology, 75, 2362-2372. doi:10.2307/1940890 Albaugh, T. J., Allen, H. L., Dougherty, P. M., & Johnsen, K. H. (2004). Long term responses of loblolly pine to optimal nutrient and water resource availability. Forest Ecology and Management, 192, 3-19. doi:10.1016/j.foreco.2004.01.002 Albaugh, T. J., Allen, H. L., Dougherty, P. M., Kress, L. W., & King, J. S. (1998). Leaf area and above- and belowground growth responses of loblolly pine to Nutrient and water additions. Forest Science, 44, 317-328. Allen, C. B., Will, R. E., McGravey, R. C., Coyle, D. R., & Coleman, M. D. (2005). Radiation-use efficiency and gas exchange responses to water and nutrient availability in irrigated and fertilized stands of sweetgum and P. occidentalis. Tree Physiology, 25, 191-200. doi:10.1093/treephys/25.2.191 Allen, C. B., Will, R. E., Sarigumba, T., Jacobson, M. A., Daniels, R. F. & Kennerly, S. A. (2004). Relationships between canopy dynamics and stem volume production of four species receiving irrigation and fertilization. In K. F. Connor (Ed.), Proceedings of the 12th biennial southern silviculture research conference (p. 594), Asheville, 24-28 Copyright © 2012 SciRes. 196 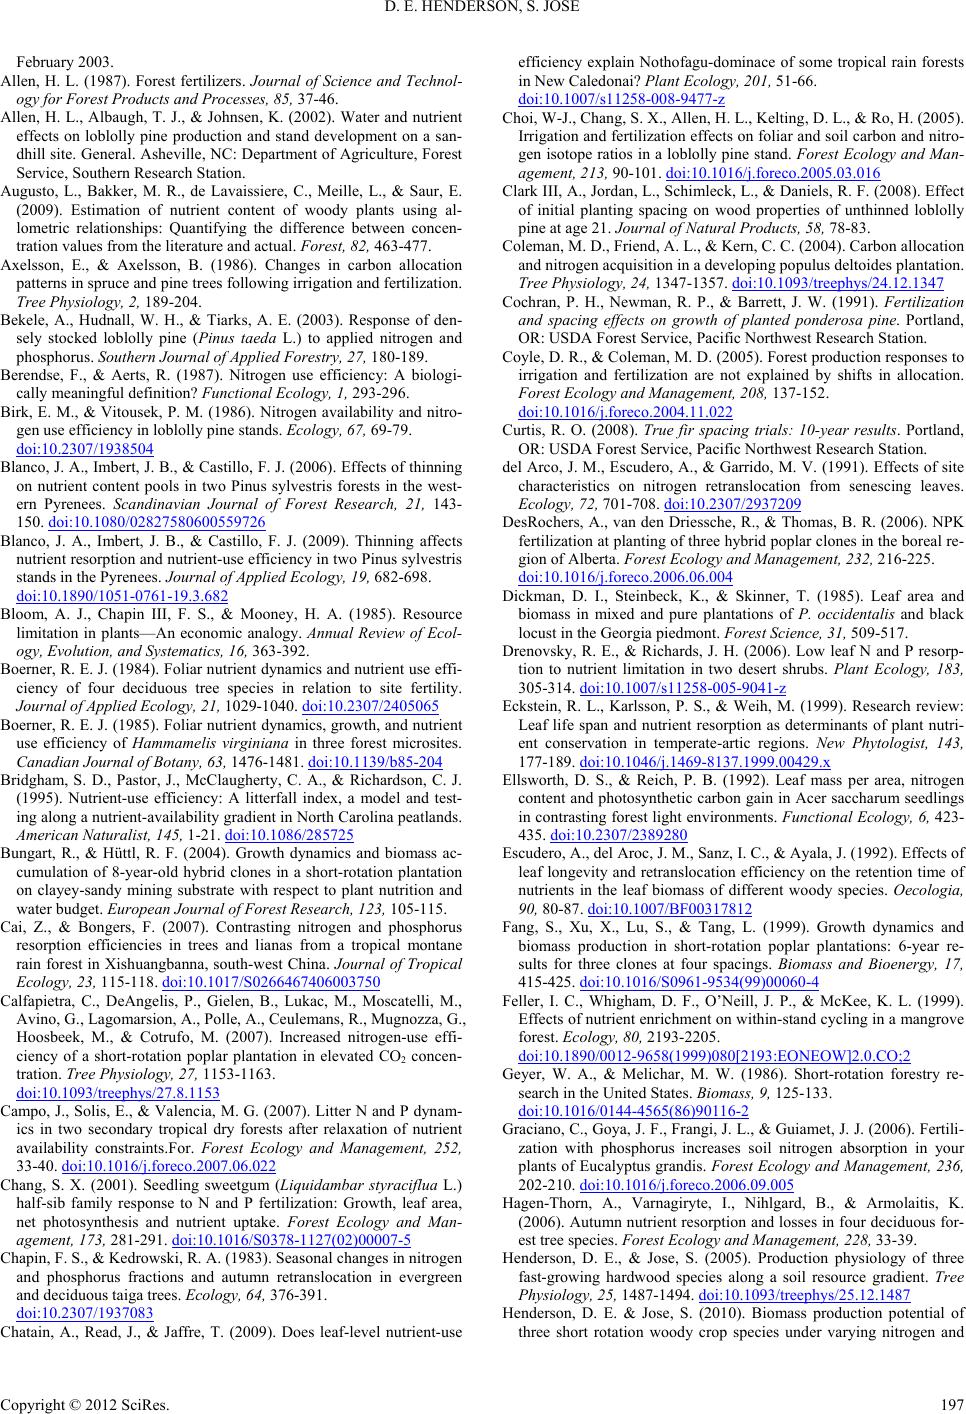 D. E. HENDERSON, S. JOSE February 2003. Allen, H. L. (1987). Forest fertilizers. Journal of Science and Technol- ogy for Forest Products and Processes, 85, 37-46. Allen, H. L., Albaugh, T. J., & Johnsen, K. (2002). Water and nutrient effects on loblolly pine production and stand development on a san- dhill site. General. Asheville, NC: Department of Agriculture, Forest Service, Southern Research Station. Augusto, L., Bakker, M. R., de Lavaissiere, C., Meille, L., & Saur, E. (2009). Estimation of nutrient content of woody plants using al- lometric relationships: Quantifying the difference between concen- tration values from the literature and actual. Forest, 82, 463-477. Axelsson, E., & Axelsson, B. (1986). Changes in carbon allocation patterns in spruce and pine trees following irrigation and fertilization. Tree Physiology, 2, 189-204. Bekele, A., Hudnall, W. H., & Tiarks, A. E. (2003). Response of den- sely stocked loblolly pine (Pinus taeda L.) to applied nitrogen and phosphorus. Southern Journal of Applied Forestry, 27, 180-189. Berendse, F., & Aerts, R. (1987). Nitrogen use efficiency: A biologi- cally meaningful definition? Functional Ecology, 1, 293-296. Birk, E. M., & Vitousek, P. M. (1986). Nitrogen availability and nitro- gen use efficiency in loblolly pine stands. Ecology, 67, 69-79. doi:10.2307/1938504 Blanco, J. A., Imbert, J. B., & Castillo, F. J. (2006). Effects of thinning on nutrient content pools in two Pinus sylvestris forests in the west- ern Pyrenees. Scandinavian Journal of Forest Research, 21, 143- 150. doi:10.1080/02827580600559726 Blanco, J. A., Imbert, J. B., & Castillo, F. J. (2009). Thinning affects nutrient resorption and nutrient-use efficiency in two Pinus sylvestris stands in the Pyrenees. Journal of Applied Ecology, 19, 682-698. doi:10.1890/1051-0761-19.3.682 Bloom, A. J., Chapin III, F. S., & Mooney, H. A. (1985). Resource limitation in plants—An economic analogy. Annual Review of Ecol- ogy, Evolution, and Systematics, 16, 363-392. Boerner, R. E. J. (1984). Foliar nutrient dynamics and nutrient use effi- ciency of four deciduous tree species in relation to site fertility. Journal of Applied Ec ol o gy , 21, 1029-1040. doi:10.2307/2405065 Boerner, R. E. J. (1985). Foliar nutrient dynamics, growth, and nutrient use efficiency of Hammamelis virginiana in three forest microsites. Canadian Journal of Botany, 63, 1476-1481. doi:10.1139/b85-204 Bridgham, S. D., Pastor, J., McClaugherty, C. A., & Richardson, C. J. (1995). Nutrient-use efficiency: A litterfall index, a model and test- ing along a nutrient-availability gradient in North Carolina peatlands. American Naturalist, 145, 1-21. doi:10.1086/285725 Bungart, R., & Hüttl, R. F. (2004). Growth dynamics and biomass ac- cumulation of 8-year-old hybrid clones in a short-rotation plantation on clayey-sandy mining substrate with respect to plant nutrition and water budget. European Journ a l of Forest Research, 123, 105-115. Cai, Z., & Bongers, F. (2007). Contrasting nitrogen and phosphorus resorption efficiencies in trees and lianas from a tropical montane rain forest in Xishuangbanna, south-west China. Journal of Tropical Ecology, 23, 115-118. doi:10.1017/S0266467406003750 Calfapietra, C., DeAngelis, P., Gielen, B., Lukac, M., Moscatelli, M., Avino, G., Lagomarsion, A., Polle, A., Ceulemans, R., Mugnozza, G., Hoosbeek, M., & Cotrufo, M. (2007). Increased nitrogen-use effi- ciency of a short-rotation poplar plantation in elevated CO2 concen- tration. Tree Physiology, 27, 1153-1163. doi:10.1093/treephys/27.8.1153 Campo, J., Solis, E., & Valencia, M. G. (2007). Litter N and P dynam- ics in two secondary tropical dry forests after relaxation of nutrient availability constraints.For. Forest Ecology and Management, 252, 33-40. doi:10.1016/j.foreco.2007.06.022 Chang, S. X. (2001). Seedling sweetgum (Liquidambar styraciflua L.) half-sib family response to N and P fertilization: Growth, leaf area, net photosynthesis and nutrient uptake. Forest Ecology and Man- agement, 173, 281-291. doi:10.1016/S0378-1127(02)00007-5 Chapin, F. S., & Kedrowski, R. A. (1983). Seasonal changes in nitrogen and phosphorus fractions and autumn retranslocation in evergreen and deciduous taiga trees. Ec ology, 64, 376-391. doi:10.2307/1937083 Chatain, A., Read, J., & Jaffre, T. (2009). Does leaf-level nutrient-use efficiency explain Nothofagu-dominace of some tropical rain forests in New Caledonai? Plant Ecology, 201, 51-66. doi:10.1007/s11258-008-9477-z Choi, W-J., Chang, S. X., Allen, H. L., Kelting, D. L., & Ro, H. (2005). Irrigation and fertilization effects on foliar and soil carbon and nitro- gen isotope ratios in a loblolly pine stand. Forest Ecology and Man- agement, 213, 90-101. doi:10.1016/j.foreco.2005.03.016 Clark III, A., Jordan, L., Schimleck, L., & Daniels, R. F. (2008). Effect of initial planting spacing on wood properties of unthinned loblolly pine at age 21. Journal of Natur al Products, 58, 78-83. Coleman, M. D., Friend, A. L., & Kern, C. C. (2004). Carbon allocation and nitrogen acquisition in a developing populus deltoides plantation. Tree Physiology, 24, 1347-1357. doi:10.1093/treephys/24.12.1347 Cochran, P. H., Newman, R. P., & Barrett, J. W. (1991). Fertilization and spacing effects on growth of planted ponderosa pine. Portland, OR: USDA Forest Service, Pacific Northwest Research Station. Coyle, D. R., & Coleman, M. D. (2005). Forest production responses to irrigation and fertilization are not explained by shifts in allocation. Forest Ecology and Management, 208, 137-152. doi:10.1016/j.foreco.2004.11.022 Curtis, R. O. (2008). True fir spacing trials: 10-year results. Portland, OR: USDA Forest Service, Pacific Northwest Research Station. del Arco, J. M., Escudero, A., & Garrido, M. V. (1991). Effects of site characteristics on nitrogen retranslocation from senescing leaves. Ecology, 72, 701-708. doi:10.2307/2937209 DesRochers, A., van den Driessche, R., & Thomas, B. R. (2006). NPK fertilization at planting of three hybrid poplar clones in the boreal re- gion of Alberta. Forest Ecology and Management, 232, 216-225. doi:10.1016/j.foreco.2006.06.004 Dickman, D. I., Steinbeck, K., & Skinner, T. (1985). Leaf area and biomass in mixed and pure plantations of P. occidentalis and black locust in the Georgia piedmont. Forest Science, 31, 509-517. Drenovsky, R. E., & Richards, J. H. (2006). Low leaf N and P resorp- tion to nutrient limitation in two desert shrubs. Plant Ecology, 183, 305-314. doi:10.1007/s11258-005-9041-z Eckstein, R. L., Karlsson, P. S., & Weih, M. (1999). Research review: Leaf life span and nutrient resorption as determinants of plant nutri- ent conservation in temperate-artic regions. New Phytologist, 143, 177-189. doi:10.1046/j.1469-8137.1999.00429.x Ellsworth, D. S., & Reich, P. B. (1992). Leaf mass per area, nitrogen content and photosynthetic carbon gain in Acer saccharum seedlings in contrasting forest light environments. Functional Ecology, 6, 423- 435. doi:10.2307/2389280 Escudero, A., del Aroc, J. M., Sanz, I. C., & Ayala, J. (1992). Effects of leaf longevity and retranslocation efficiency on the retention time of nutrients in the leaf biomass of different woody species. Oecologia, 90, 80-87. doi:10.1007/BF00317812 Fang, S., Xu, X., Lu, S., & Tang, L. (1999). Growth dynamics and biomass production in short-rotation poplar plantations: 6-year re- sults for three clones at four spacings. Biomass and Bioenergy, 17, 415-425. doi:10.1016/S0961-9534(99)00060-4 Feller, I. C., Whigham, D. F., O’Neill, J. P., & McKee, K. L. (1999). Effects of nutrient enrichment on within-stand cycling in a mangrove forest. Ecology, 80, 2193-2205. doi:10.1890/0012-9658(1999)080[2193:EONEOW]2.0.CO;2 Geyer, W. A., & Melichar, M. W. (1986). Short-rotation forestry re- search in the United States. Biomass, 9, 125-133. doi:10.1016/0144-4565(86)90116-2 Graciano, C., Goya, J. F., Frangi, J. L., & Guiamet, J. J. (2006). Fertili- zation with phosphorus increases soil nitrogen absorption in your plants of Eucalyptus grandis. Forest Ecology and Management, 236, 202-210. doi:10.1016/j.foreco.2006.09.005 Hagen-Thorn, A., Varnagiryte, I., Nihlgard, B., & Armolaitis, K. (2006). Autumn nutrient resorption and losses in four deciduous for- est tree species. Forest Ecology and Management, 228, 33-39. Henderson, D. E., & Jose, S. (2005). Production physiology of three fast-growing hardwood species along a soil resource gradient. Tree Physiology, 25, 1487-1494. doi:10.1093/treephys/25.12.1487 Henderson, D. E. & Jose, S. (2010). Biomass production potential of three short rotation woody crop species under varying nitrogen and Copyright © 2012 SciRes. 197 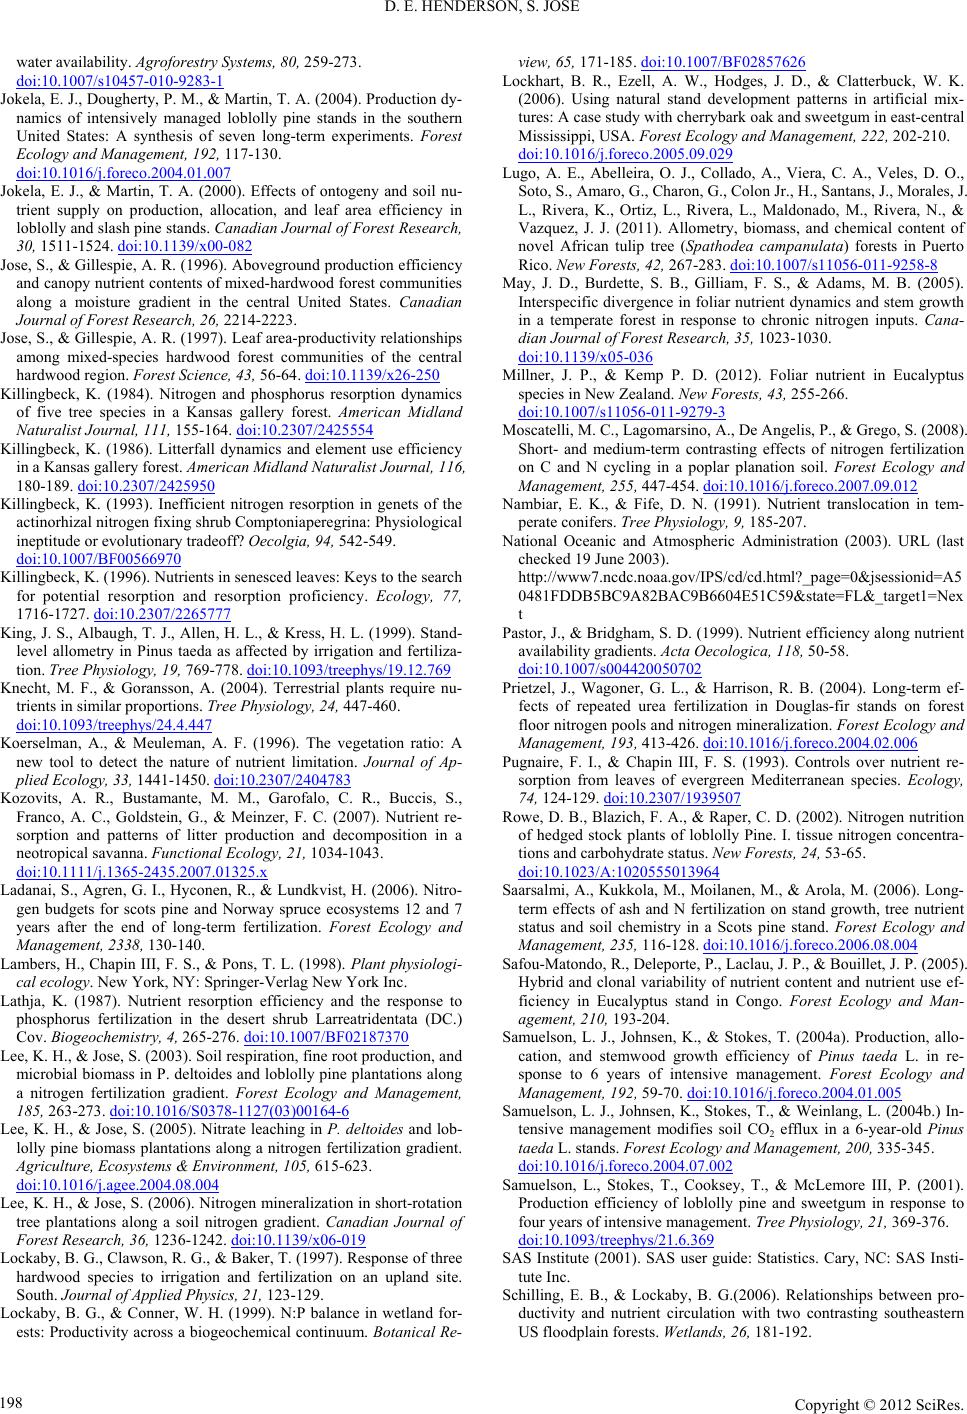 D. E. HENDERSON, S. JOSE water availability. Agroforestry Systems, 80, 259-273. doi:10.1007/s10457-010-9283-1 Jokela, E. J., Dougherty, P. M., & Martin, T. A. (2004). Production dy- namics of intensively managed loblolly pine stands in the southern United States: A synthesis of seven long-term experiments. Forest Ecology and Management, 192, 117-130. doi:10.1016/j.foreco.2004.01.007 Jokela, E. J., & Martin, T. A. (2000). Effects of ontogeny and soil nu- trient supply on production, allocation, and leaf area efficiency in loblolly and slash pine stands. Canadian Journal of Forest Research, 30, 1511-1524. doi:10.1139/x00-082 Jose, S., & Gillespie, A. R. (1996). Aboveground production efficiency and canopy nutrient contents of mixed-hardwood forest communities along a moisture gradient in the central United States. Canadian Journal of Forest Research, 26, 2214-2223. Jose, S., & Gillespie, A. R. (1997). Leaf area-productivity relationships among mixed-species hardwood forest communities of the central hardwood region. Forest Sc ie nc e , 43, 56-64. doi:10.1139/x26-250 Killingbeck, K. (1984). Nitrogen and phosphorus resorption dynamics of five tree species in a Kansas gallery forest. American Midland Naturalist Journal, 111, 155-164. doi:10.2307/2425554 Killingbeck, K. (1986). Litterfall dynamics and element use efficiency in a Kansas gallery forest. American Midland Naturalist Journal, 116, 180-189. doi:10.2307/2425950 Killingbeck, K. (1993). Inefficient nitrogen resorption in genets of the actinorhizal nitrogen fixing shrub Comptoniaperegrina: Physiological ineptitude or evolutionary tradeoff? Oecolgia, 94, 542-549. doi:10.1007/BF00566970 Killingbeck, K. (1996). Nutrients in senesced leaves: Keys to the search for potential resorption and resorption proficiency. Ecology, 77, 1716-1727. doi:10.2307/2265777 King, J. S., Albaugh, T. J., Allen, H. L., & Kress, H. L. (1999). Stand- level allometry in Pinus taeda as affected by irrigation and fertiliza- tion. Tree Physiology, 19, 769-778. doi:10.1093/treephys/19.12.769 Knecht, M. F., & Goransson, A. (2004). Terrestrial plants require nu- trients in similar proportions. Tree Physiology, 24, 447-460. doi:10.1093/treephys/24.4.447 Koerselman, A., & Meuleman, A. F. (1996). The vegetation ratio: A new tool to detect the nature of nutrient limitation. Journal of Ap- plied Ecology, 33, 1441-1450. doi:10.2307/2404783 Kozovits, A. R., Bustamante, M. M., Garofalo, C. R., Buccis, S., Franco, A. C., Goldstein, G., & Meinzer, F. C. (2007). Nutrient re- sorption and patterns of litter production and decomposition in a neotropical savanna. Functional Ecology, 21, 1034-1043. doi:10.1111/j.1365-2435.2007.01325.x Ladanai, S., Agren, G. I., Hyconen, R., & Lundkvist, H. (2006). Nitro- gen budgets for scots pine and Norway spruce ecosystems 12 and 7 years after the end of long-term fertilization. Forest Ecology and Management, 2338, 130-140. Lambers, H., Chapin III, F. S., & Pons, T. L. (1998). Plant physiologi- cal ecology. New York, NY: Springer-Verlag New York Inc. Lathja, K. (1987). Nutrient resorption efficiency and the response to phosphorus fertilization in the desert shrub Larreatridentata (DC.) Cov. Biogeochemistry, 4, 265-276. doi:10.1007/BF02187370 Lee, K. H., & Jose, S. (2003). Soil respiration, fine root production, and microbial biomass in P. deltoides and loblolly pine plantations along a nitrogen fertilization gradient. Forest Ecology and Management, 185, 263-273. doi:10.1016/S0378-1127(03)00164-6 Lee, K. H., & Jose, S. (2005). Nitrate leaching in P. deltoides and lob- lolly pine biomass plantations along a nitrogen fertilization gradient. Agriculture, Ecosystems & Environment, 105, 615-623. doi:10.1016/j.agee.2004.08.004 Lee, K. H., & Jose, S. (2006). Nitrogen mineralization in short-rotation tree plantations along a soil nitrogen gradient. Canadian Journal of Forest Research, 36, 1236-1242. doi:10.1139/x06-019 Lockaby, B. G., Clawson, R. G., & Baker, T. (1997). Response of three hardwood species to irrigation and fertilization on an upland site. South. Journal of Applied Physics, 21, 123-129. Lockaby, B. G., & Conner, W. H. (1999). N:P balance in wetland for- ests: Productivity across a biogeochemical continuum. Botanical Re- view, 65, 171-185. doi:10.1007/BF02857626 Lockhart, B. R., Ezell, A. W., Hodges, J. D., & Clatterbuck, W. K. (2006). Using natural stand development patterns in artificial mix- tures: A case study with cherrybark oak and sweetgum in east-central Mississippi, USA. Forest Ecology and Management, 222, 202-210. doi:10.1016/j.foreco.2005.09.029 Lugo, A. E., Abelleira, O. J., Collado, A., Viera, C. A., Veles, D. O., Soto, S., Amaro, G., Charon, G., Colon Jr., H., Santans, J., Morales, J. L., Rivera, K., Ortiz, L., Rivera, L., Maldonado, M., Rivera, N., & Vazquez, J. J. (2011). Allometry, biomass, and chemical content of novel African tulip tree (Spathodea campanulata) forests in Puerto Rico. New Forests, 42, 267-283. doi:10.1007/s11056-011-9258-8 May, J. D., Burdette, S. B., Gilliam, F. S., & Adams, M. B. (2005). Interspecific divergence in foliar nutrient dynamics and stem growth in a temperate forest in response to chronic nitrogen inputs. Cana- dian Journal of Forest Research, 35, 1023-1030. doi:10.1139/x05-036 Millner, J. P., & Kemp P. D. (2012). Foliar nutrient in Eucalyptus species in New Zealand. New Forests, 43, 255-266. doi:10.1007/s11056-011-9279-3 Moscatelli, M. C., Lagomarsino, A., De Angelis, P., & Grego, S. (2008). Short- and medium-term contrasting effects of nitrogen fertilization on C and N cycling in a poplar planation soil. Forest Ecology and Management, 255, 447-454. doi:10.1016/j.foreco.2007.09.012 Nambiar, E. K., & Fife, D. N. (1991). Nutrient translocation in tem- perate conifers. Tree Physiolog y, 9, 185-207. National Oceanic and Atmospheric Administration (2003). URL (last checked 19 June 2003). http://www7.ncdc.noaa.gov/IPS/cd/cd.html?_page=0&jsessionid=A5 0481FDDB5BC9A82BAC9B6604E51C59&state=FL&_target1=Nex t Pastor, J., & Bridgham, S. D. (1999). Nutrient efficiency along nutrient availability gradients. Acta Oecologica, 118, 50-58. doi:10.1007/s004420050702 Prietzel, J., Wagoner, G. L., & Harrison, R. B. (2004). Long-term ef- fects of repeated urea fertilization in Douglas-fir stands on forest floor nitrogen pools and nitrogen mineralization. Forest Ecology and Management, 193, 413-426. doi:10.1016/j.foreco.2004.02.006 Pugnaire, F. I., & Chapin III, F. S. (1993). Controls over nutrient re- sorption from leaves of evergreen Mediterranean species. Ecology, 74, 124-129. doi:10.2307/1939507 Rowe, D. B., Blazich, F. A., & Raper, C. D. (2002). Nitrogen nutrition of hedged stock plants of loblolly Pine. I. tissue nitrogen concentra- tions and carbohydrate status. New Forests, 24, 53-65. doi:10.1023/A:1020555013964 Saarsalmi, A., Kukkola, M., Moilanen, M., & Arola, M. (2006). Long- term effects of ash and N fertilization on stand growth, tree nutrient status and soil chemistry in a Scots pine stand. Forest Ecology and Management, 235, 116-128. doi:10.1016/j.foreco.2006.08.004 Safou-Matondo, R., Deleporte, P., Laclau, J. P., & Bouillet, J. P. (2005). Hybrid and clonal variability of nutrient content and nutrient use ef- ficiency in Eucalyptus stand in Congo. Forest Ecology and Man- agement, 210, 193-204. Samuelson, L. J., Johnsen, K., & Stokes, T. (2004a). Production, allo- cation, and stemwood growth efficiency of Pinus taeda L. in re- sponse to 6 years of intensive management. Forest Ecology and Management, 192, 59-70. doi:10.1016/j.foreco.2004.01.005 Samuelson, L. J., Johnsen, K., Stokes, T., & Weinlang, L. (2004b.) In- tensive management modifies soil CO2 efflux in a 6-year-old Pinus taeda L. stands. Forest Ecology and Management, 200, 335-345. doi:10.1016/j.foreco.2004.07.002 Samuelson, L., Stokes, T., Cooksey, T., & McLemore III, P. (2001). Production efficiency of loblolly pine and sweetgum in response to four years of intensive management. Tree Physiology, 21, 369-376. doi:10.1093/treephys/21.6.369 SAS Institute (2001). SAS user guide: Statistics. Cary, NC: SAS Insti- tute Inc. Schilling, E. B., & Lockaby, B. G.(2006). Relationships between pro- ductivity and nutrient circulation with two contrasting southeastern US floodplain forests. Wetlands, 26 , 181-192. Copyright © 2012 SciRes. 198  D. E. HENDERSON, S. JOSE Copyright © 2012 SciRes. 199 doi:10.1672/0277-5212(2006)26[181:RBPANC]2.0.CO;2 Schlaegel, B. E., & Kennedy, H. E. (1986). Deriving biomass estima- tions for seven plantation hardwood species. In D. L. Rockwood (Ed.), Proceedings of the 1985 southern forest biomass workshop (pp. 31-39). Gainesville, 11-14 June 1985. Schubert, M. R., Rennie, J. C., & Schlarbaum, S. E. (2004). Four pine species grown at four spacings on the eastern highland rim, Tennes- see, after 30 years. Asheville, NC: USDA Forest Service, Southern Research Station. Shelton. M. G., Switzer, G. L., Nelson, L. E., Baker, J. B., & Mueller, C. W. (1982). The development of P. deltoides plantations on allu- vial soils. Technical Bulletin, 1 13 , 47. Singh, B. (1998). Biomass production and nutrient dynamics in three clones of Populus deltoides planted on Indogangetic plains. Plant and Soil, 203, 15-26. doi:10.1023/A:1004388903402 Smith, K., Gholz, H. L., & de Assis Oliveira, F. (1998). Litterfall and nitrogen-use efficiency of plantations and primary forest in the east- ern Brazilian Amazon. Forest Ecology and Management, 109, 209- 220. doi:10.1016/S0378-1127(98)00247-3 Song, C. J., Ma, K. M., Qu, L. Y., Liu, Y., Xu, X. L., Fu, B. J., & Zhong, J. F. (2010). Interactive effects of water, nitrogen and phos- phorus on the growth, biomass partitioning and water-use efficiency of Bauhinia faberi seedlings. Journal of Arid Environments, 74, 1003-1012. Specht, A., & Turner, J. (2006). Foliar nutrient concentrations in mixed-species plantations of subtropical cabinet timber species and their potential as a management tool. Forest Ecology and Manage- ment, 233, 324-337. doi:10.1016/j.foreco.2006.05.029 Stape, J. L., Binkley, D. R., & Ryan, M. G. (2008). Production and carbon allocation in a clonal Eucalyptus plantation with water and nutrient manipulations. Forest Ecology and Management, 255, 920- 930. doi:10.1016/j.foreco.2007.09.085 Sword Sayer, M. A., Goelz, J. C. G., Chambers, J. L., Tang, Z., Dean, T. J., Haywood, J. D., & Leduc, D. J. (2004). Long-term trends in lob- lolly pine productivity and stand characteristics in response to thin- ning and fertilization in the West Gulf region. Forest Ecology and Management, 192, 71-96. doi:10.1016/j.foreco.2004.01.006 Tateno, R., & Kawaguchi, H. (2002). Differences in nitrogen use effi- ciency between leaves from canopy and subcanopy trees. Ecological Research, 17, 695-704. doi:10.1046/j.1440-1703.2002.00526.x Tuskan, G. A. (1998). Short-rotation woody crop supply systems in the Unites States: What do we know and what do we need to know? Biomass and Bioenergy, 14, 307-315. doi:10.1016/S0961-9534(97)10065-4 USDA, NRCS (2009). The PLANTS database. URL (2 December 2012). http://plants.usda.gov Van Den Driessche, R. (2000). Phsophorus, copper, and zinc supply levels influence growth and nutrition of a young Populustrichocarpa (Tott & Gray) × P. deltoides (Bartr. Ex Marsh) hybrid. New Forests, 19, 143-157. doi:10.1023/A:1006607410673 Vitousek, P. M. (1982). Nutrient cycling and nutrient use efficiency. American Naturalist, 119, 553-572. doi:10.1086/283931 Vitousek, P. M. (1998). Foliar and nutrients, nutrient resorption, and decomposition In Hawaiian Metrosideros Polymorpha. Ecosystems, 1, 401-407. doi:10.1007/s100219900033 Vogel, J. G., & Gower, S. T. (1998). Carbon and nitrogen dynamics of boreal jack pine stands with and without green alder understory. Ecosystems, 1, 386-400. doi:10.1007/s100219900032 Vogt, K. A., Grier, C. C., & Vogt, D. J. (1986). Production, turnover, and nutrient dynamics of above- and belowground detritus of the world forest. Advances in Ecological Research, 15, 303-377. doi:10.1016/S0065-2504(08)60122-1 Wang, J. P., Jarvis, P. G., & Taylor, C. M. (1991). Par absorption and its relation to above-ground dry matter production of Sitka Spruce. Journal of Applied Ec ol o gy , 28, 547-560. Wang, J. R., Letchford, T., Comeau, P., & Kimmins, J. P. (2000). Above- and below-ground biomass and nutrient distribution of a pa- per birch and subalpine fir mixed species stand in the Sub-Boreal Spruce zone of British Columbia. Forest Ecology and Management, 130, 17-26. doi:10.2307/2404567 Wang, J. R., Zhong, A. L., Comeau, T. M., & Kimmins, J. P. (1995). Aboveground biomass and nutrient accumulation in an age sequence of aspen (Populustremuloides) stands in the boreal white and black spruce zone, British Columbia. Forest Ecology and Management, 78, 127-138. doi:10.1016/0378-1127(95)03590-0 Wang, J. R., Zhong, A. L., Simard, S. W., & Kimmins, J. P. (1996). Aboveground biomass and nutrient accumulation in an age sequence of paper birch (Betula papyrifera) in the interior cedar hemlock zone, British Columbia. Forest Ecol ogy a nd M an ag eme nt , 83, 27-38. doi:10.1016/0378-1127(96)03703-6 Wienand, K. T., & Stock, W. D. (1995). Long-term phosphorus fertili- zation effects on the litter dynamics of an age sequence of Pinus elli- ottii plantations in Southern Cape of South Africa. Forest Ecology and Management, 75, 135-146. doi:10.1016/0378-1127(95)03528-I Will, R. E., Munger, G. T., Zhang, Y., & Borders, B. E. (2002). Effects of annual fertilization and complete competition control on current annual increment, foliar development, and growth efficiency of Pinus taeda stands. Canadian Journal of Forest Research, 32, 1728- 1740. doi:10.1139/x02-095 Wilson, A. R., Nzokou, P., Gűney, D., & Kulaç, Ş. (2012). Growth response and nitrogen use physiology of Fraser fir (Abies fraseri), red pine (Pinus resinosa) and hybrid poplar under amino acid nutri- tion. New Forests, 1-15. doi:10.1007/s11056-012-9317-9 Wright, I. J., & Westoby, M. (2001). Understanding seedling growth relationships through specific leaf areas and life nitrogen concentra- tion: Generalizations across growth forms and growth irradiance. Oecologia, 127, 21-29. doi:10.1007/s004420000554 Wright, I. J., & Westoby, M. (2003). Nutrient concentration, resorption and lifespan: Leaf traits of Australian sclerophyll species. Functional Ecology, 17, 10-19. doi:10.1046/j.1365-2435.2003.00694.x Xu, X., & Timmer, V. R. (1999). Growth and nutrition of Chinese fir seedlings exposed to nutrient loading and fertilization. Plant and Soil, 216, 83-91. doi:10.1023/A:1004733714217 Yan, E.-R., Wang, X., & Huang, J. (2006). Shifts in plant nutrient use strategies under secondary forest succession. Plant and Soil, 289, 187-197. doi:10.1007/s11104-006-9128-x Yuan, Z. Y., & Chen, H. Y. H. (2010). Changes in nitrogen resorption of trembling aspen (Populus tremuloides) with stand development. Plant and Soil, 327, 121. Yuan, Z. Y., & Li, L. H. (2007). Soils water status influences plant nitrogen use: A case study. Plant and Soil, 301, 303-313. doi:10.1007/s11104-007-9450-y Zalesny, J. A., Zalesny Jr., R.S., Coyle, D. R., & Hall, R. B. (2007). Growth and biomass of populus irrigated with landfill leachate. For- est Ecology and Management, 248, 143-152. doi:10.1016/j.foreco.2007.04.045 Zalesny, J. A., Zalesny Jr., R. S., Wiese, A. H., Sexton, B. T., & Hall, R. B. (2008). Uptake of macro- and micro-nutrients into leaf, woody, and root tissue of Populus after irrigation with landfill leachate. Journal of Sustainable Forestry, 27, 303-327. doi:10.1080/10549810802256262
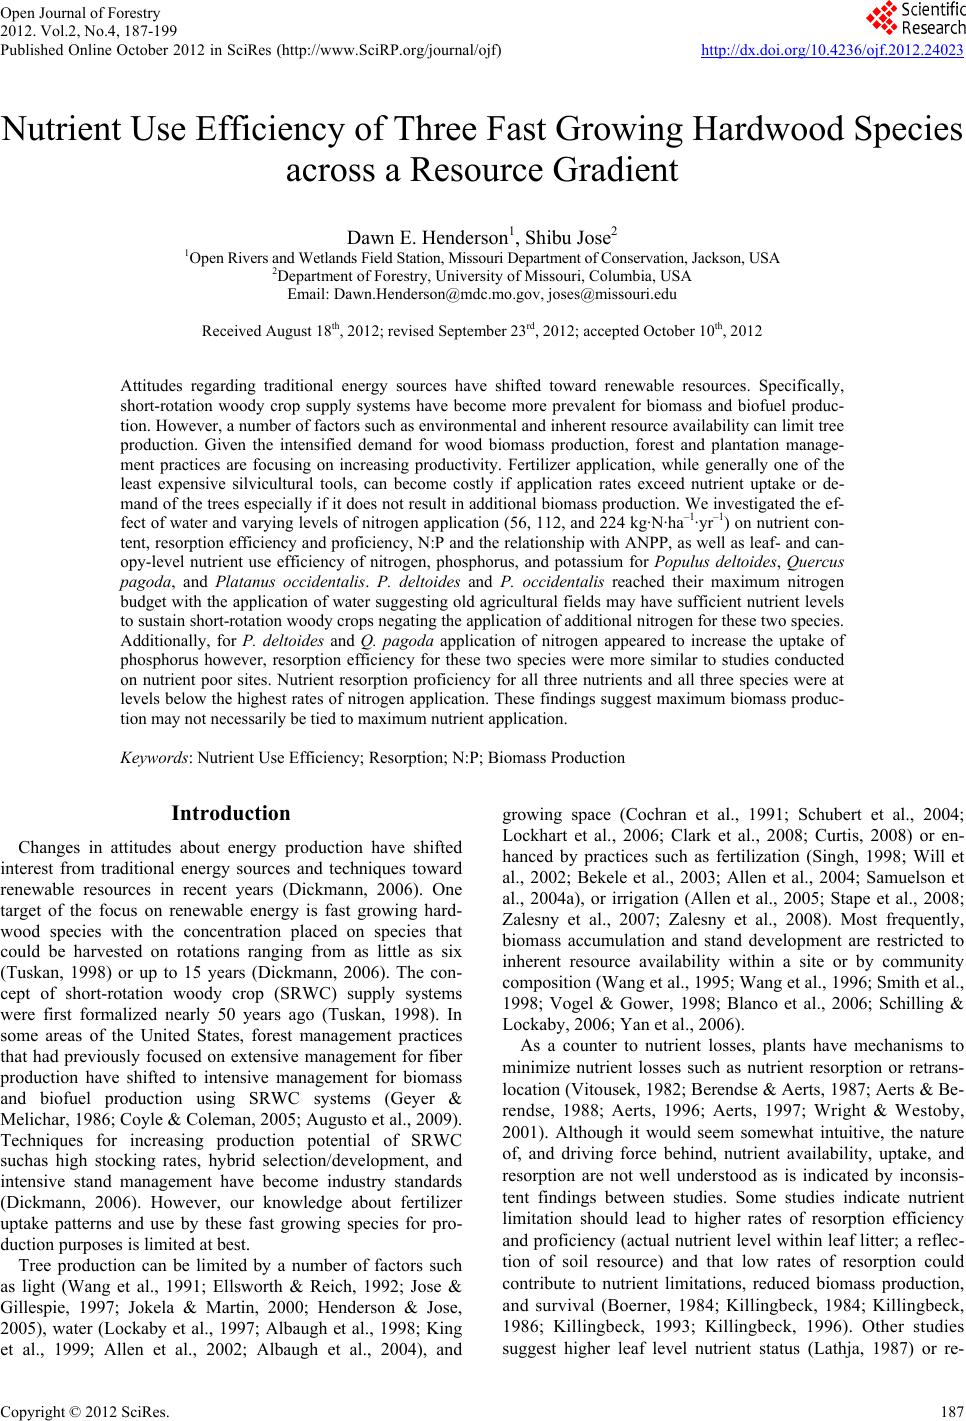
|