Paper Menu >>
Journal Menu >>
 Journal of Financial Risk Management 2012. Vol.1, No.3, 27-32 Published Online September 2012 in SciRes (http://www.SciRP.org/journal/jfrm) http://dx.doi.org/10.4236/jfrm.2012.13005 Copyright © 2012 SciRes. 27 Gauging Risk Stability: A Simple Test Using Patterns of Workers’ Compensation Claims Richard J. Butler1, B. Delworth Gardner1, Harold H. Gardner2 1Department of Economics, Brigham Young University, Provo, USA 2Human Capital Management Services, Cheyenne, USA Email: richard_butler@byu.edu, gardnerdel@yahoo.com, hank_gardner@hcmsgroup.com Received July 10th, 2012; revised August 12th, 2012; accepted August 26th, 2012 Abstract Abstract: In financial risk management, whether for national and international entities, or within a firm, it is important to be able to decide what risks are altered by past experience (or intervention of a central banker at the national level, or a firm’s risk manager at the employer level) and what risks do not vary over time (risks from intrinsic heterogeneity). Policies aimed at changing intrinsic risk will obviously not be cost effective, though tools for identifying such unchanging risks may help to minimize losses associated with those risks. This paper outlines a simple test that allows the researcher to distinguish these alternative risk types. We present our test in the context of patterns of workers’ compensation lost day claims to test whether past experience explains repeated claims for some individuals, or whether some individuals exhibit an innate heterogeneity in claims-filing propensities. We find that a previous claim significantly increases claim probabilities in the future using easy to estimate and interpret “runs” tests on the claims. This suggests, for the risk management problem examined here, that early intervention to limit the effects of the first lost time claim may produce significant disability-cost savings with respect to future claims. Keywords: Risk Measure; Heterogeneity; Runs Test; Workers’ Compensation Introduction One of the ongoing lessons from the current international fi- nancial, banking, and economic crisis is the importance of dis- tinguishing risks that do not change over time (call this “intrin- sic heterogeneity”) from risks that are susceptible to change. As an empirical matter, do risk entities change their behavior enough in a crisis to justify early intervention, or is the risk of those entities intransigent, so that such interventions are largely a waste of resources, and the cost effective policy is to some- how “isolate” intrinsic risks? Not just public policy makers, a firm’s risk management also finds it important to distinguish between intransigent (intrinsic) heterogeneous risks from risk that is altered by past experience. We develop a simple test for distinguishing these risk types when repeated observations on the same entities are available. We apply this test using patterns of losses from a US firm’s workers’ compensation (WC) claims. WC is not only expensive to firms (roughly $80 billion per year, see Ruser and Butler, 2010), and interacts with other employer provided benefits in ways that affects other program costs (Butler and Gardner, 2011). The US WC system pays virtually all medical expenses and provides partial reimbursement for lost wages for workers with on-the-job injuries and for some occupational diseases. Patterns of Claims: Distinguishing Heterogeneity from Experience Effects Our sample comes from a cohort of workers from one firm— eliminating the problems of differential risk management pol- icy, alternative benefit programs, and unobserved management safety culture, relative to a panel across many firms. Following our panel of workers over time, the distribution of claims ex- hibits more repeated claims, and more individuals with no claims, than one would expect if workers’ compensation claims were just a random Bernoulli process (i.e., the likelihood of a claims filing was constant across workers and over time). Three prominent explanations for these distributional results include: 1) residual impairments manifest themselves in repeated claims (i.e., workers do not fully recover from their injuries); 2) work- ers are inherently different in their preferences, so that a given health condition that would potentially qualify for a workers’ compensation claim might elicit differential propensities to file claims over time, or differ in their intrinsic health (either of which results in a time-invariant heterogeneity across workers in claims-filing propensity); and 3) workers are potentially affected by filing a workers’ compensation claim (injury- claimant experience) in a way that affects the future likelihood of filing a claim (even if all workers start with the same filing propensity initially, that propensity changes for an individual worker once he or she files a claim). Under all explanations, we would see claims concentrated among some workers, while at the same time an unexpectedly large number of workers ex- perience no claims at all (relative to a constant claims-filing probability). In our sample of US workers from one firm, the residual impairments do not explain the observed patterns. We were able to match up the claim data with the nature of injury and injured body part, and create six broad classes of injuries for these workers: back strains (21 percent), other strains and sprains (32 percent), cuts (4 percent), fractures (3 percent), contusions and concussions (23 percent), and other injuries (16 percent). If the residual-impairment explanation of repeated claims is true, then those who repeat claims will tend to report the same type of claim last year as they do this year. Relatively few of the repeat claims, however, are for the same type of  R. J. BUTLER ET AL. injury as occurred previously. Of the 1105 pairs of consecutive WC claims for the complete sample, only 25.2 or 22.8 percent reported injuries in the same broad category for both years. This is true despite the fact that a cut on the arm in one year is counted as the same claim type as a cut on the leg next year (given the broad nature of our six claim groups). The results hold when also examining claims two years apart, and under a variety of definitions of claims (whether using “first claim filed in any given year” or “any claims filed in that category during the year”). That is, there are relatively few injuries that are reported as being of the same type—only slightly more than one would expect if the injury types were random (and again, these are overstated because of the broad categories used for injury type). Hence our inference problem for the bunching of claims re- duces to the classic inference problem of sorting out heteroge- neity (each worker has a different but time invariant probability of filing a claim) from experience dependence (injury-claimant experience for workers’ compensation, where the likelihood of future claim-filing depends in part on whether past claims were filed). Injury-claimant experience effects can result from a worker’s job-related skills declining with time away from work on an injury claim, even as worker’s consumption skills and ability to use the disability system increase, hence lowering the opportunity cost of filing future claims. Injury-claimant experience effects, that is, the things learned from the process of going through a social insurance claim such as workers’ compensation insurance or unemployment insura- nce, has been estimated both by examining claimant-duration patterns and by examining repeat claims. Some claim-duration studies interpret negative duration dependence as evidence of injury-claimant experience: a claimant’s probability of exiting the benefit system declines with time spent in the system as they become more acclimated to the system. Negative-duration dependence in benefit programs has been examined in studies looking at unemployment insurance (Heckman and Borjas, 1980), Aid to Families with Dependent Children (Moffitt, 1992), and workers’ compensation (Butler and Worrall, 1985). Studies examining the effects of injury-claimant experience by looking at repeat spells are less common. However, repeat spells in unemployment insurance have been examined by Corak (1993), Lemieux and Macleod (1995) and McCall (1995). Again, our study examines repeated spells in workers’ compensation for employees from one firm in the US. Like the US unemployment insurance (UI) system, workers’ compensa- tion indemnity pay for non-work spells is a standard percentage of the pre-injury wage subject to minimum and maximum weekly benefits. Unlike UI benefits, workers compensation (WC) benefits are higher than UI benefits, received tax-free and potentially are of unlimited duration for serious injuries. Historically, there are more WC claims than there are UI cla- ims. Claim filing due to innate preference differences, determined before the onset of claims, we will call the heterogeneity effect. Claim filing due to practice, or experience with the benefit system, we will call the injury-claimant experience effect. As mentioned above, if there is heterogeneity in claim filing pro- pensities between workers, and if this heterogeneity is intrinsic to the individual and not subject to intervention efforts, then perhaps the only purpose for targeting repeat users of workers’ compensation is to segregate them into long-term counseling, or lower-cost chronic health treatments. If, on the other hand, being on a workers’ compensation claim increases the likelihood of filing future workers’ com- pensation claims because of the acquisition of WC claimant skills, then there is a more compelling role for early, perhaps aggressive, intervention in risk management. Lowering the level of dependency may generate significant cost savings in the future. So knowing whether multiple claims arise from intr- insic heterogeneity or injury-claimant experience is interesting from both a policy and scientific perspective. To understand the different implications of the heterogeneity versus the injury-claimant experience explanation of multiple claims, the analogy of three disability lotteries becomes instr- uctive: the simple lottery, the heterogeneity lottery, and the injury-claimant experience lottery. In each lottery, a given worker has his/her own disability lottery urn from which he/she randomly draws white balls and red balls once a year. If the worker draws a red ball, he/she files a workers’ compensation claim. If a white ball is drawn, he/she does not file a claim. In the simple lottery, we assume that everyone has the same proportion of red balls in his/her urn and that balls are drawn with replacement. Each time a ball is taken out, it is put back in the urn and the balls in the urn randomly shuffled. In the simple lottery, the composition of red and white balls is constant acr- oss workers and constant over time. For example, suppose that the urn contains 100 balls, with 5 red balls and 95 white balls. Since everyone draws from urns with the same fraction of red balls, and the composition of the balls in the urn doesn’t change from draw to draw, there are no heterogeneity or injury- clai- mant experience effects and everyone has a 5 percent chance of filing a claim. This is a Bernoulli process. In a large number of trials, each worker will file a workers’ compensation claim only about once in every 20 years. But the theoretical outcomes of a simple lottery model are compared with actual patterns of claims, there are many more workers with multiple claims in the empirical data than the simple lottery would predict. Workers who draw multiple red balls over the course of sev- eral years can be explained by either of the other two lotteries: the heterogeneity lottery or the claimant-injury-experience lot- tery. The difference between these two lotteries is in the way that draws are made. In the heterogeneity lottery, all individuals still have their own disability urns, but the proportion of red balls varies from person to person, perhaps due to intrinsic health differences. For example, some may have 50 red balls and 50 white balls, so that a workers’ compensation claim will be filed, on average, every other year. Some will have 25 balls and file a claim about once every fourth year. Some may have only 1 or 2 red balls in their 100 ball urn; they would rarely file a claim. In the heterogeneity-disability lottery, the probability of filing a claim doesn’t vary over time for any given individual, but does vary between individuals. Since the probabilities are assumed to be intrinsically fixed for any given individual, though they may vary across individuals, intervention wouldn’t affect subsequent behavior. In contrast to the heterogeneity lottery, where initially work- ers have different proportions of red and white balls in their urns, the injury-claimant experience lottery initially has the same proportion of red balls across all workers. Hence, there is no difference in the initial claims-filing probability (i.e. no heterogeneity) in the injury-claimant experience lottery. But now when someone draws a red ball and experiences a disabil- ity claim, some injury-claimant experience is accumulated that changes the future probability of claims filing. This injury- claimant experience may take several forms: the marginal nui- sance cost of filing a claim falls as more claims are filed, ex- pertise increases in finding sympathetic claims management or treating physicians (many employees choose their own treating Copyright © 2012 SciRes. 28  R. J. BUTLER ET AL. physicians under WC), or the relative value of work to leisure falls as work skills depreciate. In the injury-claimant experience lottery, therefore, instead of simply replacing the red ball when a claim occurs, we chan- ge the color composition of the urn by putting additional red balls in the place of white balls each time a single red ball is drawn. Suppose that when a red ball is drawn out, we put 21 red balls back while removing 20 white balls-the initial draw of a red ball raises the probability of drawing a red ball next time from 5 percent to 25 percent. Over the course of many draws, initial users of the system will tend to end up in the multi- ple-claims group because of this injury-claimant experience effect. This claimant-injury-experience lottery captures the notion that disability injury-claimant experience changes work- ers’ future behavior because claimant-consumption skills ac- cumulate, lowering the cost of filing future claims. But if early intervention for someone who has drawn a red ball in the injury-claimant experience lottery can change this preference (i.e., can mitigate the shift to additional red balls), such intervention may have a potentially large payoff as it speeds returns to work not only in the current period but also reduces the likelihood of filing more claims in the future. But- ler, Johnson, and Gray (2009) find that an early nurse contact is an effective risk management strategy as it significantly re- duces costs in a sample of low back pain claims for one large corporation. For example, consistent and sincere communica- tions to the workers about their “temporary work intolerance,” their importance to the company, and the company’s willing- ness to modify work until full recovery, may considerably alter the composition of red balls in the injury-claimant experience lottery. Instead of replacing the single red ball drawn with 21 more as discussed above, perhaps only 4 more are replaced. Then the workers likelihood of a claim filing will rise from 5 to 8 percent rather than from 5 to 25 percent. While the injury-claimant experience and heterogeneity dis- ability lotteries suggest that repeat usage by some individuals will be relatively common, the reasons for subsequent use might vary. In the heterogeneity model, the subsequent use is the result of innate differences across workers; in the injury- claimant experience model, it is because their initial experience develops a stock of claimant skills that lowers the cost of filing subsequent workers’ compensation claims. Distinguishing Heterogeneity Patterns from Claimant-Injury-Experience Patterns To distinguish between injury-claimant experience and hete- rogeneity models we need to follow workers over multiple yea- rs beyond the initial claim. Consider claim patterns for several years, where in a given year, “0” denotes no claim and “1” denotes that a workers’ compensation claim has been filed. The claims’ patterns for any given worker can be written as a string of zeros and ones moving left to right. In the first four years we might observe patterns of runs such as (1111) for workers who file a claim for each of their first four years at work, (0000) for those filing no claims during their first four years, and (1010) for those workers in which a claim is filed in the first and third years of employment. If one starts with the premise that all urns initially had the same, relatively small proportion of red balls, a (1111) pattern might be seen as evidence of either injury-claimant experience or heterogeneity. Similarly, a (0000) pattern may indicate indi- viduals with low propensities to file claims, either because there are few balls in their own urns (heterogeneity) or because the absence of initial claims never increased their propensity to file future claims. In Tables 1(a) and (b), we present some of the runs patterns for new hires in a single company. The focus on new hires means that all workers essentially come into our sample with no prior workers’ compensation experience that we need to take into account: the first “0” or “1” we observe is their first on-the-job experience with workers compensation. (That is, to avoid the “initial conditions” problems that arise from not hav- ing a complete history of the workers’ claims experience for each worker, we focus on the record of new hires with the company.) Additionally, to control for other unobserved factors, we examine workers in a single blue collar occupation. All these employees work part-time in a single division of the company. Hence we are able to control for what typically are unobserved differences in the demand for labor. In these tests, we use roughly 9 years of data. In Tables 1(a) and (b), we have included all those patterns for new hires with at least 5 indi- viduals in each run. As will become apparent below, patterns of all zeros or patterns with all ones do not allow us to differenti- ate between heterogeneity and injury-claimant experience, and so are excluded from consideration in Tables 1(a) and (b). (For the Table 2 sample of males, there are 3608 workers with a (00) pattern, 1510 with a (000) pattern, 916 with a (0000) pattern, 57 with a (11) pattern, 8 with a (111) pattern, and 1 with a (1111) pattern.) One way to control for unobservable heterogeneity in the composition of red balls is based on patterns containing equal numbers of claims. For example, (001), (010), and (100) all co- ntain one claim in three years and so are equally likely in terms of the number of their occurrences as long as there is no clai- mant-injury-experience effects. If there is no claimant-in- jury-experience effect, the probability of observing only one claim in three years should be independent of the year in which the claim is filed. The Bernoulli model of the simple lottery with no heterogeneity would also imply that equal probabilities should be observed for the three patterns (011), (101), and (110). A formal test of the Bernoulli model can be based on a com- parison of the actual number of times each of these patterns occurred with number of times we would expect a pattern to occur if it were a Bernoulli model. For the female data in Table 1(a), since the (001), (010), (100) patterns are equally likely to occur in the Bernoulli model (even with heterogeneity across workers), then on average we expect each pattern to occur 104 times (the average of 83, 157, and 73). A simple chi-square test comparing the actual number with the expected number yields a value of 36.37, which rejects the null hypothesis of the Ber- noulli model at the 1 percent level of statistical significance. Similarly, the (011), (101) and (110) patterns should each occur 20.333 times (the mean of 27, 7, and 27). Again, the chi-square rejects the Bernoulli model (at the 1 percent level, as it does for all of the appropriate combinations of patterns in Tables 1(a) and 1(b)). The assumption that a simple Bernoulli process is pr- esent, with or without heterogeneity, is therefore not supported by the data. An alternative hypothesis is that there is injury-claimant ex- perience, so that prior claims experience affects the probability of filing a claim in the future. We explore the implications of a general class of claimant-injury-experience models, the linear experience dependency, or LED, models. In this family of models, each year in which there is a claim, the likelihood of a claim the following year increases by β. In each year in which there are no claims filed, the probability of filing a claim sub- sequently is reduced by α. If we assume that α = β = 0, then there are no learning effects, and we get the Bernoulli process Copyright © 2012 SciRes. 29  R. J. BUTLER ET AL. Copyright © 2012 SciRes. 30 Table 1. (a) Patterns of Workers’ Compensation Claims for New Hires Part-Time, Division A Females; (b) Patterns of Workers’ Compensation Claims for New Hires Part-Time, Division A Males. (a) Pattern Actual Strong Led Rank Weak Led Rank Actual Strong Rank Actual Weak Rank [01] [10] 227 198 1 2 1 2 1 2 1 2 [001] [010] [100] 83 157 73 1 2 3 - 1 2 2 1 3 - 1 2 [011] [101] [110] 27 7 27 1 2 3 1 2 3 1 2 1 1 2 3 [0001] [0010] [0100] [1000] 54 88 78 29 1 2 3 4 - - 1 2 3 1 2 4 - - 1 2 [0011] [0101] [1001] [0110] [1010] [1100] 14 13 5 30 10 11 1 2 3 4 5 6 - 1 2 1 2 - 2 3 6 1 5 4 - 1 2 1 2 - [00001] [00010] [00100] [01000] [10000] 25 30 29 30 7 1 2 3 4 5 - - - 1 2 3 1 2 1 4 - - - 1 2 (b) Pattern Actual Strong Led Rank Weak Led Rank Actual Strong Rank Actual Weak Rank [01] [10] 401 295 1 2 1 2 1 2 1 2 [001] [010] [100] 134 243 102 1 2 3 - 1 2 2 1 3 - 1 2 [011] [101] [110] 32 9 33 1 2 3 1 2 3 2 3 1 2 3 1 [0001] [0010] [0100] [1000] 60 101 103 41 1 2 3 4 - - 1 2 3 2 1 4 - - 1 2 [0011] [0101] [1001] [0110] [1010] [1100] 16 20 6 31 7 7 1 2 3 4 5 6 - 1 2 1 2 - 3 2 5 1 4 4 - 1 2 1 2 - [00001] [00010] [00100] [01000] [10000] 24 40 41 40 21 1 2 3 4 5 - - - 1 2 3 2 1 2 4 - - - 1 2 as a special case. If we assume that α = 0, and β > 0, then we have a strong form of injury-claimant experience in which a single claim increases future claim-filing propensities, while several years of no claim experience doesn’t reduce claims- filing propensities. Under this STRONG form of the LED model, we would expect that the data would be ranked as they are in the second column of Table 1(a). Under the strong form of the LED model, the likelihood of observing (01) is simply (1-P) × P; whereas the likelihood of observing (10) is P × (1 – (P + β)), where P is the initial probably of filing a claim. Hence, in the strong LED model it is the case that Pr(01) > Pr(10), where Pr( ) denotes the probability of observing that sequence of claims experience. Similar calculations within all the blocks containing the same number of claims, as indicated by the “[ ]” groupings, yields the ranking in the third column from the left labeled “STRONG LED Ranks.” This strong form of the LED model is too restrictive in its predictions about behavior if continual employment without a claim tends to lower the propensity of filing workers’ compe- nsation claims. While there are many weaker versions of in- jury-claimant experience, the one we find intuitively appealing assumes that the likelihood of future claims rises more on av- erage in a year in which there is a workers’ compensation claim than it fails in a year in which there is no claim. The WEAK version of the LED is the expected impact of experiencing a claim is greater than the expected impact of a no-claims ex- perience, or P × β > (1 – P) × α. For relatively rare events like workers’ compensation where P is initially much less than a half, this means that β will be much greater than α. This simply suggests that experiencing a claim will shift the likelihood of a future claim up much higher in absolute terms than will a no-claims experience shift it 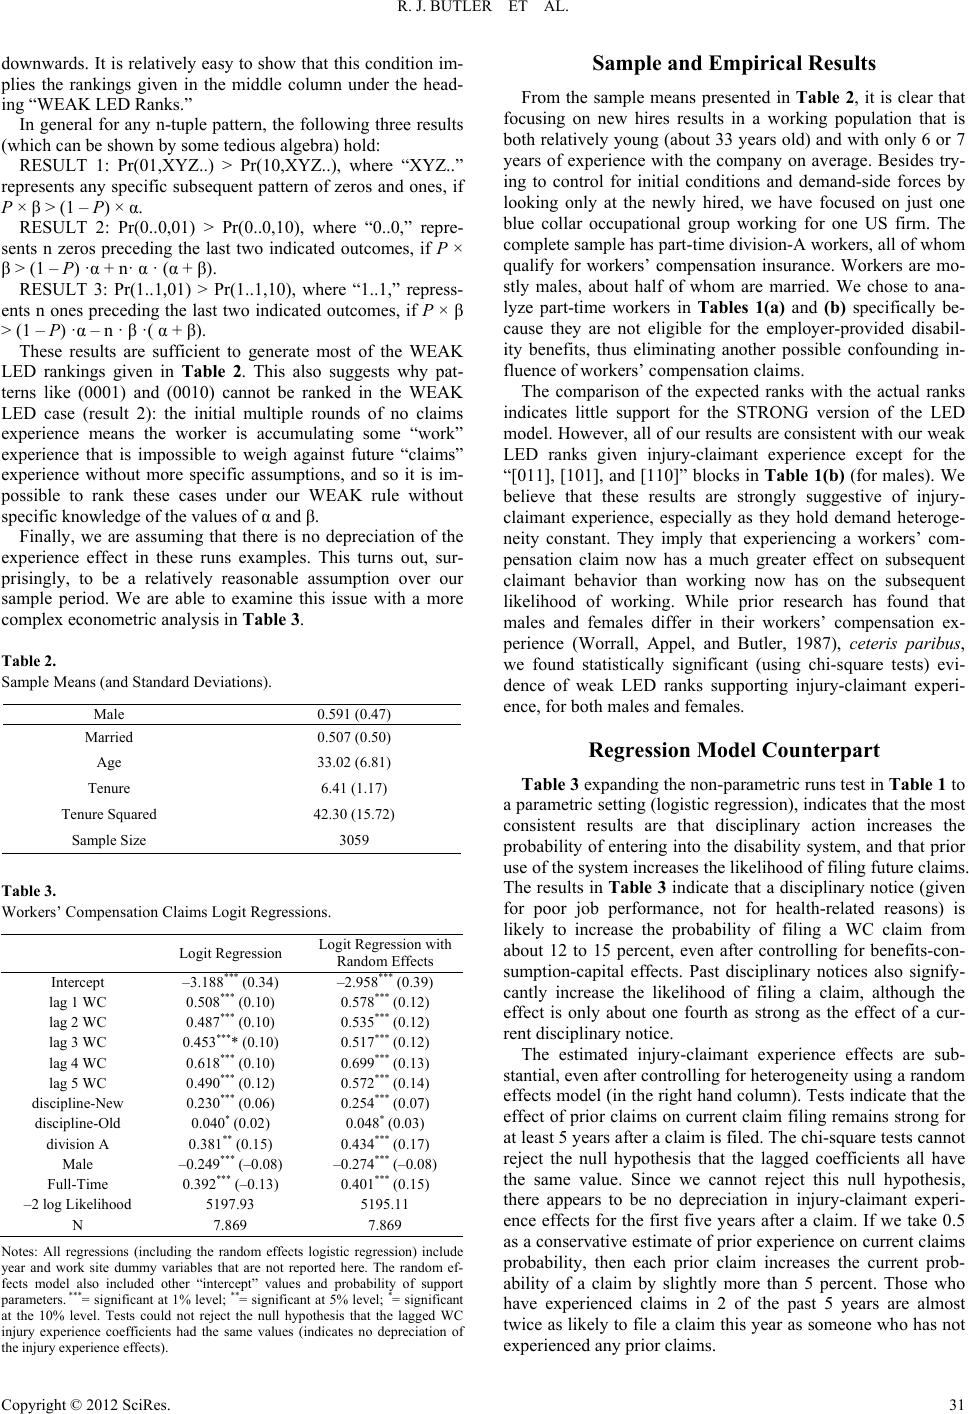 R. J. BUTLER ET AL. downwards. It is relatively easy to show that this condition im- plies the rankings given in the middle column under the head- ing “WEAK LED Ranks.” In general for any n-tuple pattern, the following three results (which can be shown by some tedious algebra) hold: RESULT 1: Pr(01,XYZ..) > Pr(10,XYZ..), where “XYZ..” represents any specific subsequent pattern of zeros and ones, if P × β > (1 – P) × α. RESULT 2: Pr(0..0,01) > Pr(0..0,10), where “0..0,” repre- sents n zeros preceding the last two indicated outcomes, if P × β > (1 – P) ·α + n· α · (α + β). RESULT 3: Pr(1..1,01) > Pr(1..1,10), where “1..1,” repress- ents n ones preceding the last two indicated outcomes, if P × β > (1 – P) ·α – n · β ·( α + β). These results are sufficient to generate most of the WEAK LED rankings given in Table 2. This also suggests why pat- terns like (0001) and (0010) cannot be ranked in the WEAK LED case (result 2): the initial multiple rounds of no claims experience means the worker is accumulating some “work” experience that is impossible to weigh against future “claims” experience without more specific assumptions, and so it is im- possible to rank these cases under our WEAK rule without specific knowledge of the values of α and β. Finally, we are assuming that there is no depreciation of the experience effect in these runs examples. This turns out, sur- prisingly, to be a relatively reasonable assumption over our sample period. We are able to examine this issue with a more complex econometric analysis in Table 3. Table 2. Sample Means (and Standard Deviations). Male 0.591 (0.47) Married 0.507 (0.50) Age 33.02 (6.81) Tenure 6.41 (1.17) Tenure Squared 42.30 (15.72) Sample Size 3059 Table 3. Workers’ Compensation Claims Logit Regressions. Logit Regression Logit Regression with Random Effects Intercept –3.188*** (0.34) –2.958*** (0.39) lag 1 WC 0.508*** (0.10) 0.578*** (0.12) lag 2 WC 0.487*** (0.10) 0.535*** (0.12) lag 3 WC 0.453**** (0.10) 0.517*** (0.12) lag 4 WC 0.618*** (0.10) 0.699*** (0.13) lag 5 WC 0.490*** (0.12) 0.572*** (0.14) discipline-New 0.230*** (0.06) 0.254*** (0.07) discipline-Old 0.040* (0.02) 0.048* (0.03) division A 0.381** (0.15) 0.434*** (0.17) Male –0.249*** (–0.08) –0.274*** (–0.08) Full-Time 0.392*** (–0.13) 0.401*** (0.15) –2 log Likelihood 5197.93 5195.11 N 7.869 7.869 Notes: All regressions (including the random effects logistic regression) include year and work site dummy variables that are not reported here. The random ef- fects model also included other “intercept” values and probability of support parameters. ***= significant at 1% level; **= significant at 5% level; *= significant at the 10% level. Tests could not reject the null hypothesis that the lagged WC injury experience coefficients had the same values (indicates no depreciation of the injury experience effects). Sample and Empirical Results From the sample means presented in Table 2, it is clear that focusing on new hires results in a working population that is both relatively young (about 33 years old) and with only 6 or 7 years of experience with the company on average. Besides try- ing to control for initial conditions and demand-side forces by looking only at the newly hired, we have focused on just one blue collar occupational group working for one US firm. The complete sample has part-time division-A workers, all of whom qualify for workers’ compensation insurance. Workers are mo- stly males, about half of whom are married. We chose to ana- lyze part-time workers in Tables 1(a) and (b) specifically be- cause they are not eligible for the employer-provided disabil- ity benefits, thus eliminating another possible confounding in- fluence of workers’ compensation claims. The comparison of the expected ranks with the actual ranks indicates little support for the STRONG version of the LED model. However, all of our results are consistent with our weak LED ranks given injury-claimant experience except for the “[011], [101], and [110]” blocks in Table 1(b) (for males). We believe that these results are strongly suggestive of injury- claimant experience, especially as they hold demand heteroge- neity constant. They imply that experiencing a workers’ com- pensation claim now has a much greater effect on subsequent claimant behavior than working now has on the subsequent likelihood of working. While prior research has found that males and females differ in their workers’ compensation ex- perience (Worrall, Appel, and Butler, 1987), ceteris paribus, we found statistically significant (using chi-square tests) evi- dence of weak LED ranks supporting injury-claimant experi- ence, for both males and females. Regression Model Counterpart Table 3 expanding the non-parametric runs test in Table 1 to a parametric setting (logistic regression), indicates that the most consistent results are that disciplinary action increases the probability of entering into the disability system, and that prior use of the system increases the likelihood of filing future claims. The results in Table 3 indicate that a disciplinary notice (given for poor job performance, not for health-related reasons) is likely to increase the probability of filing a WC claim from about 12 to 15 percent, even after controlling for benefits-con- sumption-capital effects. Past disciplinary notices also signify- cantly increase the likelihood of filing a claim, although the effect is only about one fourth as strong as the effect of a cur- rent disciplinary notice. The estimated injury-claimant experience effects are sub- stantial, even after controlling for heterogeneity using a random effects model (in the right hand column). Tests indicate that the effect of prior claims on current claim filing remains strong for at least 5 years after a claim is filed. The chi-square tests cannot reject the null hypothesis that the lagged coefficients all have the same value. Since we cannot reject this null hypothesis, there appears to be no depreciation in injury-claimant experi- ence effects for the first five years after a claim. If we take 0.5 as a conservative estimate of prior experience on current claims probability, then each prior claim increases the current prob- ability of a claim by slightly more than 5 percent. Those who have experienced claims in 2 of the past 5 years are almost twice as likely to file a claim this year as someone who has not experienced any prior claims. Copyright © 2012 SciRes. 31  R. J. BUTLER ET AL. Copyright © 2012 SciRes. 32 Summary and Conclusions A common financial risk management problem, both at the level of nations and for individual firms, is to distinguish risks that can be changed by some sort of intervention from risks that cannot be changed. Firms struggling to reduce medical-care costs or disability costs are searching for ways to manage bene- fits programs to achieve that end. Crucially important is under- standing why some employees file disability claims at a much higher rate than others do. Is it simply an intrinsic difference in health status or does participation in the disability-insurance system lead to an injury-claimant experience effect that in- creases the filing of subsequent claims quite apart from health status? To answer this question, we analyzed individual blue-collar employee data from a large private US firm using “runs” tests that analyze patterns of claims filings and compares these with a random Bernoulli process. The runs test indicates that claims filings are not a simple random lottery nor a heterogeneity lot- tery (without injury-claimant experience). Therefore, health status and/or “injury-claimant experience” effects on claims filings seem to be a potentially significant explanation, a priori. Though firm characteristics (“demand conditions”) are held constant because all employees come from the same firm with a common overall workplace risk environment, these runs test imposes two restrictive assumptions: 1) differences in workers’ socio-economic characteristics don’t affect outcomes; and 2) there is no depreciation of the “injury-claimant experience” effect over time. While our sample of new employees from one firm offers more advantages over samples ranging across firms, occupations, and unmeasured differences in the human re- source/employee benefits environments, the analysis still suffer from potentially unmeasured, time-varying factors, including the underreporting of workplace injuries (Boone and van Ours, 2006). Nonetheless, our results suggest that the potential im- portance of injury-claimant experience in workers’ compensa- tion warrants the scrutiny of this important result in future re- search. Clearly, the empirical ideas and models here also may have application to the behavior of other entities subject to financial risks, such as banks and countries within a common currency zone. These findings have important implications for firm and pub- lic policy. It would appear that resources invested in reducing injury-claimant experience effects, as well as improving the health status of employees, would have large payoffs in reduc- ing insurance costs and productivity losses (Butler, Johnson, and Gray (2007) provide analogous results for a different sam- ple using a different statistical approach). Exactly what the appropriate early intervention strategy should be, whether ap- plied internally by the firm and perhaps through changes in the mandated workers’ compensation system, is a question that should receive the attention of private managers and public policy makers. Acknowledgements We are grateful for computing support from the Industrial Relations Center at the University of Minnesota, and the De- partment of Economics at Brigham Young University. Helpful comments were received in seminars at the Risk Theory Soci- ety Meeting, Columbia University, Cornell University, and the University of Minnesota. We especially wish to thank Steve Cameron, John Budd, and Brian McCall for comments on ear- lier drafts. REFERENCES Boone, J., & van Ours, J. C. (2006). Are recessions good for workplace safety? Journal of Health Economics , 25, 1069-1093. doi:10.1016/j.jhealeco.2006.03.002 Butler, R. J., & Gardner, H. H. (2011). Moral hazard and benefits con- sumption capital in program overlap: The case of workers’ Com- pensation. Foundations and Tren ds in Microeconomics, 6, 1-52. Butler, R. J., & Worrall, J. D. (1985). Work injury compensation and the duration of non-work spells. Economic Journal, 96, 714-724. Butler, R. J., Johnson, W. G., & Gray, B. (2007). Timing makes a dif- ference: Early employer intervention and low back pain. Professional Case Management Journal, 12, 316-327. Chamberlain, G. (1980). Analysis of covariance with qualitative data. Review of Economic Studies, 47, 225-238. doi:10.2307/2297110 Corak, M. (1993). UI once again: The incidence of repeat participation in the Canadian UI Program. Canadian Public Policy, 19 , 162-176. doi:10.2307/3551680 Heckman, J. J., & Borjas, G. J. (1980). Does unemployment cause future unemployment? Definitions, questions and answers from a continuous time model of Heterogeneity and state dependence. Eco- nometrica, 47, 247-283. Lemieux, T., & MacLeod, W. B. (1995). State dependence and unem- ployment insurance. Human Resources Development Canada, mimeo. McCall, B. P. (1995). Repeat use of unemployment insurance. Indus- trial Relations Center, Minnesota: University of Minnesota. Moffitt, R. (1992). Incentive effects of the US welfare system: A re- view. Journal of Economic Literature, 30, 1-61. Ruser, J., & Butler, R. J. (2010). The economics of occupational safety and health. Foundations and Trends in Microeconomics, 5, 301-354. Worrall, J. D., Appel, D., & Butler, R. J. (1987) Sex, marital status, and medical utilization by injured workers. Journal of Risk and Insur- ance, 54, 27-44. doi:10.2307/252880 |