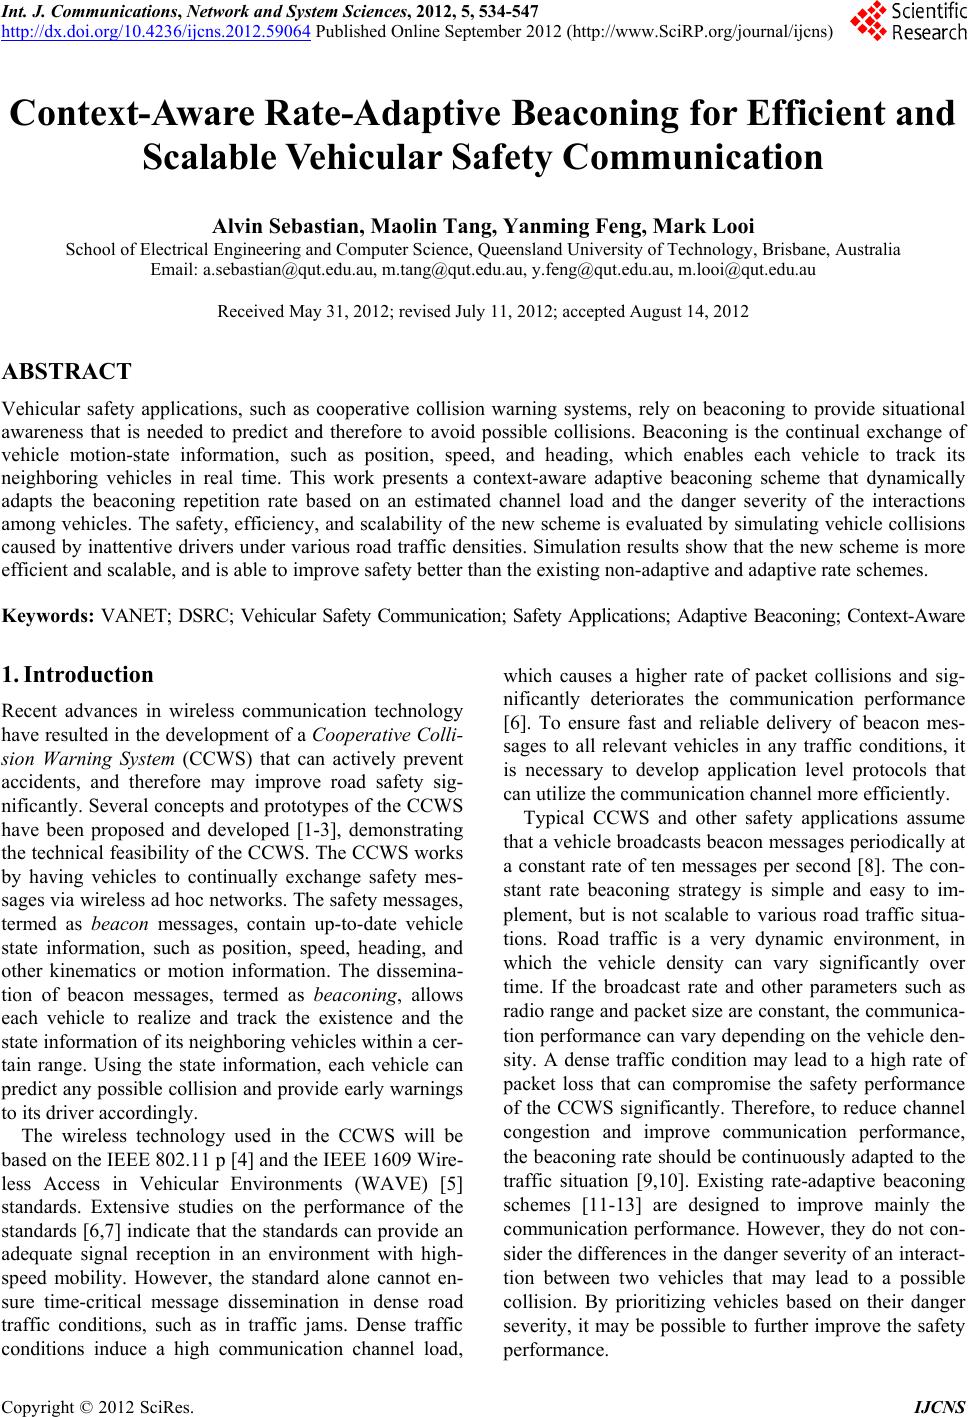
 Int. J. Communications, Network and System Sciences, 2012, 5, 534-547 http://dx.doi.org/10.4236/ijcns.2012.59064 Published Online September 2012 (http://www.SciRP.org/journal/ijcns) Context-Aware Rate-Adaptive Beaconing for Efficient and Scalable Vehicular Safety Communication Alvin Sebastian, Maolin Tang, Yanming Feng, Mark Looi School of Electrical Engineering and Computer Science, Queensland University of Technology, Brisbane, Australia Email: a.sebastian@qut.edu.au, m.tang@qut.edu.au, y.feng@qut.edu.au, m.looi@qut.edu.au Received May 31, 2012; revised July 11, 2012; accepted August 14, 2012 ABSTRACT Vehicular safety applications, such as cooperative collision warning systems, rely on beaconing to provide situational awareness that is needed to predict and therefore to avoid possible collisions. Beaconing is the continual exchange of vehicle motion-state information, such as position, speed, and heading, which enables each vehicle to track its neighboring vehicles in real time. This work presents a context-aware adaptive beaconing scheme that dynamically adapts the beaconing repetition rate based on an estimated channel load and the danger severity of the interactions among vehicles. The safety, efficiency, and scalability of the new scheme is evaluated by simulating vehicle collisions caused by inattentive drivers under various road traffic densities. Simulation results show that the new scheme is more efficient and scalable, and is able to improve safety better than the existing non-adaptive and adaptive rate schemes. Keywords: VANET; DSRC; Vehicular Safety Communication; Safety Applications; Adaptive Beaconing; Context-Aware 1. Introduction Recent advances in wireless communication technology have resulted in the development of a Cooperative Colli- sion Warning System (CCWS) that can actively prevent accidents, and therefore may improve road safety sig- nificantly. Several concepts and prototypes of the CCWS have been proposed and developed [1-3], demonstrating the technical feasibility of the CCWS. The CCWS works by having vehicles to continually exchange safety mes- sages via wireless ad hoc networks. The safety messages, termed as beacon messages, contain up-to-date vehicle state information, such as position, speed, heading, and other kinematics or motion information. The dissemina- tion of beacon messages, termed as beaconing, allows each vehicle to realize and track the existence and the state information of its neighboring vehicles within a cer- tain range. Using the state information, each vehicle can predict any possible collision and provide early warnings to its driver accordingly. The wireless technology used in the CCWS will be based on the IEEE 802.11 p [4] and the IEEE 1609 Wire- less Access in Vehicular Environments (WAVE) [5] standards. Extensive studies on the performance of the standards [6,7] indicate that the standards can provide an adequate signal reception in an environment with high- speed mobility. However, the standard alone cannot en- sure time-critical message dissemination in dense road traffic conditions, such as in traffic jams. Dense traffic conditions induce a high communication channel load, which causes a higher rate of packet collisions and sig- nificantly deteriorates the communication performance [6]. To ensure fast and reliable delivery of beacon mes- sages to all relevant vehicles in any traffic conditions, it is necessary to develop application level protocols that can utilize the communication channel more efficiently. Typical CCWS and other safety applications assume that a vehicle broadcasts beacon messages periodically at a constant rate of ten messages per second [8]. The con- stant rate beaconing strategy is simple and easy to im- plement, but is not scalable to various road traffic situa- tions. Road traffic is a very dynamic environment, in which the vehicle density can vary significantly over time. If the broadcast rate and other parameters such as radio range and packet size are constant, the communica- tion performance can vary depending on the vehicle den- sity. A dense traffic condition may lead to a high rate of packet loss that can compromise the safety performance of the CCWS significantly. Therefore, to reduce channel congestion and improve communication performance, the beaconing rate should be continuously adapted to the traffic situation [9,10]. Existing rate-adaptive beaconing schemes [11-13] are designed to improve mainly the communication performance. However, they do not con- sider the differences in the danger severity of an interact- tion between two vehicles that may lead to a possible collision. By prioritizing vehicles based on their danger severity, it may be possible to further improve the safety performance. C opyright © 2012 SciRes. IJCNS  A. SEBASTIAN ET AL. 535 In this article, we propose a new context-aware bea- coning scheme that considers the danger severity of ve- hicle interactions in reducing the beaconing rate. For example, Figure 1 shows a simple traffic situation where vehicles v1, v2, and v3 are following each other with an unsafe following distance while vehicles v4 and v5 are moving independently. Assuming a high channel usage in the vicinity, each vehicle needs to cooperatively re- duce their beaconing rate. Because of the unsafe condi- tions, reducing the beaconing rate of vehicle v1 may sig- nificantly increase the possibility of collisions with vehi- cles v2 and v3. In contrast, reducing the beaconing rate of vehicle v5 will not significantly increase the possibility of collisions between v5 and other vehicles. Vehicles that endanger other vehicles such as v1 and v2 should have a higher beaconing rate compared to vehicles that are unlikely to endanger other vehicles, such as v4 and v5. The original contribution of this work is a new bea- coning scheme that continuously adapts the beaconing rate to the estimated channel load and the danger severity of the interactions among vehicles. The objective of this research is to optimize the beaconing rate of each vehicle in order to improve the capability of the CCWS collision prevention in various traffic conditions. The improve- ment is achieved by controlling channel usage to avoid congestion, and most importantly, by prioritizing the most endangered vehicles. The performance of the new scheme is evaluated by simulating vehicle collisions caused by inattentive drivers. Simulation results show that the adaptive rate scheme consistently provides a bet- ter safety level on highways in various traffic densities compared to the existing constant and adaptive rate schemes. The rest of this article is organized as follows: Section 2 introduces the related work and identifies the knowl- edge gap in the literature. Section 3 presents a new con- text-aware scheme for beaconing rate adaptation. The performance of the proposed scheme is evaluated in Sec- tion 4. Section 5 discusses and analyzes the experimental results. Finally, Section 6 concludes this work and pro- poses future research direction. 2. Related Work The IEEE 802.11p WAVE standards [4,5] define a sin- gle control channel to be used exclusively for all safety Figure 1. Example of a simple traffic situation with differing danger severity between vehicles. related communication, which includes beaconing. Since the channel is shared by all communication nodes, bea- coning may saturate the channel bandwidth in a dense traffic situation. To ensure safety, the beacon messages must be prevented from overloading the control channel. In literature, there are two categories of schemes that have been proposed to improve the performance of bea- coning: schemes that increase the effective capacity, and schemes that control the beaconing load. The effective capacity can be increased by controlling the transmission timing to reduce the possibility of packet collisions, improve reception rate, and ensure fairness to channel access time. An example of this approach is a collision-free scheduling of packet transmissions into time slots [14]. Controlling the transmission timing does not prevent channel congestion as it does not reduce or limit the actual beaconing load generated by vehicles. There- fore, it is not the main solution to ensure the function of safety application. The beaconing load can be controlled by tuning vari- ous parameters that contribute to the communication density. Communication density is described as the prod- uct of vehicle density, message size, message generation rate, and transmission range [15]. Since vehicle density is determined based on the actual road traffic conditions, only the three other parameters can be optimized: mes- sage size, message generation rate, and transmission range. Several studies on the effect of these parameters to network performance [9,10,16] indicate the need for adap- tive algorithms to control the channel load by adjusting the parameters dynamically based on the surrounding traffic conditions. The message size can be reduced by utilizing a mes- sage dispatcher to control all data exchanges between ap- plications and prevent the same elements from being transmitted multiple times by different applications [17]. The transmission range can be reduced by adjusting the per-packet transmission power based on the estimated vehicle density on the road [18,19]. The message genera- tion rate (beaconing rate) parameter is the main focus in this article. In contrast to the other two parameters, the message generation rate directly affects the CCWS safety performance. Therefore, the beaconing rate should be minimized without reducing tracking accuracy and com- promising safety. Existing studies of adaptive beaconing rate schemes use the metric of tracking accuracy to measure the safety performance. Their goal is to reduce or control the bea- coning rate while maintaining a sufficient level of track- ing accuracy. Rezaei et al. [20] presented a scheme to adapt the beaconing rate depending on a position predict- tion error. Since the movement of a vehicle is predictable to some degree, a beacon message needs to be sent only when the prediction error is greater than a specified error Copyright © 2012 SciRes. IJCNS  A. SEBASTIAN ET AL. 536 threshold. For example, a prediction error can be caused by a relatively noticeable change of course such as ac- celeration or a change of direction. Armaghan et al. [21] further improved the idea by dynamically adapting the error threshold and the number of estimation steps based on safety distance. Each vehicle estimates its location ahead for several intervals and sends the information along with its actual current position. While the esti- mated information is available, there is no new transmis- sion unless any estimation errors are detected. Note that the defined maximum error can actually be exceeded due to message loss. Considering the dynamic nature of traf- fic density, it is possible that even the reduced beaconing rate is still relatively high enough to cause channel con- gestion. For example, on a wide highway with many lanes, a traffic jam will cause frequent occurrences of a sudden change of movement (stop and go situation) that will result in many beacon messages being sent fre- quently. To maintain a consistent beaconing performance in all traffic situations with varying density, the actual or esti- mated channel load must be considered. In principle, beaconing rate should be reduced when the channel load becomes higher. Saito et al. [11] proposed a scheme that can estimate the channel load based on the number of reception messages and detected reception errors, and adapt the beaconing rate accordingly. Huang et al. [22] proposed a similar scheme that calculates a transmission probability based on the estimated tracking error. The tracking error is stochastically decided depending on the estimated channel load. The approach had been shown to be more scalable to various vehicle densities and can be complemented with a simple adaptive transmission range scheme [12]. All the aforementioned adaptive schemes are unable to prioritize the vehicles that are in a more dangerous situa- tion than vehicles in a relatively safer situation. To ad- dress this problem, we propose a new scheme that uses the vehicle interaction graph [23] to prioritize vehicles in the most danger and improve both the communication and safety performance of the CCWS. Since the tracking accuracy required in preventing a collision depends rela- tively to interactions among vehicles, safety performance is evaluated by simulating the number of potential colli- sions. 3. Beaconing Rate Adaptation Using Context Information Every vehicle repeatedly sends a beacon message to all other vehicles with an interval I between two consecutive transmissions. The beaconing interval I directly deter- mines the beaconing rate, which is the number of mes- sages sent per second. The interval I can be predeter- mined as a constant for all time or can be determined dynamically in real time. A vehicle v1 that receives a beacon message sent by other vehicle v2 at time t1 knows the state of vehicle v2 at time t1. Tracking accuracy is defined as the difference between the state of vehicle v2 at time t1 as tracked by vehicle v1 and the actual state of vehicle v2 at current time tnow = t1 + t. The most relevant metric for tracking accuracy is positional distance error [12,20], which measures the distance between the tracked position and the actual position. Generally, the tracking accuracy is higher if the duration t is shorter, which can be achieved by increasing the reception rate of beacon messages. Since the communication channel capacity is limited, the reception rate cannot be increased indefinitely by in- creasing the beaconing rate, which limits the achievable tracking accuracy. Higher tracking accuracy will result in a more accurate collision prediction [1,24]. As an inaccurate prediction may lead to a collision, tracking accuracy has been used as an indicator to assess the safety performance of bea- coning schemes. However, the possibility of a collision mostly depends on the danger severity of a vehicle’s traf- fic situation. For example, consider a vehicle vs that is in a safe situation as opposed to another vehicle vu that is in an unsafe situation. Vehicle vs has a smaller possibility of being involved in a collision, and therefore vehicle vs does not require its warning or tracking accuracy to be as high as of vehicle v u. One vehicle at a particular time may not require the same tracking accuracy as another vehicle to maintain the same safety performance. Danger severity is determined from a time duration that is available to perform an evasive action before a collision becomes unavoidable, given a particular inter- action between vehicles. A longer duration provides a driver more time and opportunity to react and avoid a possible collision. To optimize channel usage without compromising safety, the beaconing interval I must be made adaptive based on an estimated load and the danger severity. The beaconing interval I of a vehicle can be proportionally adjusted based on the ratio between the danger severity of itself and of its neighboring vehicles. The basic principle is to give the highest priority (short- est interval) to vehicles in the most danger to avoid any possible collisions and at the same time control the chan- nel load. 3.1. System Assumptions This work assumes that every vehicle is equipped with a wireless communication device that complies to the IEEE 802.11 p WAVE standards, which define the pro- tocols for PHY, MAC, and network layers. All the com- munication devices operate in ad hoc mode and there is no roadside infrastructure available. A vehicle is as- sumed to be able to determine its own position on the Copyright © 2012 SciRes. IJCNS  A. SEBASTIAN ET AL. 537 road, with an accuracy suitable for safety purposes, using a combination of a Differential Global Positioning Sys- tem (DGPS) and internal motion sensors [1,2,25]. 3.2. Problem Definition Let v be a subject vehicle and V' be a set of vehicles within one-hop communication range of v. The state of vehicle is defined as a tuple (x, y, w, l, , s, ), where x and y are the position coordinates, w is the width, l is the length, is the heading, s is the speed, and is the maximum deceleration of the vehicle. The identity and state of each vehicle u V' are obtained from a received beacon mes- sage. The state of the subject vehicle v is obtained from its internal positioning system. A set of vehicles V = {v} V' is maintained locally by every subject vehicle v. Given a constant message size S and the physical data rate of wireless communication R, a transmission dura- tion for a single message TSR can be calculated. The duration T excludes the extra time taken by PHY or MAC protocol overhead. For example, a single transmis- sion of a message with a size of 500 bytes using a data rate of 6 Mbps will occupy the communication channel for 0.6 milliseconds. The channel load can be estimated based on the number of nodes in the transmission range of each other n, the message generation rate of each node fi, and the transmission duration T: 1 · n i i T (1) For example, given the number of nodes n = 50, the same generation rate for each node f = 10 Hz, and trans- mission duration T = 0.0006 s, the channel load will be: = 50 10 0.0006 = 0.3. In the CSMA-based protocol such as IEEE 802.11 p, the channel becomes more con- gested as approaches 1. To control the channel load consumed by beaconing, the beaconing rate f for each vehicle must be adapted contextually. At each point in time, the rate f may differ for each vehicle as each vehi- cle may have different neighboring vehicle density and danger severity (i.e., the context information). Therefore, the problem of adaptive beaconing rate can be defined as follows: Input: The set of vehicles V, the transmission dura- tion of a single beacon message T, and the maximum beaconing load max as a parameter to control channel utilization. Output: The beaconing interval I or rate 1 I for each subject vehicle such that max is not exceeded and the most endangered vehicles are assigned with the shortest interval. 3.3. Multi-Vehicle Interaction Graph The danger severity of vehicles in a certain proximity is estimated by finding interactions among multiple vehi- cles. Previously, we have proposed a multi-vehicle inter- action graph model [23] to represent the interaction be- tween multiple vehicles in a specific region and at a point in time. The original model has been extended to include the calculation of the danger severity. The vehicle interaction graph is defined as a weighted directed graph G = (V, E), where V represents the vehicles in a specific area and E represents the interactions among vehicles. An edge eij E represents an interaction between vehicles i and j, where vehicle i is influencing vehicle j. An edge weight ij, 0 < ij ≤ 1 is a real number that in- dicates the danger severity or intensity of the interaction eij. The value of ij = 1 indicates an interaction with the highest severity while ij = 0 indicates no interaction. Each vehicle maintains its own interaction graph. Given the set of vehicles V tracked by each subject vehi- cle, an interaction graph G is constructed by generating the set of edges E and the corresponding edge weight. Initially, each vehicle v creates a graph G = (V, E), where V = {v} and E = . Every time a vehicle v receives a beacon message from other vehicle vi V', vehicle v updates its interaction graph G by enumerating each ve- hicle vj V. For each pair (vi, vj), i ≠ j, the interactions between vi and vj are calculated based on their position, speed, and heading. Depending on the result, an edge eij, eji, or both edges, may be added to the set of edges E. As an example, Figure 2 shows a possible interaction graph that represents the traffic situation shown in Figure 1. An interaction is determined if there is a trajectory contention between a pair of vehicles and their avoidance time is less than or equal to the maximum reaction time Tmax. The avoidance time is the time available for the driver of the influenced vehicle to react in order to avoid the collision. The maximum reaction time Tmax is a pa- rameter that reflects the worst possible reaction time for a driver. The minimum reaction time Tmin reflects the best possible reaction time for a driver. The danger severity, represented as an edge weight , is determined based on the value of scaled proportionally with Tmin and Tmax. Any interaction with an avoidance time less than Tmin will be treated as having the same severity. Based on the statistics [26], this study assumes the value of Tmin = 0.2 s and Tmax = 2.5 s. The following equations are used to calculate the danger severity: min max ,T (2) min max min 1T TT (3) Figure 2. Example of an interaction graph that represents the traffic situation shown Figure 1. Copyright © 2012 SciRes. IJCNS 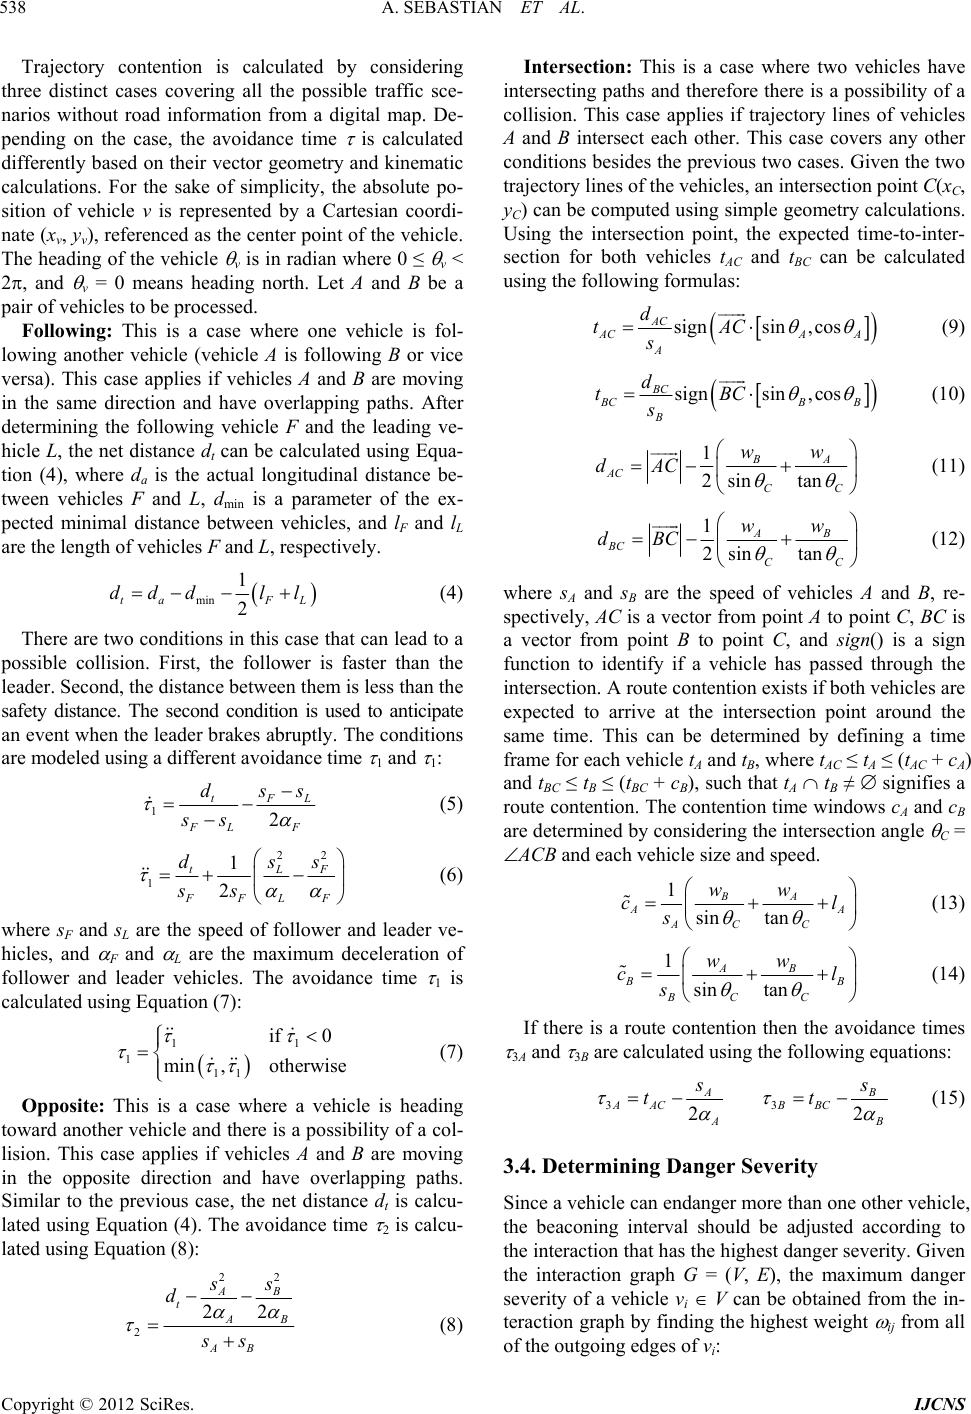 A. SEBASTIAN ET AL. 538 Trajectory contention is calculated by considering three distinct cases covering all the possible traffic sce- narios without road information from a digital map. De- pending on the case, the avoidance time is calculated differently based on their vector geometry and kinematic calculations. For the sake of simplicity, the absolute po- sition of vehicle v is represented by a Cartesian coordi- nate (xv, yv), referenced as the center point of the vehicle. The heading of the vehicle v is in radian where 0 ≤ v < 2, and v = 0 means heading north. Let A and B be a pair of vehicles to be processed. Following: This is a case where one vehicle is fol- lowing another vehicle (vehicle A is following B or vice versa). This case applies if vehicles A and B are moving in the same direction and have overlapping paths. After determining the following vehicle F and the leading ve- hicle L, the net distance dt can be calculated using Equa- tion (4), where da is the actual longitudinal distance be- tween vehicles F and L, dmin is a parameter of the ex- pected minimal distance between vehicles, and lF and lL are the length of vehicles F and L, respectively. 1 2FL ll minta ddd (4) There are two conditions in this case that can lead to a possible collision. First, the follower is faster than the leader. Second, the distance between them is less than the safety distance. The second condition is used to anticipate an event when the leader brakes abruptly. The conditions are modeled using a different avoidance time 1 and 1: 12 t L FL F d s ss (5) 22 LF LF 1 1 2 t FF d s 1 if 0 ot her w is e ss (6) where sF and sL are the speed of follower and leader ve- hicles, and F and L are the maximum deceleration of follower and leader vehicles. The avoidance time 1 is calculated using Equation (7): 1 1 11 min , (7) Opposite: This is a case where a vehicle is heading toward another vehicle and there is a possibility of a col- lision. This case applies if vehicles A and B are moving in the opposite direction and have overlapping paths. Similar to the previous case, the net distance dt is calcu- lated using Equation (4). The avoidance time 2 is calcu- lated using Equation (8): Intersection: This is a case where two vehicles have intersecting paths and therefore there is a possibility of a collision. This case applies if trajectory lines of vehicles A and B intersect each other. This case covers any other conditions besides the previous two cases. Given the two trajectory lines of the vehicles, an intersection point C(xC, yC) can be computed using simple geometry calculations. Using the intersection point, the expected time-to-inter- section for both vehicles tAC and tBC can be calculated using the following formulas: 22 22 AB AB AB 2 t s ss d (8) signsin ,cos AC ACA A A d tAC s (9) signsin ,cos BC BCB B B d tBC s (10) 1 2sin tan BA AC CC ww dAC (11) 1 2 sintan AB BC CC ww dBC (12) where sA and sB are the speed of vehicles A and B, re- spectively, AC is a vector from point A to point C, BC is a vector from point B to point C, and sign() is a sign function to identify if a vehicle has passed through the intersection. A route contention exists if both vehicles are expected to arrive at the intersection point around the same time. This can be determined by defining a time frame for each vehicle tA and tB, where tAC ≤ tA ≤ (tAC + cA) and tBC ≤ tB ≤ (tBC + cB), such that tA tB ≠ signifies a route contention. The contention time windows cA and cB are determined by considering the intersection angle C = ACB and each vehicle size and speed. 1 sin tan BA AA AC C ww cl s (13) 1 sin tan AB BB BC C ww cl s (14) If there is a route contention then the avoidance times 3A and 3B are calculated using the following equations: 33 22 AB AAC BBC AB s tt (15) of the outgoing edges of vi: 3.4. Determining Danger Severity Since a vehicle can endanger more than one other vehicle, the beaconing interval should be adjusted according to the interaction that has the highest danger severity. Given the interaction graph G = (V, E), the maximum danger severity of a vehicle vi V can be obtained from the in- teraction graph by finding the highest weight ij from all Copyright © 2012 SciRes. IJCNS  A. SEBASTIAN ET AL. 539 , max ij j vv E maxii v (16) Using max, each subject vehicle calculates the sum of m aximum weight : max vV v (17) The sum of maxm weight imu reflects a temporary log lcal knowledge of the beaconinoad within the radio range of the subject vehicle. If a vehicle knows the value of in its neighboring area, it can estimate the beacon- ingte of other neighboring vehicles, which is equiva- lent to the beaconing load. The value of ra of each subject vehicle is included in every beacon mesge sent. Hence, each vehicle can obtain the sum of sa for all its neighbor- ing vehicles, defined as v , v . The total sum of danger severity max in itseighboring area is calculated by finding the largest v V n : xmax v vV ma (18) 3.5. Rate-Adaptive Beaconing Protocol e has been Algorithm 1. Context-aware adaptive rate protocol. 1) f 2) if |V| = 1 then 3) Calculate default interval Is using Equation (19) 4) return Is 5) Calculate interval I using Equation (20) 6) if I < Imi n then I ← Imin 7) else if I > Imax then I ← Imax 8) return I 9) procedure SendMessage() 10) Get the vehicle self state v from the positioning system 11) Update(G,v) 12) Create a new beacon message m that contains the current self state 13) Transmit m using WSMP 14) t prev ← tnow 15) I new ← CalculateInterval() 16) Execute SendMessage() after interval Inew 17) procedure ReceiveMessage(m) 18) Retrieve the vehicle state vi from m 19) Update(G,vi) 20) if tprev is define d then 21) Cancel any scheduled transmission 22) I new ← CalculateInterval() 23) Inow ← tnow –tprev 24) if Inow < Inew then 25) Execute SendMessage() after interval (Inew – Inow) 26) else 27) SendMessage() The proposed concept of rate adaptation schem developed and implemented as a Context-aware Adap- tive Rate (CAR) beaconing protocol. Algorithm 1 de- scribes the CAR protocol, which in principle works as follows: unction CalculateInterval() 1) When a vehicle receives a beacon message from as used to uintained bmay not have the s interaction graphs. However, cost likely have similar in- f message repeatedly with a dion tction graph. Whenever the interact- t a min is the lower bound that is uto the smallest rea- sed 126 km/h (35 m/s) can travel 1.75 m within an interval of 50 ms. Tmall enough to ghan two meters. TImax is the upper bound that is u reasonable value. Fo one second t message is always sent at least o- rn byk. The syst cl ced by using the GPS. ehicle speed using Equation (19): nother vehicle, information from the message i tion graph, which is locally mapdate the interac y the vehicle. Two different vehicles ame information in their losely spaced vehicles will m ormation. 2) A vehicle sends a beacon ynamic interval, which is calculated using a funct hat utilizes the intera ion graph is updated or modified, the interval is also re- djusted. interval IThe minimum sed to limit the beaconing interval onable value. For example, a vehicle at spe hissval is s tance error of less t means that the 50 m inter ive a reasonable dis imhe maxum interval sed to limit the interval to the largest or example, the Ix parameter can be set t ma ato ensure th a beacon ne every second. A time tnow is the present or most cur the system clocemockent time give an be globally synchroniz The CalculateInterval() function calculates the beaconing interval based on the danger severity of the current road traffic situation. If a vehicle has no neigh- boring vehicle, which means that there are no other vehi- cles within its communication range, this function returns a default interval I'. The default interval is calculated based on the v max min min if 0 and if otherwise tt t ee ss e s s max II I I (19) where s is vehicle current speed and et is an error toler- ance threshold. A higher speed will result in a smaller interval to keep a possible distance error less than the threshold et. The threshold et is a parameter that can be set based on an assumption of acceptable position or dis- tance error in the CCWS. If a vehicle has one or more neighboring vehicles, this function returns the interval I calculated using Equation (20): max max max maxmax 1 1 IV ITI (20) The formula calculates an interval proportionally based on a vehicle’s danger severity max and the sum of neighboring vehicles’ danger severity max, in which the resulting channel load is restricted to the maximum bea- coning load max. The resulting interval I is bounded to Copyright © 2012 SciRes. IJCNS  A. SEBASTIAN ET AL. 540 the minimum and maximum interval such that Imin ≤ I ≤ Imax. A vehicle v starts sending beacon messages after its engine has been started. A beacon message is transmitted by invoking the SendMessage() procedure. This pro- cedure first acquires current vehicle sel position, speed, and heading, from the positioning system. The Update (G, v) procedure updates and recalculates the ReceiveMessage() procedure is called when a vehicle v receives a beacon message m vehicle vi. This procedure decodes the state of vehicle vi from m and updates the interaction graph G of vehicle v with the extending the ns ing error on neighboring vehicles. To clearly demonstrate fety and communication performances ncy and scalability. A scheme is effi- e, the number of it is received by y gives a better chance for he actual channel usage is ceived by a Ea f state, such as interaction graph G with the new information. A new data packet that encodes the state information is created and transmitted using WAVE Short Message Protocol (WSMP) as defined in the IEEE 1609.3 standard [5]. The time of transmission is kept in tprev. The next beacon transmission is then scheduled by executing the Send Message() procedure after an interval calculated by the CalculateInterval() function. The from another new information. Every time a beacon message is received, it is likely that the interactions among neigh- boring vehicles have changed. Therefore, any scheduled beacon transmission is canceled and the next transmis- sion is scheduled with a new interval. The new interval Inew is calculated using the CalculateInterval() function. The actual current interval Inow is the duration elapsed since the last transmission time tprev until the current time tnow. If the new interval is longer than the actual current interval, the next beacon transmission is then scheduled at time Inew – Inow. Otherwise, a beacon message must be sent immediately by invoking the SendMessage() procedure. 4. Evaluation The performance of the Context-aware Adaptive Rate (CAR) scheme is evaluated by performing an integrated simulation of a vehicular wireless network, vehicles moving on a straight road with multiple lanes, and colli- sions between vehicles caused by unsafe situations. The simulation program is implemented by -3 network simulator (version 3.8) [27]. The performance of the CAR scheme is compared with several Constant Rate (CR) schemes and an existing Probabilistic Adaptive Rate (PAR) scheme [12]. In the CR schemes, beacon messages are periodically sent at a constant interval. Four different intervals were selected and represented by the CR-50 (50 ms interval), CR-100 (100 ms interval), CR-200 (200 ms interval), and CR-500 (500 ms interval) schemes. The PAR scheme is a rela- tively recent adaptive beaconing scheme that improves tracking accuracy under various traffic conditions by cal- culating transmission probability based on suspected track- the benefits of the new context-aware adaptive technique, all the compared schemes are implemented without using any kind of position prediction model. 4.1. Performance Metrics We evaluate the sa in terms of efficie cient if it generates less network load to maintain a cer- tain safety level. A scheme is scalable if it is able to maintain safety and communication performances in various traffic scenarios with different density. The aim of the CCWS is to improve road safety by preventing vehicle collisions caused by the error or lim- ited perception of human drivers. Therefor vehicle collisions is used as the metric to assess the safety performance (as in [28]). A beaconing scheme has a better safety performance if using the scheme results in a smaller number of potential vehicle collisions. The number of potential vehicle collisions is measured by simulating an accident scenario on a typical highway. To study the effect of different beaconing schemes on the number of potential collisions, the simulation is designed in such a way so that a collision will occur only if a bea- con message is not received in time. The communication performance involves the metrics of dissemination latency or delay, actual channel usage, and probability of message reception. The latency is the duration between the time when a beacon message is sent to the MAC layer and the time when other vehicles. A lower latenc a vehicle to avoid a collision. T measured by averaging channel busy time from all nodes during the simulation time. As such, the measured usage includes the PHY and MAC protocols overhead. Higher channel usage increases the possibility of channel con- gestion. The probability of message reception is the prob- ability that a beacon message is successfully re node located at a particular distance from a sender node. Higher probability of message reception indicates fewer packet collisions. A good overall performance is indicated by both safety and communication performance. This means that a good scheme must achieve a low number of collisions, low latency, low channel usage, and high probability of mes- sage reception. However, emphasize is given to the number of potential collisions metric since the ultimate goal of the CCWS is to improve safety. 4.2. Simulation Design and Setup 4.2.1. Wireless Communication ch vehicle repeatedly sends beacon messages during the simulation duration at an interval determined by the beaconing schemes. For example, the CR-100 scheme Copyright © 2012 SciRes. IJCNS  A. SEBASTIAN ET AL. 541 sends a beacon message every 100 milliseconds. The beacon message size is set to a constant value of 500 bytes, excluding the MAC protocol specific header. A constant message size is used to provide a consistent comparison result. The transmission power is configured to 19 dBm. The probabilistic Nakagami distribution is selected for the radio propagation loss model, as field tests on highways showed that the Nakagami distribution is suitable to be used on vehicular communication in highway scenarios [19]. The parameter of m = 1 is set to simulate severe fading conditions; therefore, demon- strating the beaconing performance in the worst case scenario. The parameters for PHY and MAC protocols are set according to the IEEE 802.11 p draft standard, which operates at 5.9 GHz on a 10 MHz control channel (CCH). The PHY data rate is configured to 6 Mbps, which is the optimal value for safety communication [29]. The chan- nel switching scheme is currently not implemented, so the CCWS applications can utilize the entire 10 MHz CCH bandwidth. The MAC layer is configured to ad hoc A mechanism as riority for beacon mes- mode with QoS support using the EDC described in IEEE 802.11e. The p sages is set to AC_VI (second highest). All beaconing schemes are implemented as application level protocols in the simulator that use the IEEE 1609 WAVE Short Message Protocol (WSMP) [5]. Common configuration parameters related to communication are summarized in Table 1. 4.2.2. Road Traffic and Accident Scenario The simulation of vehicles moving on a road is staged on a typical multi-lane 2 km highway as illustrated in Fig- ure 3. To demonstrate the scalability of the CAR scheme, five scenarios with different average vehicle densities are evaluated: VD-30, VD-60, VD-90, VD-120, and VD-150. The vehicle density starts from 30 vehicles/km (VD-30) up to 150 vehicles/km (VD-150). Each scenario is de- signed with different numbers of vehicles and lanes to create a realistic situation with a desired density. Table 2 shows the parameters of the scenarios. The number of Table 1. Common configuration parameters. Parameter Value PHY and MAC protocol 802.11 p 802.11p data rate 6 Mbps Propagation loss model 1 Three log distance Propagation loss model 2 Nakagami Transmission power 19 dBm Beacon message size 500 bytes Beacon priority level AC_VI CAR parameters Imin = 50 ms, Imax = 1000 ms vehicles on each lane is randomized. Vehicles on the same lane travel at the same speed, which is determined based on the vehicle density. The distance between two alue is en- void tnce of the CC by ahat some drivers e distracted or inatten- ter canptly react to avoid a cleading vehless they are warned bent the con, the CCWS must wright of warning i the ate of neighboring vate beacones were not promptly rng calcull be inaccurate, and a cocur accordinTherefore, the safety perfferent bng schemes can be e the numbe that consecutive vehicles di,j is random, but the v sured to be greater than the required safety distance. As such, a collision is always avoidable provided that a beacon message is received on time. For each scenario, simulations with different random seeds were performed 50 times. Each simulation instance uses a random road traffic situation (random speed and inter-vehicle dis- tance). Results from the simulation are averaged from the 50 runs. The simulation implements a basic CCWS function for each vehicle. If a collision is likely to occur, the CCWS arns the driver, which will then stop the vehicle to w ahe collision. To evaluate the safety performa WS, collisions between vehicles are simulated ssuming tbecom ive. A distracted drivnot prom ollision with a y the CCWS. To prev icle, un llisio arn the driver at the time. The timing s calculated based ontracked st ehicles. If up-to-d messag eceived, the warniation wil llision may oc formance of di gly. eaconi valuated basedr of potential collisions cannot be prevented. The percentage of distracted or inattentive drivers in each simulation instance is determined using a parameter. The performance of the beaconing schemes can be fully demonstrated by using a worst case scenario that as- sumes all the drivers are inattentive. However, to make the simulation more realistic, the number of inattentive m lane Figure 3. Illustration of the simulated highway scenarios. Table 2. Specific parameters for scenarios with different vehicle densities. Scenario Number of vehicles Number of lanes Speed variation range (m/s2) VD-30 60 2 25 - 30 VD-60 120 3 15 - 25 VD-90 180 3 10 - 15 VD-120 240 6 15 - 25 VD-150 300 6 10 - 15 Copyright © 2012 SciRes. IJCNS 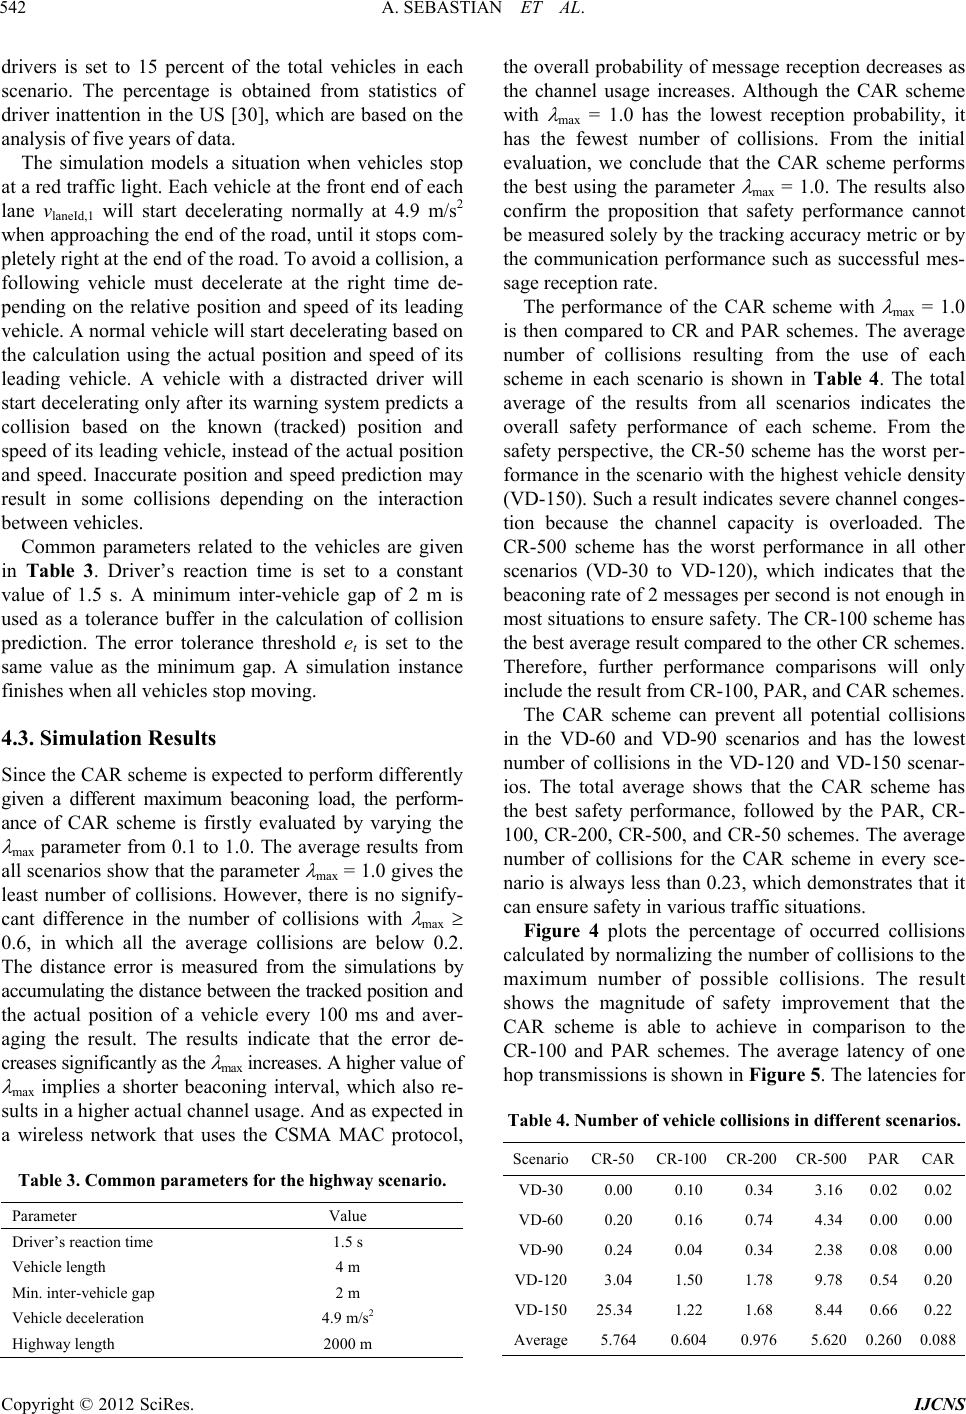 A. SEBASTIAN ET AL. 542 drivers is set to 15 percent of the total vehicles in each scenario. The percentage is obtained from statistics of dri letely right at the end of the road. To avoid a collision, a following vehicle must decelerate at the right time de- pending on the relative position and speed of its leading vehicle. A normal vehicle will start decelerating based on the calculation using the actual position and speed of its leading vehicle. A vehicle with a distracted driver will start decelerating only after its warning system predicts a c eed of its leading vehicle, instead of the actual position ollisions depending on the interaction between vehic n pa relatehe vehin in . Drivs reaction time is set tot value of 1.5 s. A minimum inter-vehicle gap of 2 m is use toleranffer in thcalculationision pre. The olerance threshold et is set to the sae as thinimum g A simulattance finin allcles stop mng. P ver inattention in the US [30], which are based on the analysis of five years of data. The simulation models a situation when vehicles stop at a red traffic light. Each vehicle at the front end of each lane vlaneId,1 will start decelerating normally at 4.9 m/s2 when approaching the end of the road, until it stops com- p ollision based on the known (tracked) position and sp and speed. Inaccurate position and speed prediction may result in some c les. rametersCommod to tcles are give Table 3er’ a constan d as ace bue of coll dictionerror t me value map.ion ins shes whe vehiovi 4.3. Simulation Results Since the CAR scheme is expected to perform differently given a different maximum beaconing load, the perform- ance of CAR scheme is firstly evaluated by varying the max parameter from 0.1 to 1.0. The average results from all scenarios show that the parameter max = 1.0 gives the least number of collisions. However, there is no signify- cant difference in the number of collisions with max 0.6, in which all the average collisions are below 0.2. The distance error is measured from the simulations by accumulating the distance between the tracked position and the actual position of a vehicle every 100 ms and aver- aging the result. The results indicate that the error de- creases significantly as the max increases. A higher value of max implies a shorter beaconing interval, which also re- sults in a higher actual channel usage. And as expected in a wireless network that uses the CSMA MAC protocol, Table 3. Common parameters for the highway scenario. arameter Value Driver’s reaction time 1.5 s Vehicle length 4 m Min. inter-vehicle gap 2 m Vehicle deceleration 4.9 m/s2 Highway length 2000 m the overall probability of message reception decreases as the channel usage increases. Although the CAR scheme tion probability, it r scen e beaconing rate of 2 messages per second enough in msure safety. The CR-scheme has the best average result compared to the otR schemes. Terformance comparonly iom CR-100, PAR, a schemes. heme can prevent all pcollisions with max = 1.0 has the lowest recep has the fewest number of collisions. From the initial evaluation, we conclude that the CAR scheme performs the best using the parameter max = 1.0. The results also confirm the proposition that safety performance cannot be measured solely by the tracking accuracy metric or by the communication performance such as successful mes- sage reception rate. The performance of the CAR scheme with max = 1.0 is then compared to CR and PAR schemes. The average number of collisions resulting from the use of each scheme in each scenario is shown in Table 4. The total average of the results from all scenarios indicates the overall safety performance of each scheme. From the safety perspective, the CR-50 scheme has the worst per- formance in the scenario with the highest vehicle density (VD-150). Such a result indicates severe channel conges- ion because the channel capacity is overloaded. The t CR-500 scheme has the worst performance in all othe arios (VD-30 to VD-120), which indicates that th is not ost situations to en100 her C herefore, further pisons will nclude the result frnd CAR The CAR scotential in the VD-60 and VD-90 scenarios and has the lowest number of collisions in the VD-120 and VD-150 scenar- ios. The total average shows that the CAR scheme has the best safety performance, followed by the PAR, CR- 100, CR-200, CR-500, and CR-50 schemes. The average number of collisions for the CAR scheme in every sce- nario is always less than 0.23, which demonstrates that it can ensure safety in various traffic situations. Figure 4 plots the percentage of occurred collisions calculated by normalizing the number of collisions to the maximum number of possible collisions. The result shows the magnitude of safety improvement that the CAR scheme is able to achieve in comparison to the CR-100 and PAR schemes. The average latency of one hop transmissions is shown in Figure 5. The latencies for Table 4. Number of vehicle collisions in different scenarios. ScenarioCR-50CR-100 CR-200 CR-500 PARCAR VD-300.00 0.10 0.34 3.16 0.020.02 VD-600.20 0.16 0.74 4.34 0.000.00 VD-900.24 0.04 0.34 2.38 0.080.00 VD-1203.04 1.50 1.78 9.78 0.540.20 VD-15025.341.22 1.68 8.44 0.660.22 Average5.7640.604 0.976 5.620 0.2600.088 Copyright © 2012 SciRes. IJCNS 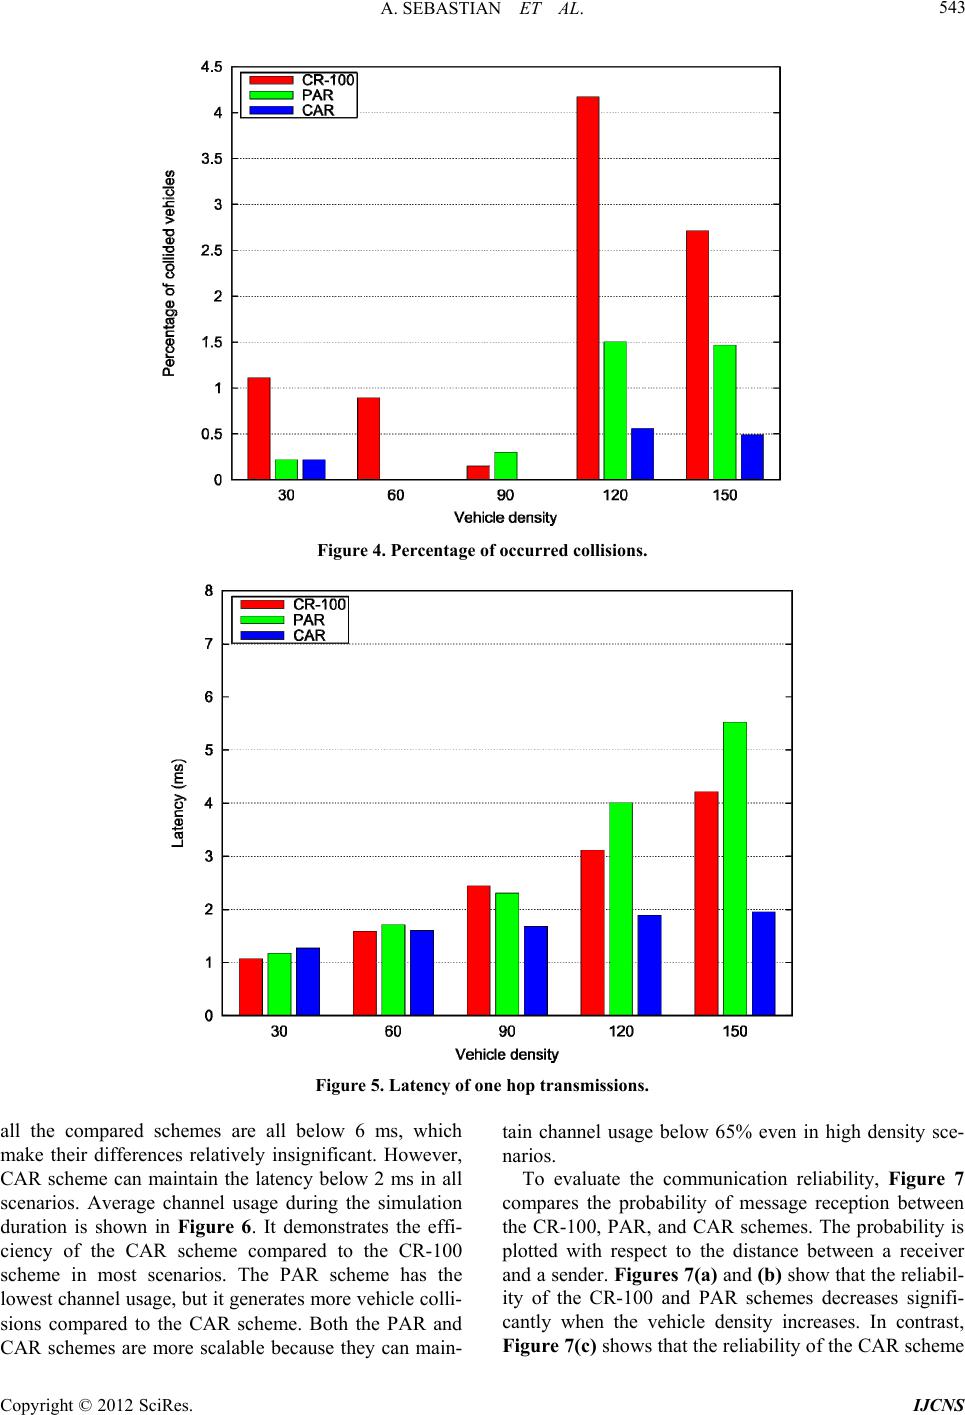 A. SEBASTIAN ET AL. Copyright © 2012 SciRes. IJCNS 543 Figure 4. Percentage of occurred collisions. Figure 5. Latency of one hop transmissions. all the compared schemes are all below 6 ms, which make their differences relatively insignificant. However, CAR scheme can maintain the latency below 2 ms in all scenarios. Average channel usage during the simulation duration is shown in Figure 6. It demonstrates the effi- ciency of the CAR scheme compared to the CR-100 scheme in most scenarios. The PAR scheme has the lowest channel usage, but it generates more vehicle colli- sions compared to the CAR scheme. Both the PAR and CAR schemes are more scalable because they can main- tain channel usage below 65% even in high density sce- narios. To evaluate the communication reliability, Figure 7 compares the probability of message reception between the CR-100, PAR, and CAR schemes. The probability is plotted with respect to the distance between a receiver and a sender. Figures 7(a) and (b) show that the reliabil- ity of the CR-100 and PAR schemes decreases signifi- cantly when the vehicle density increases. In contrast, Figure 7(c) shows that the reliability of the CAR scheme 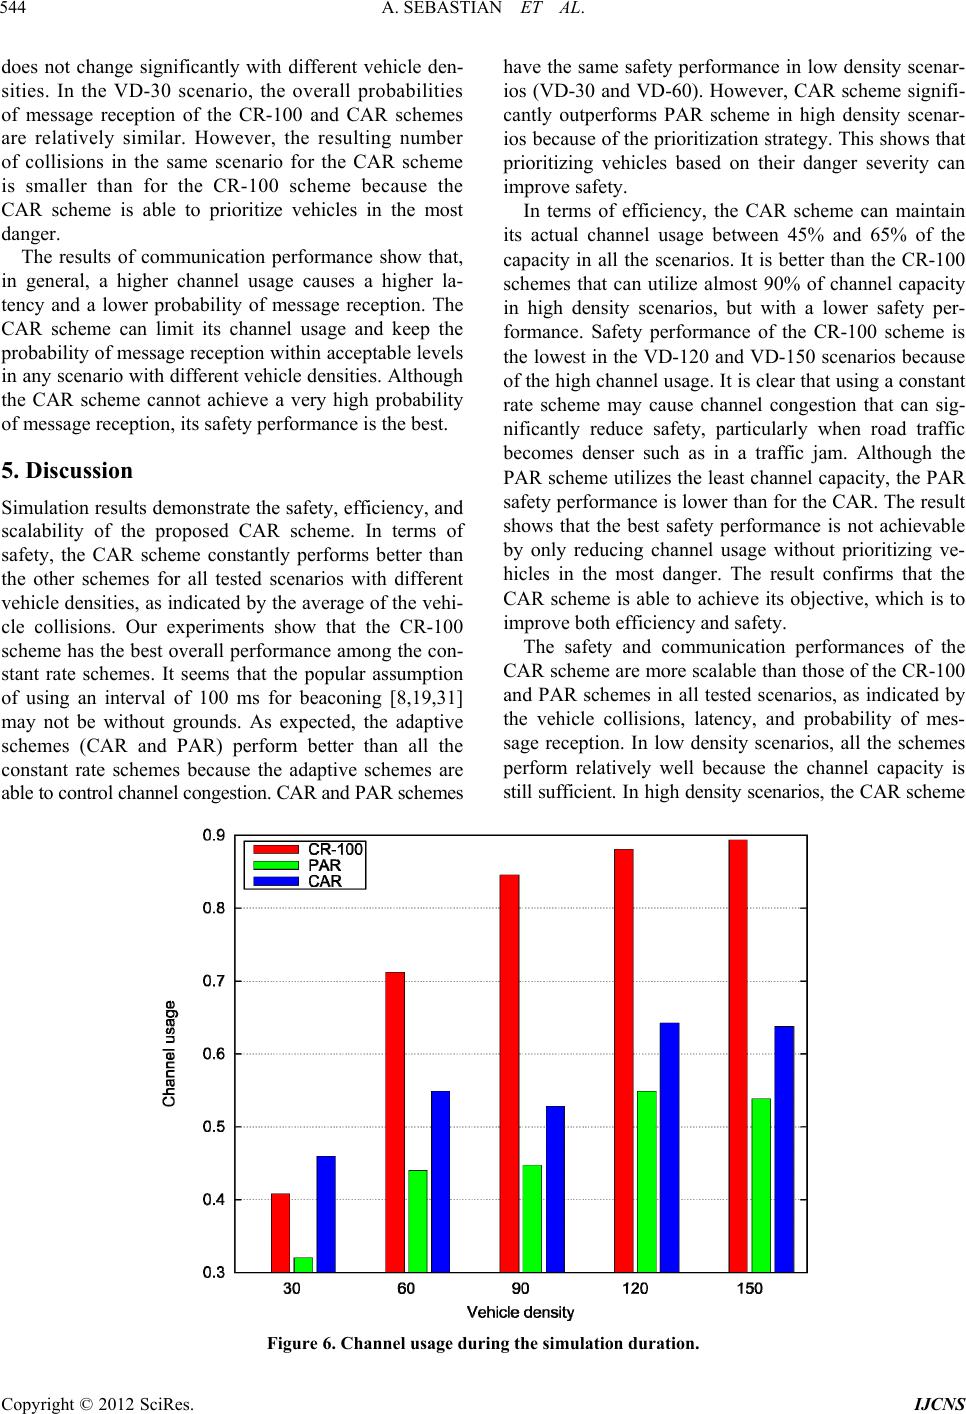 A. SEBASTIAN ET AL. 544 does not change significantly with different vehicle den- sities. In the VD-30 scenario, the overall probabilities of message reception of the CR-100 and CAR schemes are relatively similar. However, the resulting number of collisions in the same scenario for the CAR scheme is smaller than for the CR-100 scheme because the CAR scheme is able to prioritize vehicles in the most danger. The results of communication performance show that, in general, a higher channel usage causes a higher la- tency and a lower probability of message reception. The CAR scheme can limit its channel usage and keep the probability of message reception within acceptable levels in any scenario with different vehicle densities. Although the CAR scheme cannot achieve a very high probability of message reception, its safety performance is the best. 5. Discussion Simulation results demonstrate the safety, efficiency, and scalability of the proposed CAR scheme. In terms of safety, the CAR scheme constantly pe e other schemes for all tested scenarios with different have the same safety performance in low density scenar- ios (VD-30 and VD-60). However, CAR scheme signifi- cantly outperforms PAR scheme in high density scenar- ios because of the prioritization strategy. This shows that prioritizing vehicles based on their danger severity can improve safety. In terms of efficiency, the CAR scheme can maintain its actual channel usage between 45% and 65% of the capacity in all the scenarios. It is better than the CR-100 schemes that can utilize almost 90% of channel capacity in high density scenarios, but with a lower safety per- formance. Safety performance of the CR-100 scheme is the lowest in the VD-120 and VD-150 scenarios because of the high channel usage. It is clear that using a constant rate scheme may cause channel congestion that can sig- nificantly reduce safety, particularly when road traffic becomes denser such as in a traffic jam. Although the PAR scheme utilizes the least channel capacity, the PAR safety performance is lower than for the CAR. The result shows that the best safety performat achievable hannel usage without prioritizing ve- anger. The result confirms that the and PAR schemes in all tested scenarios, as indicated by ions, latency, and probability of mes- rforms better than by only reducing c hicles in the most d th vehicle densities, as indicated by the average of the vehi- cle collisions. Our experiments show that the CR-100 scheme has the best overall performance among the con- stant rate schemes. It seems that the popular assumption of using an interval of 100 ms for beaconing [8,19,31] may not be without grounds. As expected, the adaptive schemes (CAR and PAR) perform better than all the constant rate schemes because the adaptive schemes are able to control channel congestion. CAR and PAR schemes nce is no CAR scheme is able to achieve its objective, which is to improve both efficiency and safety. The safety and communication performances of the CAR scheme are more scalable than those of the CR-100 the vehicle collis sage reception. In low density scenarios, all the schemes perform relatively well because the channel capacity is still sufficient. In high density scenarios, the CAR scheme ring the simulation duration. Figure 6. Channel usage du Copyright © 2012 SciRes. IJCNS 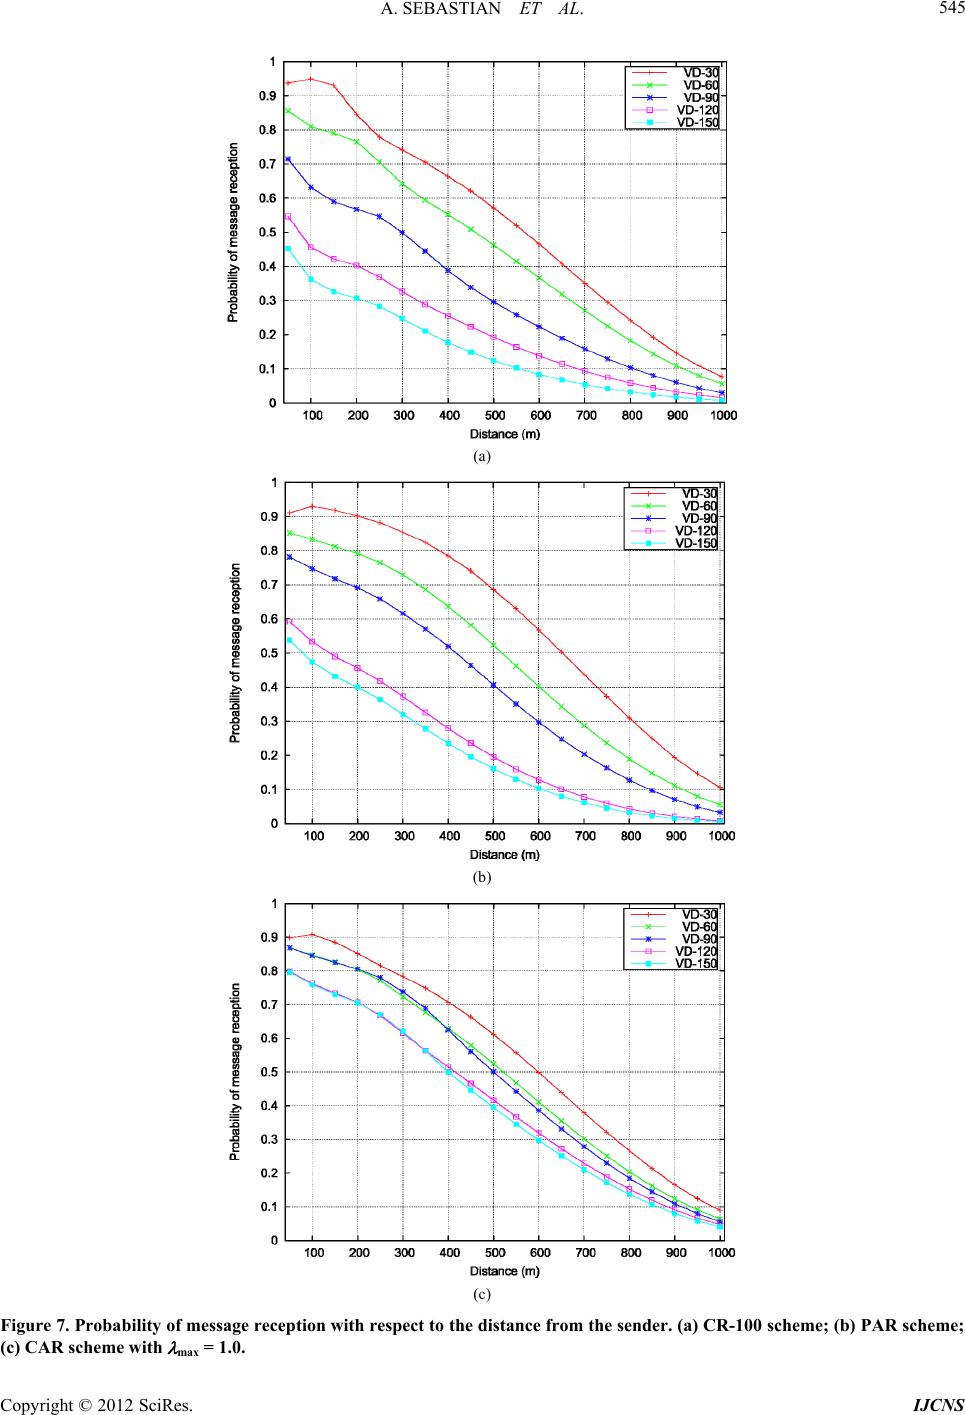 A. SEBASTIAN ET AL. 545 (a) (b) (c) Figure 7. Probability of message reception with respect to the distance from the sender. (a) CR-100 scheme; (b) PAR scheme; (c) CAR scheme with max = 1.0. Copyright © 2012 SciRes. IJCNS  A. SEBASTIAN ET AL. Copyright © 2012 SciRes. IJCNS 546 significantly outperforms all the other schemes. The av- erage number of collisions indicates the safety perform- ance for all the scenarios. The CAR scheme comes with the smallest average number of collisions of 0.088, fol- lowed by the PAR scheme with an average number of collisions of 0.260, which is almost three times larger than the CAR’s result. The CAR scheme has the best safety performance in almost all scenarios. Figure 5 shows that the latency for the CAR scheme is kept at below 2 ms in all scenarios while the latency for the CR-100 and PAR schemes can exceed 3 ms in some sce- narios. The CAR scheme can ensure a more stable and rela- tively high probability of message reception in all scenarios. The result demonstrates the scalability of the CAR scheme to ensure the CCWS safety and communication perfor- mances under various road traffic conditions. It is expected that the maximum beaconing load pa- rameter max cannot control the channel usage precisely because each vehicle only relies on its own local one-hop knowledge. For max ≤ 0.3, the actual channel usage is slightly more than the specified limit. For max > 0.3, the actual channel usage is getting much lower than the specified limit as its value increases. The discrepancy is reasonable because the parameter max is used just as a maximum limit of the channel usage estimation. Since the beaconing interval is bounded between 50 ms and 1000 ms, the maximum limit may not be reached in some situations, such as when vehicles are not moving. The objective of the CAR scheme is not about precise control of the actual channel usage. 6. Conclusions In this article, we presented a new context-aware adaptive beaconing rate scheme to improve the performance of vehicular safety communication. The original contribution of this research is a new method to adapt the beaconing rate dynamically to the context, which includes the esti- mated channel load and the danger severity. The pro- posed scheme estimates the danger severity of each vehi- cle by using the interaction graph model. Vehicles with the highest danger severity are facing the highest risk of collision, and therefore must be prioritized. The beacon messages are sent at a shorter interval for these vehicles to increase their chance to avoid a possible collision. Simulation results have demonstrated that the pro- posed scheme outperforms both the existing adaptive rate and non-adaptive rate schemes in terms of the efficiency, scalability, and safety. The proposed scheme is able to reduce the potential collision rate significantly, and there- fore improve safety. Efficiency is demonstrated by hav- ing a lower channel usage compared to the existing schemes of a similar safety performance. Scalability is ss various scenarios with different vehicle densities. The context-aware adaptive scheme can be extended by incorporating existing ideas and concepts to improve the beaconing performance. In future work, we will study the benefits of combining our proposed scheme with a prediction scheme that uses a threshold policy to further reduce the beaconing rate and an aggregation or piggy- backing scheme to improve the successful message re- ception rate. To further improve the beaconing efficiency, the next step would be to investigate an extended scheme that adapts both the repetition interval and the transmis- sion power. 7. Acknowledgements This research was supportedy Queensland University of Technology (QUT) and the Commonwealth of Austra- lia, through the Cooperative Research Center for Ad- vanced Automotive Technology (AutoCRC). Computa- tional resources and services used in this work were pro- vided by the High Performance Computing and Research Support Unit, QUT, Brisbane, Australia. REFERENCES [1] H. S. Tan and J. Huang, “DGPS-Based Vehicle-to-Vehicle Cooperative Collision Warning: Engineering Feasibility Viewpoints,” IEEE Transactions on Intelligent Trans- portation System, Vol. 7, No. 4, 2006, pp. 415-428. doi:10.1109/TITS.2006.883938 demonstrated by having a relatively consistent safety and communication performance acro b [2] R. Sengupta, S. Rezaei, S. E. Shladover, D. Cody, S. Dickey and H. Krishnan, “Cooperative Collision Warning Systems: Concept Definition and Experimental Imple- mentation,” Journal of Intelligent Transportation Systems, Vol. 11, No. 3, 2007, pp. 143-155. doi:10.1080/15472450701410452 [3] G. K. Mitropoulos, I. S. Karanasiou, A. Hinsberger, F. Aguado-Agelet, H. Wieker, H.-J. Hilt, S. Mammar and G. Noecker, “Wireless Local Danger Warning: Cooperative Foresighted Driving Using Intervehicle Communication,” IEEE Transactions on Intelligent Transportation Systems, Vol. 11, No. 3, 2010, pp. 539-553. doi:10.1109/TITS.2009.2034839 [4] “IEEE 802.11 Standard Amendment 6: Wireless Access in Vehicular Environments,” IEEE Std. 802.11p, 2010. [5] “IEEE Standard for Wireless Access in Vehicular Envi- ronments (WAVE)—Networking Services,” IEEE Std. 1609.3, 2010, pp. 1-144. [6] J. Yin, T. ElBatt, G. Yeung, B. Ryu, S. Habermas, H. Krishnan and T. Talty, “Performance Evaluation of Safety Applications over DSRC Vehicular Ad Hoc Networks,” Proceedings of the 1st ACM International Workshop on VANET, Philadelphia, 1 October 2004. [7] P. Alexander, D. Haley and A. Grant, “Cooperative Intel- ligent Transport Systems: 5.9-Ghz Field Trials,” Pro- 1235. doi:10.1109/JPROC.2011.2105230 ceedings of the IEEE, Vol. 99, No. 7, 2011, pp. 1213-  A. SEBASTIAN ET AL. 547 [8] The CAMP Vehicle Safety Communications Consortium, “Vehicle Safety Communications Project—Task 3 Final Report—Identify Intelligent Vehicle Safety Applications Enabled by DSRC,” Tech. Rep. DOT HS 809 859, NHTSA, US Department of Transportation, Washington, 2005. [9] S. Yousefi, M. Fathy and A. Benslimane, “Performance of Beacon Safety Message Dissemination in Vehicular Ad Hoc Networks (VANETs),” Journal of Zhejiang Uni- versity—Science A, Vol. 8, No. 12, 2007, pp. 1990-2004. [10] M. van Eenennaam, W. K. Wolterink, G. Karagiannis and G. Heijenk, “Exploring the Solution Space of Beaconing in VANETs,” Proceedings of the IEEE Vehicular Net- working Conference, Tokyo, 28-30 October s2009, pp. 1-8. doi:10.1109/VNC.2009.5416370 [11] M. Saito, J. Tsukamoto, T. Umedu and T. Higashino, “Design and Evaluation of Intervehicle Dissemination Protocol for Propagation of Preceding Traffic Informa- tion,” IEEE Transactions on Intelligent Transportation Systems, Vol. 8, No. 3, 2007, pp. 379-390. doi:10.1109/TITS.2007.902650 [12] C.-L. Huang, Y. P. Fallah, R. Sengupta and H. Krishnan, “Adaptive Intervehicle Communication Control for Co- operative Safety Systems,” IEEE Network, Vol. 24, No. 1, 2010, pp. 6-13. doi:10.1109/MNET.2010.5395777 [13] R. K. Schmidt, T. Leinmüller, E. Schoch, F. Kargl and G. Schäfer, “Exploration of Adaptive Beaconing for Effi- cient Intervehicle Safety Communication,” IEEE Network, Vol. 24, No. 1, 2010, pp. 14-19. doi:10.1109/MNET.2010.5395778 [14] M. van Eenennaam, G. Karagiannis and G. Heijenk, “To- wards Scalable Beaconing in VANETs,” Proceedings of the 4th ERCIM Workshop on eMobility, Luleå, 31 May iwal, A. Meier, W. Holfelder and R. Herr- 2010, pp. 103-108. [15] D. Jiang, V. Tal twich, “Design of 5.9 Ghz DSRC-Based Vehicular Safety Communication,” IEEE Wireless Communications, Vol. 13, No. 5, 2006, pp. 36-43. doi:10.1109/WC-M.2006.250356 [16] F. Schmidt-Eisenlohr, M. Torrent-Moreno, J. Mittag and H. Hartenstein, “Simulation Platform for Inter-Vehicle Communications and Analysis of Periodic Information Exchange,” Proceedings of the 4th Annual Conference on Wireless on Demand Network Systems and Services, Obergurgl, 24-26 January 2007, pp. 50-58. doi:10.1109/WONS.2007.340475 [17] C. L. Robinson, D. Caveney, L. Caminiti, G. Baliga, K. Laberteaux and P. R. Kumar, “Efficient Message Compo- sition and Coding for Cooperative Vehicular Safety Ap- plications,” IEEE Transactions on Vehicular Technology, Vol. 56, No. 6, 2007, pp. 3244-3255. doi:10.1109/TVT.2007.907325 [18] J. Mittag, F. Schmidt-Eisenlohr, M. Killat, J. Härri and H. Hartenstein, “Analysis and Design of Effective and Low- Overhead Transmission Power Control for VANETs,” Proceedings of the 5th ACM International Workshop on VANET, San Francisco, 14-19 September 2008. doi:10.1145/1410043.1410051 [19] M. Torrent-Moreno, J. Mittag, P. Santi and H. Hartenstein, “Vehicle-to-Vehicle Communication: Fair Transmit Power Control for Safety-Critical Information,” IEEE Transac- tions on Vehicular Technology, Vol. 58, No. 7, 2009, pp. 3684-3703. doi:10.1109/TVT.2009.2017545 [20] S. Rezaei, R. Sengupta, H. Krishnan, X. Guan and R. Bhatia, “Tracking the Position of Neighboring Vehicles Using Wireless Communications,” Transportation Re- search Part C: Emerging Technologies, Vol. 18, No. 3, 2009, pp. 335-350. doi:10.1016/j.trc.2009.05.010 [21] M. Armaghan, M. Fathy and S. Yousefi, “Improving the Performance of Beacon Safety Message Dissemination in Vehicular Networks Using Kalman Filter Estimation,” In: D. Slezak, et al., Eds., Communication and Networking, Springer, Berlin Heidelberg, 2009, pp. 74-82. 44-0_10doi:10.1007/978-3-642-108 R. Sengupta, and H. Krishnan, the IEEE Intelli- gent Vehicles Symposium, Xi’an, 3-5 June 2009. [24] J. Huang and ommunication Re- liability on a Warning System,” [22] C.-L. Huang, Y. P. Fallah, “Information Dissemination Control for Cooperative Ac- tive Safety Applications in Vehicular Ad-Hoc Networks,” Proceedings of the IEEE Gl obal Telecommunications Con- ference, Honolulu, 30 November-4 December 2009, pp. 1-6. [23] A. Sebastian, M. Tang, Y. Feng and M. Looi, “Multi- Vehicles Interaction Graph Model for Cooperative Colli- sion Warning System,” Proceedings of H.-S. Tan, “Impact of C Cooperative Collision Proceedings of the IEEE Intelligent Transportation Sys- tems Conference, Seattle, 30 September-3 October 2007, pp. 355-360. doi:10.1109/ITSC.2007.4357731 [25] N. M. Drawil and O. Basir, “Inte rvehicle-Co mmunica Assisted Localization,” IEEE Trtion- ansactions on Intelligent Transportation Systems, Vol. 11, No. 3, 2010, pp. 678- 691. doi:10.1109/TITS.2010.2048562 [26] M. Green, “‘How Long Does It Take to Stop?’ Methodo- logical Analysis of Driver Perception-Brake Times,” Transportation Human Factors, Vol 195-216. . 2, No. 2, 2000, pp. doi:10.1207/STHF0203_1 [27] “The ns-3 Network Simulator,” 2011. http://www.nsnam.org [28] S. Biswas, R. Tatchikou and F. Dion, “Vehicle-to-Vehicle Wireless Communication Protocols for Enhancing High- way Traffic Safety,” IEEE Communications Magazine, Vol. 44, No. 1, 2006, pp. 74-82. doi:10.1109/MCOM.2006.1580935 [29] D. Jiang, Q. Chen and L. Delgrossi, “Optimal Data Rate Selection for Vehicle Safety Communications,” Proceed- ings of the 5th ACM International Workshop on VANET, San Francisco, 14-19 September 2008, pp. 30-38. [30] J. C. Stutts, D. W. Reinfurt, L. Staplin and E. A. Rodgman, “The Role of Driver Distraction in Traffic Crashes,” AAA Foundation for Traffic Safety, Washington DC, 2001. http://www.aaafoundation.org/pdf/distraction.pdf [31] I. Chisalita and N. Shahmehri, “On the Design of Safety Communication Systems for Vehicles,” IEEE Transac- tions on Systems, Man and Cybernetics, Part A, Vol. 37, No. 6, 2007, pp. 933-945. doi:10.1109/TSMCA.2007.897586 Copyright © 2012 SciRes. IJCNS
|