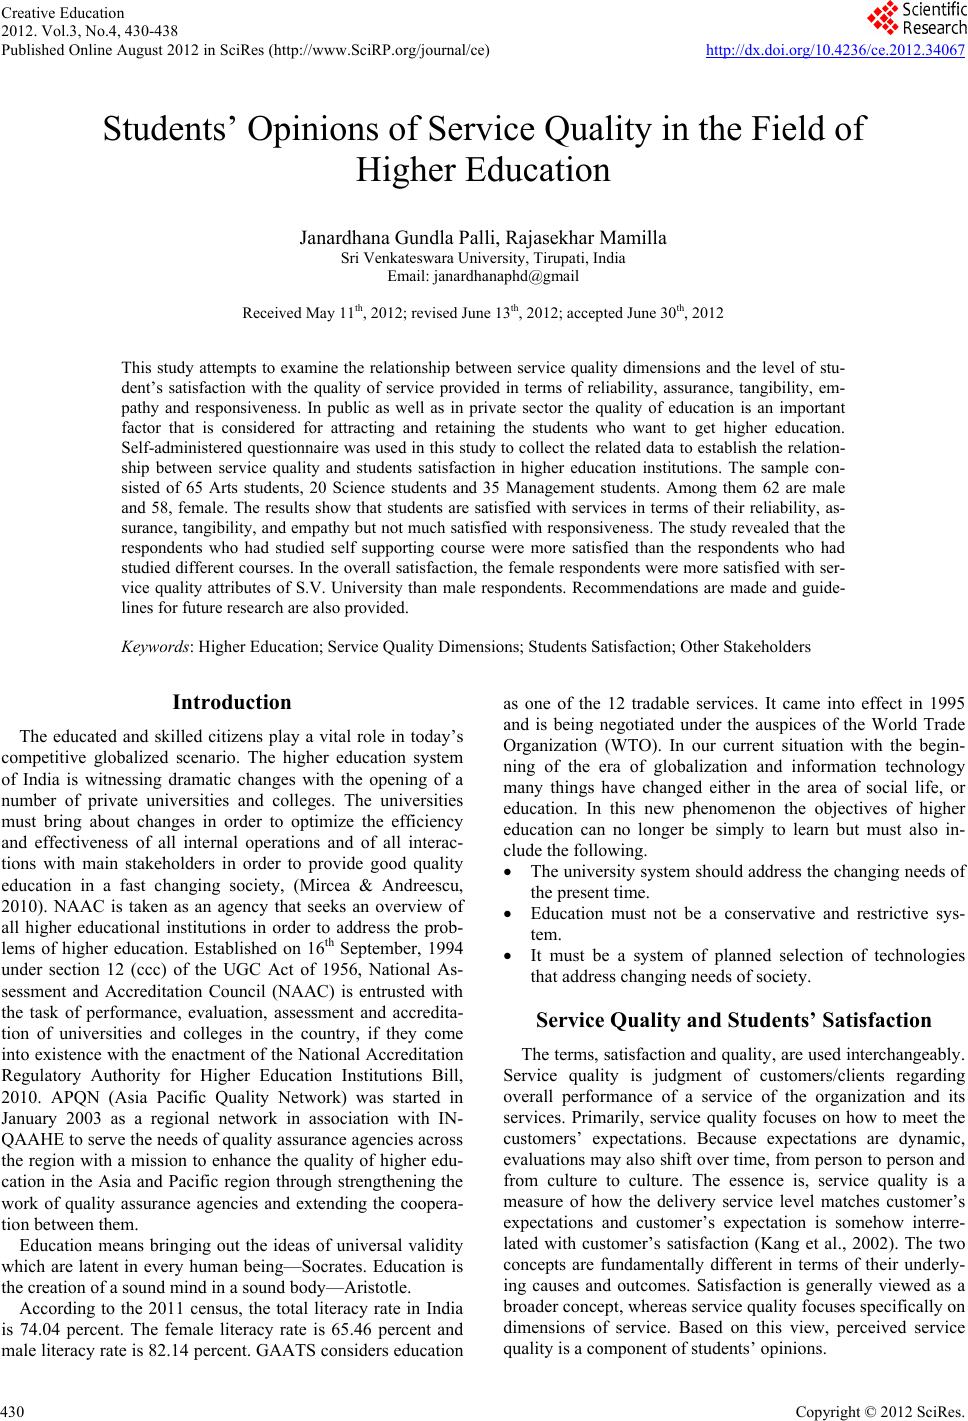
 Creative Education 2012. Vol.3, No.4, 430-438 Published Online August 2012 in SciRes (http://www.SciRP.org/journal/ce) http://dx.doi.org/10.4236/ce.2012.34067 Copyright © 2012 SciRes. 430 Students’ Opinions of Service Quality in the Field of Higher Education Janardhana Gundla Palli, Rajasekhar Mamilla Sri Venkateswara University, Tirupati, India Email: janardhanaphd@gmail Received May 11th, 2012; revised June 13th, 2012; accepted June 30th, 2012 This study attempts to examine the relationship between service quality dimensions and the level of stu- dent’s satisfaction with the quality of service provided in terms of reliability, assurance, tangibility, em- pathy and responsiveness. In public as well as in private sector the quality of education is an important factor that is considered for attracting and retaining the students who want to get higher education. Self-administered questionnaire was used in this study to collect the related data to establish the relation- ship between service quality and students satisfaction in higher education institutions. The sample con- sisted of 65 Arts students, 20 Science students and 35 Management students. Among them 62 are male and 58, female. The results show that students are satisfied with services in terms of their reliability, as- surance, tangibility, and empathy but not much satisfied with responsiveness. The study revealed that the respondents who had studied self supporting course were more satisfied than the respondents who had studied different courses. In the overall satisfaction, the female respondents were more satisfied with ser- vice quality attributes of S.V. University than male respondents. Recommendations are made and guide- lines for future research are also provided. Keywords: Higher Education; Service Quality Dimensions; Students Satisfaction; Other Stakeholders Introduction The educated and skilled citizens play a vital role in today’s competitive globalized scenario. The higher education system of India is witnessing dramatic changes with the opening of a number of private universities and colleges. The universities must bring about changes in order to optimize the efficiency and effectiveness of all internal operations and of all interac- tions with main stakeholders in order to provide good quality education in a fast changing society, (Mircea & Andreescu, 2010). NAAC is taken as an agency that seeks an overview of all higher educational institutions in order to address the prob- lems of higher education. Established on 16th September, 1994 under section 12 (ccc) of the UGC Act of 1956, National As- sessment and Accreditation Council (NAAC) is entrusted with the task of performance, evaluation, assessment and accredita- tion of universities and colleges in the country, if they come into existence with the enactment of the National Accreditation Regulatory Authority for Higher Education Institutions Bill, 2010. APQN (Asia Pacific Quality Network) was started in January 2003 as a regional network in association with IN- QAAHE to serve the needs of quality assurance agencies across the region with a mission to enhance the quality of higher edu- cation in the Asia and Pacific region through strengthening the work of quality assurance agencies and extending the coopera- tion between them. Education means bringing out the ideas of universal validity which are latent in every human being—Socrates. Education is the creation of a sound mind in a sound body—Aristotle. According to the 2011 census, the total literacy rate in India is 74.04 percent. The female literacy rate is 65.46 percent and male literacy rate is 82.14 percent. GAATS considers education as one of the 12 tradable services. It came into effect in 1995 and is being negotiated under the auspices of the World Trade Organization (WTO). In our current situation with the begin- ning of the era of globalization and information technology many things have changed either in the area of social life, or education. In this new phenomenon the objectives of higher education can no longer be simply to learn but must also in- clude the following. The university system should address the changing needs of the present time. Education must not be a conservative and restrictive sys- tem. It must be a system of planned selection of technologies that address changing needs of society. Service Quality and Students’ Satisfaction The terms, satisfaction and quality, are used interchangeably. Service quality is judgment of customers/clients regarding overall performance of a service of the organization and its services. Primarily, service quality focuses on how to meet the customers’ expectations. Because expectations are dynamic, evaluations may also shift over time, from person to person and from culture to culture. The essence is, service quality is a measure of how the delivery service level matches customer’s expectations and customer’s expectation is somehow interre- lated with customer’s satisfaction (Kang et al., 2002). The two concepts are fundamentally different in terms of their underly- ing causes and outcomes. Satisfaction is generally viewed as a broader concept, whereas service quality focuses specifically on dimensions of service. Based on this view, perceived service quality is a component of students’ opinions.  J. G. PALLI, R. MAMILLA Currently, higher educational institutes are more concerned about the service quality to improve their educational standard. A university is one of the best places for higher education where students get lots of opportunities to develop their career skills, personal growth and unlocking of personal potential. Service quality is a critical element of customer perceptions. In the case of educational services, quality will be the dominant element in customers’ evaluations. The students judge the qual- ity of services based on their perceptions of the outcome quality, interaction quality, and physical environment quality. The di- mensions of service quality have been identified through the pioneering research of Parasuraman, Valarie Zeithaml and Leonard Berry. The five dimensions are reliability, assurance, responsiveness, empathy, and tangibility. A conceptual framework explaining the service quality links to five dimensions, student’s perception attributes and customer satisfaction is shown in Figure 1 below. Review of Literature According to Zeithaml (1988) satisfaction is the resultant outcome of an institutions’ administrative as well as educa- tional system’s coherent performance. The students will be more satisfied and motivated to complete their studies if the institution provides an environment which facilitates learning i.e. the institution contains proper infrastructure for educational utility created according to certain well established parameters for promoting academic development. According to Wachtel, (1998) the students’ rate their course instructor’s performance and his methodology of teaching as the prime indicators in their educational development and suc- cessful completion of their studies because the higher the intel- lectual ability of the instructor the better will be the students’ evaluation (Edstrom, 2008) and, consequently, the more will be the reliability of the teaching staff. Crawford and Shutler, (1999) they examine service quality as one of the key elements for a higher education institute to achieve success in the competitive market. However, service quality can be poor in higher education due to weak students (poor input), lack of focus in teaching system (poor delivery services), lack of attention paid to performance standards and measurement, unmotivated staff (poor internal evaluation), and neglect of students’ skills. To overcome these problems higher education institutes’ management and staff should be commit- ted to continuous quality improvement in their quality services (academic and administration). All academic and administration members must understand that campus processes need constant review to improve services to customers. They need to believe Service quality Physical environment quality Student satisfaction Outcome quality Situational factor Reliability Assurance Tangibility Empathy Responsiveness Personal factors Figure 1. Sources: service marketing V. A. Zeithaml and Mary Jo Binter. that the work of community members is vital to customer satis- faction, and get feedback, positive or negative, from the cus- tomers (students) for further improvement in higher education services (Bryan, 1996; cited on Ali & Zairi, 2005). Sproule found (2000), teachers’ ability, excellence, coordina- tion and reasonability greatly influence students’ class per- formance. The students’ are greatly influenced by the educa- tional activities their teacher coordinates for them. Shevlin, Banyard, Davies and Griffith (2000). According to Alridge and Rowley (2001), when students’ perceive the institutions’ quality and standardized learning en- vironment facilitated intellectual progress and that appropriate facilities of learning and infrastructure, are provided, their in- terest in their organization will explicitly be retained. Palacio, Menses and Perez (2002), believe that satisfaction actually covers issues of students’ perception and experiences during the college years. While most student satisfaction stud- ies focus on the perspective of customer, researcher is facing a problem of creating a standard definition for student satisfac- tion thus providing a need of customer satisfaction theory to be selected and modified so that it can explain the meaning of student satisfaction (Hom, 2002). Sawyer and Thompson (2003), inclusion of all students of the university programs, in the context of the present study are popular alternative to generate important insights into antece- dents and dimensions of service quality in a higher education context. Using a single university to study students’ attitudes generate valuable insights, which can be used as empirical hy- potheses for representative follow-up studies (Dolnicar 2004). Navarro et al. (2005) mentioned that students evaluate the quality of organization on the basis of tangibility (teachers), reliability and responsiveness (methods of teaching) and man- agement of the institution and these factors have direct influ- ence on the level of students’ satisfaction (opinions). Mahiah et al. (2006) suggest that tangibility, assurance, em- pathy, and responsiveness can increase customer satisfaction towards services rendered by human resource department. Spooreen et al. (2007) posited a view that the organizational harmony, teachers’ intellectual ability, professional develop- ment, transparency in students’ evaluation, feedback and train- ing are the important features that mentally develop the stu- dents. According to Hasan et al. (2008) for quality assurance an in- stitution must train its staff members in a way that may create a sense of facilitation by means of coordination, cooperation, compassion and empathy (Jacoby & Chestnut, 1978). Dalton & Denson (2009) found that students’ level of satis- faction increases by working with those course instructors and lecturers who properly handle the assignments, projects, exams and facilitate students’ logical reasoning and aptitude develop- ment. Alves & Raposo (2010), have found that positive perceptions of service quality have a significant influence on student satis- faction and thus a satisfied student would attract more students through word-of-mouth communications. The students can be motivated or inspired from both academic performance as well as the administrative efficiency of their institution. Shekarchizadeh (2011), feels that mostly, higher education institutions seek to provide high quality services in their educa- tional curricula and administrative processes. Therefore, the importance of service quality makes its measurement and its subsequent management an issue of utmost importance. Copyright © 2012 SciRes. 431  J. G. PALLI, R. MAMILLA Objective of the Study This study has three specific objectives. Specifically, the study will solicit the opinions and feelings of students regarding service quality provided by the university. 1) To determine the students’ satisfaction (opinions) towards the facilities provided by the S.V. University; 2) To analyze the relationship between service quality dimensions attributes of Sri Venkateswara University and students opinions; 3) To eva- luate the impact of service quality dimensions on the overall students’ opinions in the higher education scenario of S.V. University. Significance of the Study There are changes taking place worldwide and the educa- tional institutions today face fresh responsibilities and chal- lenges to prepare students for the future. This study will deter- mine the students’ opinions with regard to service quality pro- vided by the higher education institutions. Like every service oriented organization, a university to has its customers’. It seeks to satisfy its customers, namely its students, by offering courses that help the student, to realize his dream of choosing a career that he likes most. But the students as a customer of the university, evaluates the performance of the university, in terms of the facilities it offers. These facilities may be tangible as well as intangible. Methodology of the Study The present study aims at exploring the impact of service quality on students’ opinions in higher education institution. The primary as well as secondary data were used in the present study. A close ended questionnaire has two sections. Section: A contained demographics (gender, age group, course of study, income of family, marital status and academic year). B consists of 20 variables in which respondents are expected to state their level of feelings regarding each variable. Questionnaires were administered to a total of 140 respondents of higher education of various departments of S.V. University, out of which 120 respondents were taken. The sample consisted of Arts 65, Sci- ence 20, and Management 35. Among them are 62 male, and 58, female. Eighty six (71.7%) students were below 23 years old. Thirty three (38.3%) were between 24 and 26 years old and 1 (.8%) was more than 26 years old. This survey was conducted from 2011 to 2012. All the respondents’ (opinions) are recorded on a model and measured by using a 5-point Likert scale. Model of Research Design To study the students’ opinions the model was developed. Figure 2 provides the conceptual framework to understand the relationship between a university’s vision and the extent to which a student gets satisfaction from the facilities provided by his university. The students’ opinions with regard to the ser- vices offered by the university will be influenced by a number of factors. This evaluation again is of two types-external evaluation factors (the government educational policy, the job opportunities, cultural, social economic and political) and in- ternal evaluation factors (university’s visions, faculty working in the campus, kind of courses offered, competent of adminis- trators, and faculty capable of teaching). Both external and internal factors are considered to be service quality dimension The conceptual model University vision Courses offered Students’ satisfaction Internal factors evaluation Faculty External factors evaluation Government policies Service quality dimensions Figure 2. Sources author: A conceptual framework explaining the service quality interlinks to students opinions paradigm in the university. attributes. All these attributes are interlinked. Hypotheses of Study From the literature the study provides the following hy- potheses. H1: There is no relationship between the selected service quality dimensions and the overall satisfaction of students (stu- dents’ opinions). H2: There is no difference in the overall satisfaction of stu- dents (students’ opinions) in terms of service quality dimen- sions and demographical characteristics, such as gender, age, occupation of the parent, and total monthly income of family. H3: There is no difference in the overall satisfaction of stu- dents (students’ opinions) in terms of course of study, future plan and self supporting courses. Results: Discussion and Analysis The demographic characteristics of the respondents are shown in Table 1. The gender distribution of the respondent groups was uneven, with 51.7 percent being male respondents and 48.3 percent female respondents. The age group of the majority of the respondents was below 23 (71.7 percent). Nearly 38.3 percent belong to the 24 to 26 age group. The above 26 years age group constituted .8 percent of the total respondents. The majority of the parents of the respondents are agriculturists (52.5 percent). Among the parents of the respon- dents 28.3 percent are business men and 11.7 percent are em- ployed. The remaining 7.5 percent are professionals. With re- gard to respondents’ family monthly income, 30 Percent earn less than Rs. 10,000 a month. Another 30 percent earn between Rs. 10,000 and 20,000. Approximately 25 percent of the re- spondents earn between Rs. 20,000 and 30,000. Nearly 9.2 percent of the respondents earn between Rs. 30, 000 and 40,000 a month while only 5.8 percent earn more than Rs. 40,000 a month. Total respondents are 120. Among them 105 respon- dents (87.5 percent) are bachelors and only 15 respondents Copyright © 2012 SciRes. 432  J. G. PALLI, R. MAMILLA Table 1. Demographic and behavioral characteristics of the sample respondents (N = 120). Sl. No Variable Frequency Percent 1 Gender A Male 62 51.7 B Female 58 48.3 2. Age (in Yrs) A Below 23 Yrs 86 71.7 B 24 - 26 Yrs 33 38.3 C Above 26 Yrs 1 .8 3 Occupation A Professionals 9 7.5 B Business 34 28.3 C Employed 14 11.7 D Agriculturist 63 52.5 4 Monthly income A >Rs. 10000 36 30.0 B Rs. 10,000 - 20,000 36 30.0 C Rs. 20,000 - 30,000 30 25.0 D Rs. 30,000 - 40,000 11 9.2 E <Rs. 40,000 7 5.8 5 Marital status A Single 105 87.5 B Married 15 12.5 6 Type of the family A Joint family 55 45.8 B Nuclear family 65 54.2 7 Size of the family A Up to 3 members 27 22.5 B 3 to 5 members 58 48.3 C Above 5 members 35 29.2 8 No. of earning members in the family A One 62 51.6 B Two 47 39.2 C Three & above 11 9.2 9 Course of the study A Arts 65 54.2 B Science 20 16.7 C Management 35 29.2 10 Course running self supporting A Yes 75 62.5 B No 45 37.5 11 Residential location A Rural 81 67.5 B Semi-urban 23 19.2 C Urban 16 13.3 12 Future plan A To study further 29 24.2 B To do job 76 63.3 C To marry 9 7.5 D Other 6 5.0 Source: Primary data. (12.5 percent) are married. Of the total respondents, 55, or 45.8 percent belong to joint family. Nearly 65 respondents or 54.2 percent belong to nuclear families. Of the total respondents 62 or 51.6 percent belong to families with only one earning mem- ber while 47 respondents or 39.2 percent, belong to families having two earning members. Nearly 11 respondents, or 9.2 percent, belong to families having three or more earning mem- bers. With regard to educational background of respondents, 65 respondents opted for arts groups, 20 for science groups and 35, for management groups. Nearly 75 respondents (62.5 percent) opted for self supporting courses while 45 respondents (37.5 percent) were given free seats based on merit. The former have to pay a separate fee for joining the course but the latter do not have to pay any fee. Of the total respondents, 81 or 67.5 percent belong to rural areas and 39 respondents or 32.5 percent belong to urban areas. With regard to future plans of the respondents, 29 respondents (24.2 percent) stated that they plan to study further. The majority of the respondents, that is, 76 or 63.3 percent, stated that they plan to take up a job. Nine respondents (9) said that they planned to get married. Only 6 respondents belong to the “others” category. Expectation-Perception Analysis Table 2 shows the overall ratings of Students’ expectations and perception of S.V. University Tirupati, Andhra Pradesh, and a descriptive summary (using mean and standard deviation) of the level of students’ opinions regarding some attributes of service quality dimensions. The average level of expectation regarding various facilities offered students and the average perception of these facilities were calculated for the overall sample. Cultural and recreational facilities, Quality of books, internet facilities, Cooks possess enough knowledge of cooking, Dining facilities are adequate, Quality equipment in the lab, High qual- ity food and water are supplied, Library staff is polite and helpful. (High perception, high expectation) “Basic infrastructure in the class room, Provision of Xerox facilities, and Sports equipments, training to sportsmen and women, the method of issuing books is effective. (Low expectation, high perception) “Hostel staff is courteous and polite, Health care facilities, Problems of power-cuts and safety, Sports officials take care of students’ legal facilities”. (Higher than average on perception, but below average on expectations) “Regular class works, Audio—visual equipments, Competent lab assistant, are rated. (Below average for both perception and expectation) Student Opinions and Overall Level of Satisfaction with the Service Quality Dimensions. Respondents were also questioned about their overall level of satisfaction (opinions) with the quality of S.V. University ser- vice. The results were summarized in Table 3. The research findings show that 35.8 per cent of the respondents indicated that they agree, followed by 28.3 per cent who strongly agree, 11.7 who are neutral in their opinions and 19.2 per cent who disagree. The mean value of respondent’s overall perceived level of satisfaction was 3.63, which tended toward the high end of the satisfaction scale. This suggests that the S.V. Uni- versity provides students with a satisfactory experience. Copyright © 2012 SciRes. 433 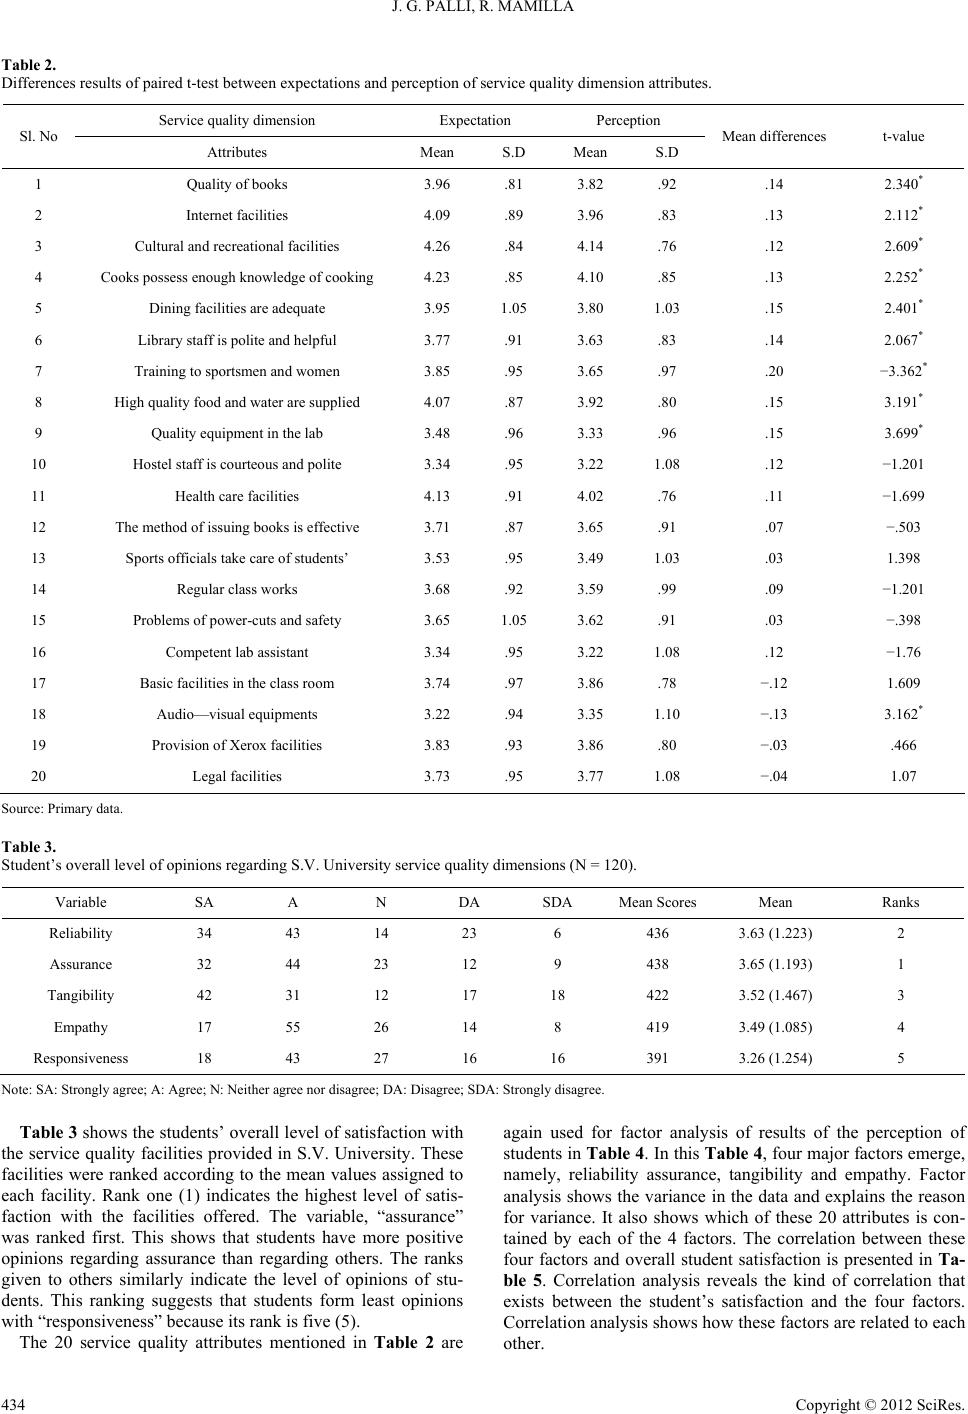 J. G. PALLI, R. MAMILLA Copyright © 2012 SciRes. 434 Table 2. Differences results of paired t-test between expectations and perception of service quality dimension attributes. Service quality dimension Expectation Perception Sl. No Attributes Mean S.D Mean S.D Mean differences t-value 1 Quality of books 3.96 .81 3.82 .92 .14 2.340* 2 Internet facilities 4.09 .89 3.96 .83 .13 2.112* 3 Cultural and recreational facilities 4.26 .84 4.14 .76 .12 2.609* 4 Cooks possess enough knowledge of cooking 4.23 .85 4.10 .85 .13 2.252* 5 Dining facilities are adequate 3.95 1.05 3.80 1.03 .15 2.401* 6 Library staff is polite and helpful 3.77 .91 3.63 .83 .14 2.067* 7 Training to sportsmen and women 3.85 .95 3.65 .97 .20 −3.362* 8 High quality food and water are supplied 4.07 .87 3.92 .80 .15 3.191* 9 Quality equipment in the lab 3.48 .96 3.33 .96 .15 3.699* 10 Hostel staff is courteous and polite 3.34 .95 3.22 1.08 .12 −1.201 11 Health care facilities 4.13 .91 4.02 .76 .11 −1.699 12 The method of issuing books is effective 3.71 .87 3.65 .91 .07 −.503 13 Sports officials take care of students’ 3.53 .95 3.49 1.03 .03 1.398 14 Regular class works 3.68 .92 3.59 .99 .09 −1.201 15 Problems of power-cuts and safety 3.65 1.05 3.62 .91 .03 −.398 16 Competent lab assistant 3.34 .95 3.22 1.08 .12 −1.76 17 Basic facilities in the class room 3.74 .97 3.86 .78 −.12 1.609 18 Audio—visual equipments 3.22 .94 3.35 1.10 −.13 3.162* 19 Provision of Xerox facilities 3.83 .93 3.86 .80 −.03 .466 20 Legal facilities 3.73 .95 3.77 1.08 −.04 1.07 Source: Primary data. Table 3. Student’s overall level of opinions regarding S.V. University service quality dimensions (N = 120). Variable SA A N DA SDA Mean Scores Mean Ranks Reliability 34 43 14 23 6 436 3.63 (1.223) 2 Assurance 32 44 23 12 9 438 3.65 (1.193) 1 Tangibility 42 31 12 17 18 422 3.52 (1.467) 3 Empathy 17 55 26 14 8 419 3.49 (1.085) 4 Responsiveness 18 43 27 16 16 391 3.26 (1.254) 5 Note: SA: Strongly agree; A: Agree; N: Neither agree nor disagree; DA: Disagree; SDA: Strongly disagree. Table 3 shows the students’ overall level of satisfaction with the service quality facilities provided in S.V. University. These facilities were ranked according to the mean values assigned to each facility. Rank one (1) indicates the highest level of satis- faction with the facilities offered. The variable, “assurance” was ranked first. This shows that students have more positive opinions regarding assurance than regarding others. The ranks given to others similarly indicate the level of opinions of stu- dents. This ranking suggests that students form least opinions with “responsiveness” because its rank is five (5). The 20 service quality attributes mentioned in Table 2 are again used for factor analysis of results of the perception of students in Table 4. In this Table 4, four major factors emerge, namely, reliability assurance, tangibility and empathy. Factor analysis shows the variance in the data and explains the reason for variance. It also shows which of these 20 attributes is con- tained by each of the 4 factors. The correlation between these four factors and overall student satisfaction is presented in Ta- ble 5. Correlation analysis reveals the kind of correlation that exists between the student’s satisfaction and the four factors. Correlation analysis shows how these factors are related to each other.  J. G. PALLI, R. MAMILLA Table 4. Factor analysis of results of the perception of students attributes in the S.V. University (N = 120). Factor Loading Attributes Factor 1 Factor 2 Factor 3 Factor 4 Communality Factor1: Reliability Basic facilities in the class room .582 −.011 .088 .170 .375 Audio-visual equipments .555 −.125 .012 −.326 .430 Quality equipment in the lab .511 .340 .091 −.071 .391 Competent lab assistant .505 −.087 .191 .199 .338 Regular class works .473 .089 .207 .191 .312 Problems of power-cuts and safety .403 .336 −.028 −.199 .316 Internet facilities .329 .285 .140 .027 .210 Factor 2: Assurance Hostel staff is courteous and polite .042 .686 .053 −.090 .483 Cooks possess enough knowledge of cooking −.031 .630 .051 .101 .410 High quality food and water are supplied −.123 .474 .432 .237 .483 Dining facilities are adequate .378 .467 .099 .039 .372 Health care facilities .014 .409 .271 .018 .241 Cultural and recreational facilities .309 .408 −.327 .301 .459 Factor 3: Tangibility Quality of books .074 .027 .756 .097 .587 Provision of Xerox facilities .284 .094 .535 −.225 .427 Library staff is polite and helpful .177 .068 .514 .268 .372 The method of issuing books is effective .150 .217 .490 −.142 .330 Factor 4: Empathy Sports officials take care of students’ sports requirements −.082 .042 −.086 .721 .535 Legal factors .207 −.072 .209 .551 .395 Training to sportsmen and women .345 .327 −.065 .442 .426 Eigen value 3.491 1.585 1.419 1.398 Variance (%) 17.454 7.923 7.096 6.992 Cumulative variance (%) 17.454 25.377 32.473 39.465 Reliability alpha (%) (0.350) 57.0 59.0 54.1 40.7 Number of items (Total = 20) 7 6 4 3 Note: Extraction method-Principal COMPONENT Analysis; Rotation method-Varimax with Kaiser normalization; KMO (Kaiser-meyer-olkim measure of sampling ade- quacy) = 0.652; Bartlett’s test of sphericity: p = 0.000 (x2 = 367.269, df = 190); Hotelling’s T-Squared Test = 41.407, F = 1.850, df1 =19 df2 = 101, P = 0.027*. Table 5. Correlation between overall students’ satisfaction and four factors. Factor 1 Reliability Factor 2 Assurance Factor 3 Tangibility Factor 4 Empathy Students Correlation .177* .210* .102@ .019@ Sig. (2-tailed) .043 .021 .265 .833 Overall Students’ Opinions N 120 120 120 120 Copyright © 2012 SciRes. 435  J. G. PALLI, R. MAMILLA Testing of Hypotheses H1: There is no relationship between the selected service quality dimensions and the overall satisfaction of students (stu- dents’ opinions). Factor Analysis: underlying students’ perceptions of service quality dimension attributes variances. The principal components factor method was used to gener- ate the initial solution. The eigen values suggested that a four- factor solution explained 39.465 per cent of the overall variance after the rotation. The factors with eigen values greater than or equal to 1.0 and attributes with factor loadings greater than 0.1 were reported. From the results of the factor analysis the four factors identified are: reliability, assurance, tangibility and em- pathy. The overall significance of the correlation matrix was 0.000, with a Bartlett test of sphericity value of 367.269. The statisti- cal probability and the test indicated that there was a significant correlation between the variables, and the use of factor analysis was appropriate. The Kaiser-Meyer-Olkin overall measure of sampling adequacy was 0.652 which was meritorious (Hair, Anderson, and Black 1999). From the varimax-rotated factor matrix, four factors with 20 variables were defined by the original 20 variables that loaded most heavily on them (loading ≥ 0.1). To test the reliability and internal consistency of each factor, the Cronbach’s alpha of each factor was determined. The re- sults showed that the alpha coefficients ranged from 0.407 to 0.570 for the four factors. The results were considered more than reliable, since 0.50 is the minimum value for accepting the reliability test (Nunnally, 1967). The four factors underlying Students’ perceptions of service quality dimension attributes in S.V. University, Tirupati, were as follows. Reliability (Factor 1) contained 7 attributes and explained 17.454 per cent of the variance in the data, with an eigen value of 3.491 and a reliability of 57.0 per cent. The attributes associ- ated with this factor dealt with the required service items, such as “Basic infrastructure in the class room,” “Audio-visual equip- ments,” Quality equipment in the lab,” “Competent lab assis- tant,” “Regular class works,” “Problems of power-cuts and safety,” and “internet facilities”. Assurance (Factor 2) accounted for 7.923 per cent of the variance, with an eigen value of 1.585 and a reliability of 59.0 per cent. As compared to the factor1 reliability factor 2 assur- ance is greater. It shows stronger views compared to other fac- tors. This factor was loaded with 6 attributes such as “Hostel staff is courteous and polite”, “Cooks possess enough knowl- edge of cooking”, “High quality food and water are supplied”, “Dining facilities are adequate”, “health care facilities” and “Cultural and recreational facilities”. Tangibility (Factor 3) was loaded with 4 attributes. This fac- tor accounted for 7.096 percent of the variance, with an eigen value of 1.419 and a reliability of 54.1 percent. These four at- tributes are “Quality of books”, “Provision of Xerox facilities”, “Library staff is polite and helpful”, “The method of issuing books is effective”. Empathy (Factor 4) contained 3 attributes. This factor ex- plained 6.992 per cent of the variance, with an eigen value of 1.398 and a reliability of 40.7. These attributes are “Sports of- ficials take care of students’ sports requirements”, “legal fac- tors”, and “Training to sportsmen and women”. Hence it is concluded that the results showed below average levels. Based on this derived factor analysis we can analyze further tests like correlation. Correlation Analysis A correlation coefficient measured the strength of a linear between two variables. In the study, a correlation coefficient measured the strength of a linear between the overall satisfac- tion of the respondents and four factors (Reliability, assurance, tangibility and empathy). The correlation between overall sat- isfaction of Students and four factors was positive and was significant at the .05 level (2-tailed). For example, the correla- tion between overall satisfaction and reliability (Factor 1) was .177 (p = .043); the correlation between overall satisfaction and assurance (Factor 2) was .210 (p = .021); the correlation between overall satisfaction and tangibility (Factor 3) was .102 (p = .265), and the correlation between overall satisfaction and empathy (Factor 4) was .019 (p = .833). Therefore, the study indicated that the correlation between overall satisfaction and reliability and assurance was significant at 5 per cent level and overall satisfaction and tangibility or empathy were not significant. These results revealed support for hypothesis 1 that there seems to be a moderate correlation between overall satisfaction and the selected service quality dimension attributes. H2: There is no difference in the overall students’ opinions in terms of service quality dimensions and demographical charac- teristics, such as gender, age, occupation of the parent, total monthly income of family. Demographic differences in overall student’s opinions: Table 6 illustrates two-tailed independent t-test and one- way [ANOVA] results of the mean difference of overall satis- faction by the demographic characteristics of the respondents. The results indicated no significant difference in the overall satisfaction of the respondents in terms of age, occupation of the parent and total household income. Significant difference in the overall satisfaction of the respondents was found only in terms of gender (t = −3.503, p < .05). The results explained that female respondents were more satisfied with service quality attributes of S.V. University than male respondents. Thus, hy- pothesis 2 could be rejected only for gender. H3: There is no difference in the overall satisfaction of stu- dents (students’ opinions) in terms of course of study future plan and self supporting courses. Behavior Differences in Overall Students Opinions: Two-tailed independent t-test and Analysis of Variance (ANOVA) were tested in order to identify the mean differences in overall satisfaction by the behavior characteristics of the respondents. The results are shown in Table 7. The results in- dicated that no significant difference in overall satisfaction of the respondents was found in terms of the self supporting courses, future plan and the course of the study (one-way). However, the results indicated that significant differences were found in self supporting courses (t = 1.905*, p < .05) and Course of the study (F = 2.822*). The study revealed that the respondents who had studied Self Supporting course were more satisfied than the respondents who had studied different courses like Science, Arts, and Management. Conclusion This article focused on the issue of service quality and stu- Copyright © 2012 SciRes. 436  J. G. PALLI, R. MAMILLA Table 6. Two-tailed independent t-test and one-way ANOVA results of the mean difference of overall satisfaction by demographic characteristics of the respondents variable (N = 120). Variable Frequency Mean Gender (t = −3.503*) Male 62 3.316 Female 58 3.717 Age (years) (F = .445@) Below 23 Years 86 3.354 Bt 23 - 26 Years 33 3.418 Bt 26 - 29 Years 1 3.600 Occupation of the parent (F = 2.297) Professional 9 3.489 Business 34 3.457 Employed 14 3.157 Agriculturist 63 3.632 Total household monthly income (F = 2.043) Below Rs. 10,000 36 3.600 Rs. 10,001 - 20,000 36 3.367 Rs. 20,001 - 30,000 30 3.707 Rs. 30,001 - 40,000 11 3.181 40,001 or Above 7 3.457 Table 7. Two-tailed independent samples t-test and one-way ANOVA results of mean difference of overall satisfaction by behavior characteristics of the student respondents. Variable Frequency Mean Self supporting courses (t = 1.905*) Yes 75 3.655 No 45 3.440 Future plan (F = 1.717) To Study Further 29 3.635 To Do Job 76 3.450 To Marry 9 3.822 Other 6 3.200 Course of the study (F = 2.822*) Arts 65 3.575 Science 20 3.490 Management 35 3.400 dents’ opinions. One of the objectives of this study was to in- vestigate the role of opinions and intentions of students by in- corporating a number of factors that are assumed to have an impact on students’ satisfaction, which in turn, would influence intentions. In the consumer behavior literature on the impor- tance of customer satisfaction on profit organizations, it was hypothesized that faculty performance, advising staff perform- ance, and classes would influence students’ academic experi- ence which, in turn, would influence their satisfaction and in- tentions. The course helps them to get ahead in their life career plans and improve skill development measures to a degree to which students believe they are learning the skills they need to succeed in career. The study also revealed that about 55% of respondents had opted for arts group in S.V. University. The respondents who opted for Arts group were more satisfied than those who opted for science and management groups. Espe- cially the reliability of facilities being offered and most impor- tantly the empathy of the administrative staff are significant factors in quality perception. In addition to the learning envi- ronment, certain other essential facilities are also important for the students. By assuring a high quality of service and provid- ing excellent facilities, an institution can attract a lot of students as it comes to be known for its reliability, excellence and the high quality of service it provides. Thus, this finding can be useful to planners to improve and create key facilities to satisfy the students in S.V. University. Suggestions and Directions for Further Research Based on the results of this study, several suggestions can be made to increase the relationship between service quality and students’ satisfaction in the realm of higher education of S.V. University. Hence, it has potential for future research. This finding can be useful to the university authorities towards im- proving the teaching system and to make teachers more ac- countable to students, in formulating strategies to maintain or enhance their competitive benchmarks, of all public and private institutions of higher education. Using the same methodology, further studies can be carried out at the target university to as- sess various tangible and intangible facilities to understand long term implications of service quality improvement efforts. The study has classified students’ views on university ser- vices (High perception, high expectation), (Low expectation, high perception), (Higher than average on perception, but be- low average on expectations), (Below average for both percep- tion and expectation). This classification will help service providers and planners to analyze and identify their strengths, opportunities, threats and weaknesses (SWOT). They also should focus more on low- satisfaction and high-expectation attributes to meet students’ expectations and the study recommends that service providers should make presentations and interpretations of the S.V. Uni- versity by using multimedia in order to improve low-expecta- tion attributes. This study has concentrated on the students’ opinions of ser- vice quality dimensions and other internal and external factors that are interlinked. Future research should focus on the impact of other stakeholders’ perspectives (such as government poli- cies on university education, attitudes of non teaching staff, students’ attitudes regarding new course etc.). Copyright © 2012 SciRes. 437  J. G. PALLI, R. MAMILLA Copyright © 2012 SciRes. 438 REFERENCES Alves, H., & Raposo M. (2010). The influence of university image on students’ behavior. International Journal of Educational Manage- ment, 24, 73-85. doi:10.1108/09513541011013060 Ali, N. A., & Zairi, M. (2005). Service quality in higher education. Working Paper Series, 5, 1-21. Alride, S., & Rowley, J. (2001). Conducts a withdrawal survey. Quality in Higher Education, 7, 55-63. doi:10.1080/13538320120045085 APQN (2003). Association of Indian Universities. Weekly Journal of Higher Education, 50. Bryan, W. A. (1996). What is quality management? New Directions for Student Services, 76, 3-15. doi:10.1002/ss.37119967603 Crawford, L. E. D., & Shutler, P. (1999) Total quality management in education: Problems and issues for the classroom teacher. The Inter- nal Journal of Educational Management, 13, 67-72. doi:10.1108/09513549910261122 Dolnicar, S. (2004). What makes students attend lectures? The shift towards pragmatism in undergrtaduate lecture attendance. Proceed- ings of the Australian and New Zealand marketing Academy Con- ference, Wellington. Dalton, H., & Denson, N. (2009). Student evaluation: What predicts satisfaction? Proceedings of the 32nd HERDSA Annual Conference, Daarwin, 100-110. http://www.Education.Nic.in Edstrom, K. (2008). Was doing course evaluations as if learning mat- ters most. Higher Education Research and Development, 27, 95-106. doi:10.1080/07294360701805234 Hom, W. (2002). Applying customer satisfaction theory to community college planning of counseling services. URL (last checked 7 Janu- ary 2004). http://www.ijournal.us/issue02/ijissue02wilardHom01.htm Hasan, H. F. A., Ilias, A., Rahman, R. A., & Razak, M. Z. A. (2008). Service quality and student satisfaction: A case study at private higher education institutions. International Business Research, 1, 163-175. Jacob, J., & Chestnut, R. W. (1978). Brand loyalty: Measurement and management. New York: Wiley. Mahiah, S., Suhaimi, S., & Ibrahim, A. (2006). Measuring the level of customer satisfaction among employees of human resource division. Advances in global Busines s Research, 3. Mircea, M., & Andreescu, A. J. (2010). Agile system development for the management of service oriented organization. The 11th Interna- tional Conference on Computer System and Technologies, Sofia, 17- 18 June 2010, 341-346. Navarro, M. M., Iglesias, M. P., & Torres, P. R. (2005). A new man- agement element of universities: Satisfaction with the courses of- fered. International Journal of Education Managemen t , 19, 505-526. doi:10.1108/09513540510617454 Palacio, A. B., Menses, G. D., & Perez, P. J. P. (2002). The configura- tion of the university image and its relationship with the satisfaction of students. Journal o f Educational Admini s t r a tion, 40, 486-505. doi:10.1108/09578230210440311 Sproule, R. (2000). Student evaluations of teaching: A methodological critique of conventional practices. Education Policy Analysis Ar- chives, 8, 125-142. Shevlin, M., Banyard, P., Davies, M., & Griffiths, M. (2000). The va- lidity of student evaluation of teaching in higher education: Love me, love my lectures? Assessment and Evaluation in Higher Education, 25, 397-405. doi:10.1080/713611436 Spooren, P., Mortelmans, D., & Denekens, J. (2007). Student evalua- tion of teaching quality in higher education: Development of an in- strument based on 10 Likert-scales. Assessment and Evaluation in Higher Education, 32, 667-679. doi:10.1080/02602930601117191 Sawyer, R. G., & Thompson, E. (2003). Knowledge and attitudes about emergency contraception in university students. College Student Journal, 37, 523-529. Shekarchizadeh, A., Rasli A., & Hon-Tat, H. (2011). SERVQUAL, in universities: Perspectives of international students. Business Process Management Journal, 17, 67-81. doi:10.1108/14637151111105580 Wachtel, H. K. (1998). Student evaluation of college teaching effec- tiveness: A brief review. Assessment and Evaluation in Higher Edu- cation, 23, 191-212. doi:10.1080/0260293980230207 Zeithaml, V. A. (1988). Consumer perceptions of price, quality and value: A means-end model and synthesis of evidence. Journal of Marketing, 52, 2-22. doi:10.2307/1251446 Zeithaml V. A., & Binter, M. J. (2008). Service marketing integrating customer focus across the firm (4 ed.). Boston, MA: McGraw-Hill, 108-109.
|